Feeds:
Posts
Comments

Archive for the ‘Welfare State’ Category

I already shared my thoughts about the value-added tax when discussing fiscal policy with an economist at the Confederation of Swedish Enterprise.

Here’s some of what I said about tax progressivity and the welfare state.

The bottom line is that the American tax system targets the rich. But that’s not the case in Sweden.

If you don’t believe me, let’s see what some left-of-center sources say.

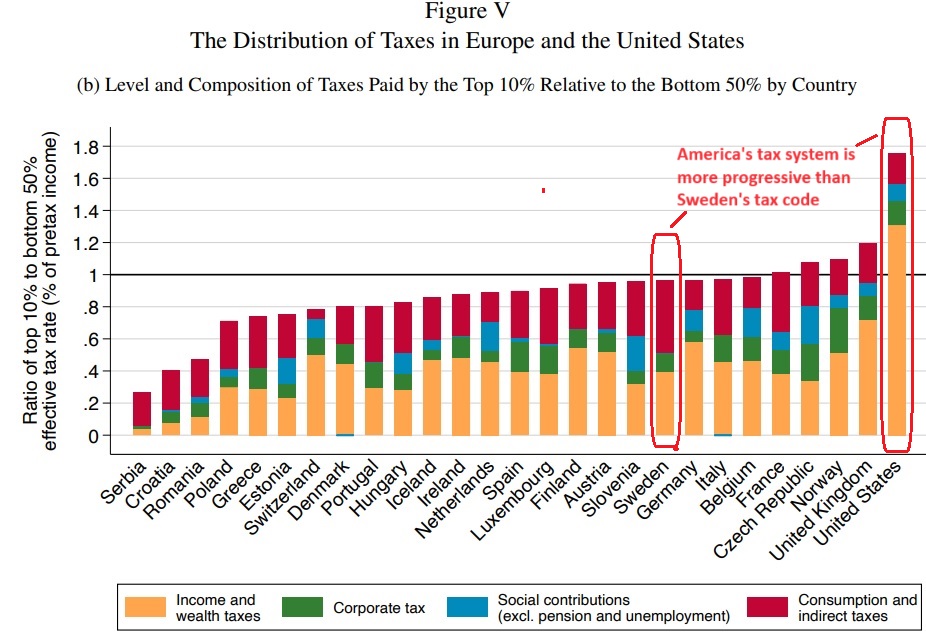
Here’s a chart from a study for the World Inequality Lab by three economists at the Paris School of Economics.

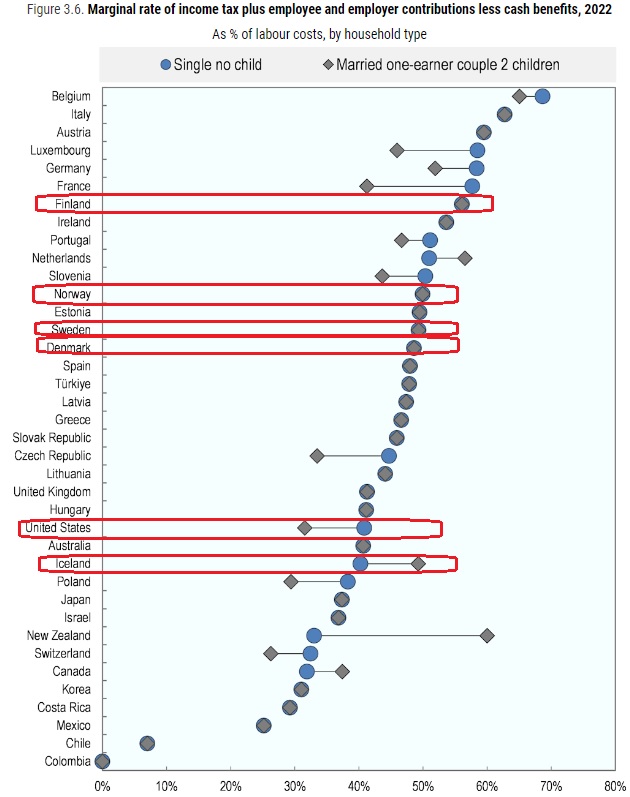
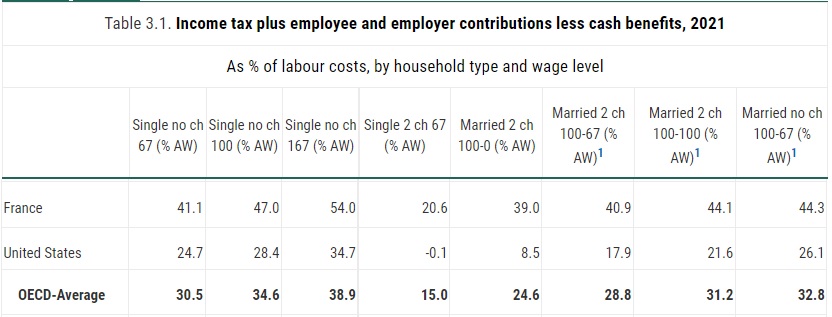
As you can see, the United States is an outlier. The rich pay a much bigger share of the tax burden in America compared to other nations.

Interestingly, it’s not because America imposes higher taxes on the rich. It’s because Europeans impose higher taxes on lower-income and middle-class households.

Want more confirmation from another left-of-center source?

Here are some excerpts from a column in the New York Times by Monica Prasad, a sociology professor at Northwestern.

We can learn from Sweden, but the lesson is not what many people think. Rich Swedes do get taxed at high rates, but so does everyone else: The average American worker’s total tax burden is 31.7 percent of earnings, compared with 42.9 percent for the average Swede. The Swedes actually tax corporations less… 
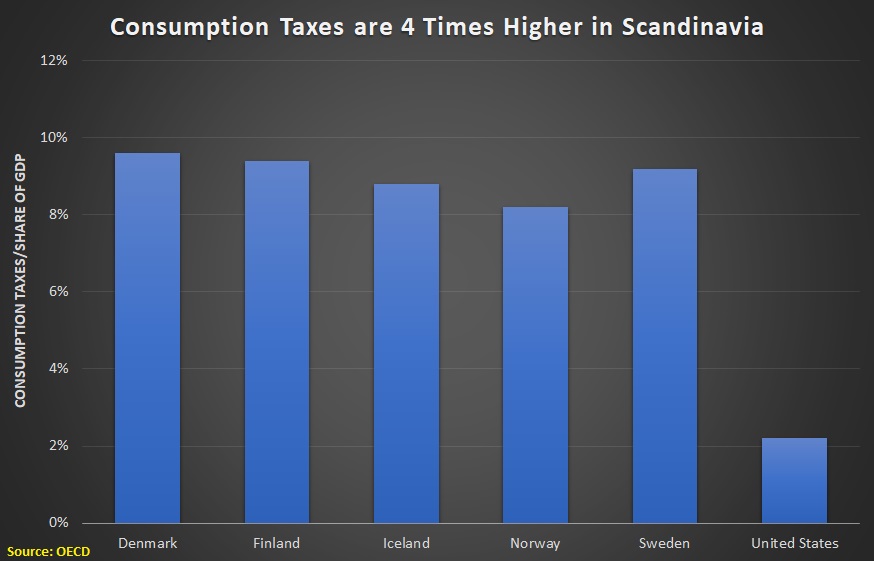
Estate tax? In the United States the average effective rate is 16.5 percent. In Sweden, it’s zero. Swedish national sales taxes, which fall disproportionately on the middle classes, are much higher than sales taxes in the United States. …Some scholars have drawn on this history to argue that the United States needs to give up its fixation with progressive taxation and adopt a national sales tax as every other advanced industrial country has done. …It’s hard to make a case for a big new tax in America on the middle classes and the poor…progressive taxation still has a role to play in the United States — but we do need to learn the larger lesson…the secret of the European welfare states.

Her view of the the “larger lesson” and “secret” is not the same as mine.

She wants an efficient welfare state and – to her credit – she acknowledges that means big tax burdens for lower-income and middle-class households.

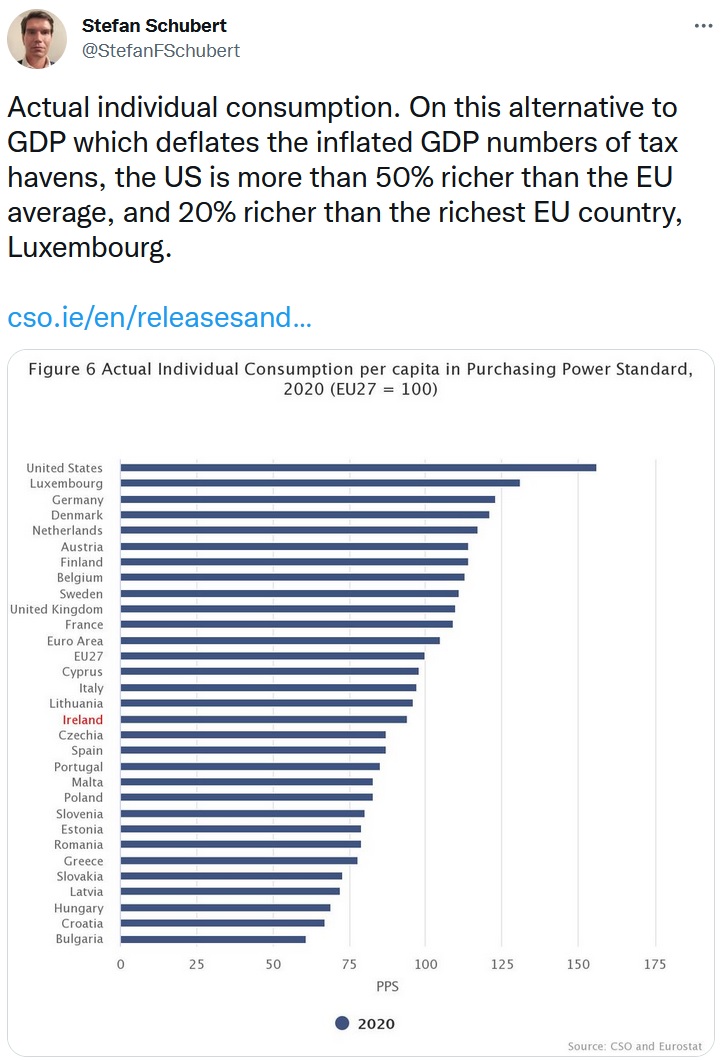
I look at comparative living standards and say “are you $&(#)@* crazy!”

I’ll close by emphasizing a point I made at the end of the above video. Our friends on the left like to argue that big government is popular and they’ll cite polling data to make that case.

But people have much different answers to polling questions when they are asked if they are willing to pay higher taxes to finance bigger government.

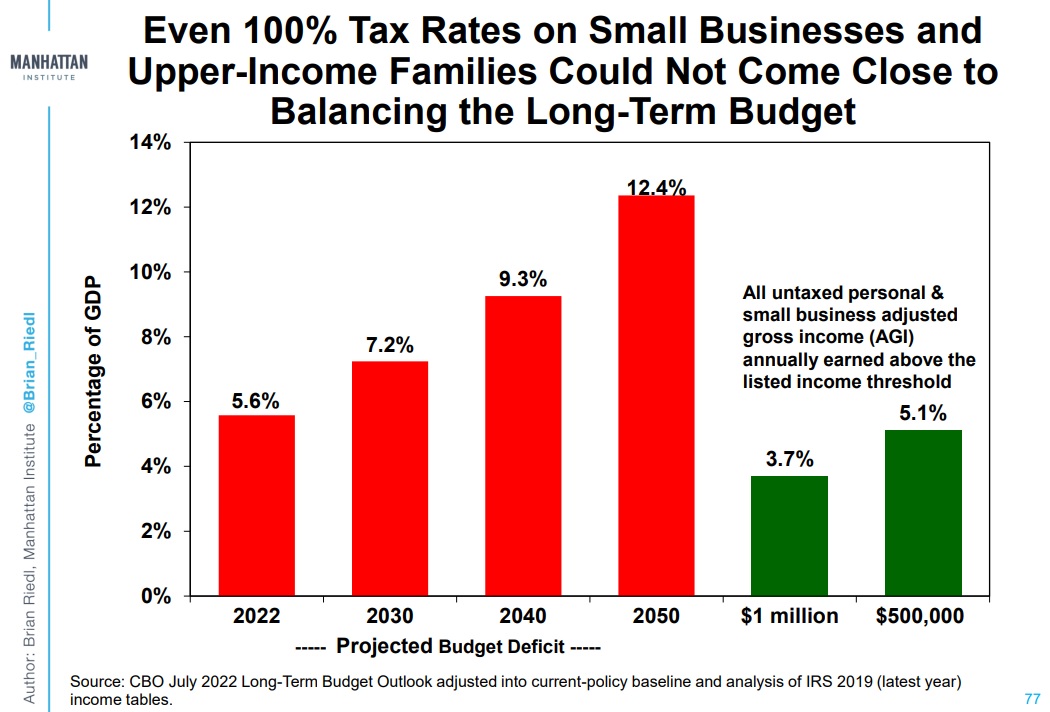
And since there are not enough rich people to finance big government, the only way to have Swedish-sized government is to have Swedish-level taxes on ordinary people.

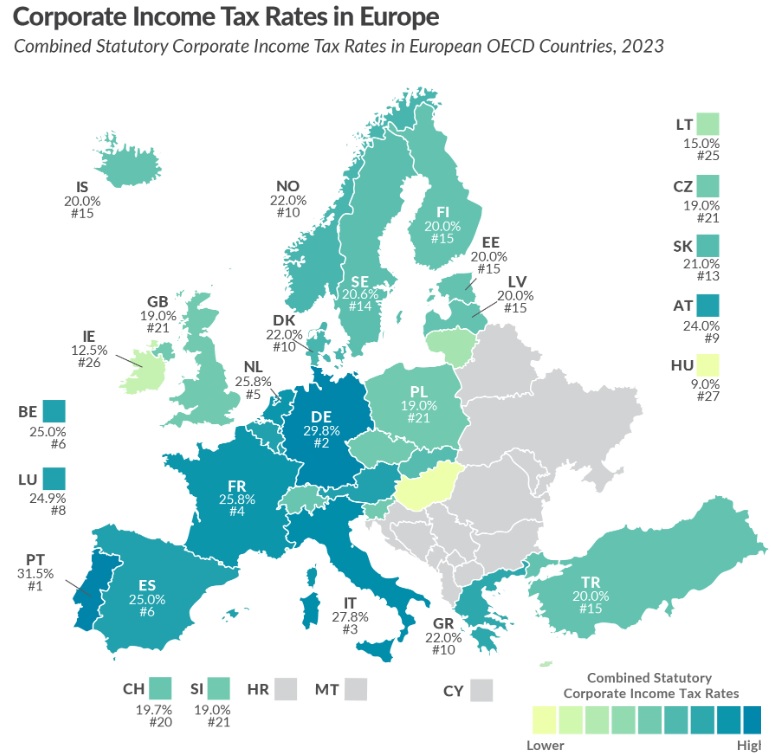
P.S. For those who want to focus solely on the taxation of rich households. Europeans tend to impose higher personal income tax rates but to also have less double taxation of income that is saved and invested.

Read Full Post »

To show that living standards are much higher in the United States than they are in Europe, I periodically share OECD data on average individual consumption (2012, 2014, 2017, 2019, and 2022).

All of which implies that European economies should be growing faster than the U.S. economy.

But that’s not the case. In fact, the opposite is true. There’s anti-convergence.

Today, let’s look at another example, courtesy of a tweet by Jeff Weniger.

For what it’s worth, I think the chart overstates the American advantage (unless I’m misreading, I don’t think the numbers are adjusted for purchasing power parity).

That being said, the trend lines are very consistent with other data showing faster growth in the United States.

To wrap up, let’s look at a specific example of how Americans enjoy higher levels of consumption.

In this case, for housing. Here’s a map of square feet per dwelling that was shared by Prof. Garett Jones of George Mason University.

A dramatic difference, to put it mildly.

When I share this type of data with some of my left-leaning friends, they sometimes tell me that Europeans simply choose to work less and consume less because they value a better quality of life.

The only problem with that claim is that scholarly research shows that Europeans work less because of high marginal tax rates.

Read Full Post »

As part of my everything-you-need-to-know series, I shared an incomprehensible flowchart showing the ridiculous maze of federal welfare programs back in 2015.

Today, let’s look at another visual that captures what’s wrong with the Washington welfare state. As you can see, taxpayers are footing the bill for a system that spends more than twice what would be required to eliminate all poverty.

The chart comes from a new report by Matt Dickerson for the Economic Policy Innovation Center. And the purpose of the chart is to show that the welfare system is grotesquely inefficient.

Here’s some of what he wrote.

…the welfare bureaucracy is broken, making it more difficult for millions of people to achieve the American Dream. …It is demeaning to believe that many Americans are simply unable to be successful and should be relegated to a life of dependence on perpetual government subsidization of their basic needs. …the welfare bureaucracy undermines and discourages employment. Only 18% of able-bodied adults receiving Food Stamps, who are expected to meet work requirements, actually work 20 hours or more per week. …Many welfare programs undermine the institution of the family — and the benefits brought by stable two-parent households — by including marriage penalties. …The principle of subsidiarity dictates that the independent sector, communities, and local and state governments should be empowered rather than the distant and bureaucratic central government. …The welfare bureaucracy is also filled with duplication and overlapping programs. According to the Congressional Research Service, there are 15 different food aid, 13 housing, 12 health care, and five cash aid programs. …Welfare is one of the largest categories of the federal budget, comprising about 20% of annual spending. …the federal government spent more than $28,100 per person in poverty — providing benefits $15,000 above the poverty threshold for individuals

At the risk of understatement, this is an utter disaster.

Terrible for taxpayers. Terrible for poor people.

So why does it exist? This clever cartoon tells part of the answer.

But this is only a partial explanation.

Don’t forget all the bureaucrats, consultants, and contractors who make a lot of money administering the programs. Walter Williams called them “poverty pimps” and they have an obvious incentive to maintain the current system.

I’ll close by emphasizing a point from Matt’s EPIC report. The answer is to get Washington out of the redistribution racket. In other words, copy the success of Bill Clinton’s welfare reform by turning all welfare programs into block grants and putting states back in charge. With the ultimate goal, of course, of phasing out the block grants so that states are fully responsible for raising and spending the money.

P.S. The goal should not merely be reducing poverty, but also reducing dependency.

Read Full Post »

Since this is my last full day in Sweden, I want to build upon my previous two columns (on long-run tax policy and pandemic spending policy).

We’ll start with this video explaining that Sweden is not socialist.

Johan Norberg is correct. Sweden does not have genuine socialism, which involves government ownershipcentral planning, and price controls.

The best way to describe Sweden is that it is a free market economy with bad fiscal policy.

But it used to have good fiscal policy. Very small government and no welfare state.

Unfortunately, policy veered in the wrong direction, especially starting in the 1960s.

But things have gotten better in recent decades. Ten years ago, I wrote about a very impressive period of spending restraint in the 1990s. That was worthy of praise, but what’s noteworthy is there has been no backsliding.

Indeed, IMF data shows that Sweden has continued to make progress, albeit at a slow pace.

It goes without saying (but I’ll say it anyhow) that the burden of government spending is still far too high. But a government that consumes 48 percent of GDP is better than one that consumes 52 percent of GDP.

And 52 percent of GDP is far better than 66 percent of GDP.

Moreover, Sweden has partially privatized its Social Security system, so it’s long-run fiscal problems are not severe – at least not compared to the United States.

But Sweden has made progress is areas other than fiscal policy. Here are some excerpts from a 2014 report by Stefan Fölster and Johan Kreicbergs of the Reform Institute.

The seventies and eighties saw Sweden’s tax burden rise from an average European level to the world’s highest. The public sector expanded vastly. All facets of the welfare system were made more generous… Meanwhile, labour market regulation increased… Throughout these years, Swedes’ individual after-tax real income stagnated, private sector job creation ceased, and public debt spiralled higher. This culminated in a severe economic crisis in the early 1990s. …many Swedes began to react to the country’s lacklustre economic performance… At first, a few public utilities and the financial markets were opened to competition, and an important tax reform was implemented. …emphasis at the time was placed on reforms that opened significant sectors in the economy to greater competition. …significant changes were introduced to the tax system, macroeconomic policy framework, and social insurance system. …The results of this wave of reforms are remarkable. During the twenty years before 1995, GDP and productivity growth was substantially lower than in other countries. Virtually no net jobs were created in the private sector and government debt increased rapidly. Moreover, disposable income of Swedish households grew only in a very slowly. Since 1995, every aspect of the Swedish economy has changed. GDP and productivity growth have been higher than in comparable countries. Employment in the private sector has grown by more than 1% annually, while public sector employment has decreased. Public finances are now stronger than in most countries. Furthermore, median disposable income of Swedish households has grown 4 times faster after 1995, compared to the previous 20 years.

Here’s my favorite chart from the report.

It shows how the numbers of bureaucrats skyrocketed in the 1960s and 1970s, while jobs in the economy’s productive sector languished.

As a result of reforms, however, the number of bureaucrats has decline and jobs in the private sector have increased.

The net effect of all the reforms – lower tax rates, reduced spending burden, deregulation, etc – has been very positive.

Sweden was losing ground during the era of expanding government and now it is once again gaining ground.

Let’s close with an amusing look at how Sweden’s reforms are making it difficult for the left to cite Sweden as a role model.

That’s not good news for Bernie Sanders.

The bottom line is that Sweden is not Singapore. It’s not Switzerland, either.

But it’s better than people think. And its economic history shows that bad policy lowers living standards and that good reforms improve living standards.

P.S. Sweden also has nationwide school choice.

Read Full Post »

If I want to educate someone about the harmful impact of America’s counterproductive welfare state, there are several items I like to share.

I augment those visuals with other analysis, such as my two-part series (here and here) on the right and wrong way to reduce poverty (Hint: the ultimate goal should be reducing dependency).

And I just read a sobering article by John Goodman that I’ll add to my list. Here are two shocking/depressing findings that he shared.

First, in many cases, households that mooch get more money than households that work.

…the bottom fifth of households in 2017 had an average (after tax and after transfer) income of $33,653 per person. …The per capita income of second fifth in 2017 was $29,497; and for the middle fifth it was $32,574. Those with the least earned income had more actual total income than those in the next two higher quintiles! The average household in the bottom fifth received 14 percent more income than the average second-fifth household and 3.3 percent more than the average middle-income household.

As you might predict, people respond to incentives. John reports that the excessive welfare state has greatly undermined incentives to be productive.

Since the War on Poverty started in 1965, the labor force participation of the bottom one-fifth of households has dropped from 70 percent to 36 percent. As a group, this one-fifth now receive more than 90 percent of their income from government. For this group, our welfare system has substituted in-kind benefits for labor market income.

These two sets of numbers are horrific. We basically have a system that tells people they are chumps if they work. Their reward for work is to pay taxes.

But if they become wards of the state, they can play video games all day and get lots of freebies.

That’s a recipe to destroy societal capital.

P.S. For readers who want some international evidence, I have a three-part series (here, here, and here) on how the welfare state is hurting European nations.

P.P.S. The Biden Administration wants to lie about the definition of poverty. Which may or may not be worse than their celebration of dependency.

P.P.P.S. Here’s a ranking of which states exacerbate the problem of redistribution.

Read Full Post »

In Part I of this series, I explained that the War on Poverty, launched by Lyndon Johnson and expanded by other profligate presidents, has been bad news for both taxpayers and poor people.

More specifically, I shared some academic research showing how it led to a big increase in dependency on government.

Let’s expand on that topic today by looking at a column published last week by National Review.

Authored by Angela Rachidi of the American Enterprise Institute, it compares the two ways of reducing poverty and deprivation. Here are some excerpts.

President Johnson introduced his Great Society agenda, setting the stage for the vast federal anti-poverty bureaucracy that we have today. Passage of programs such as Medicaid, Head Start, and a nationalized Food Stamp Program followed, and today, the federal government funds more than 80 means-tested programs or services… Unsurprisingly, this approach set the federal government on a disastrous fiscal path. Federal expenditures on means-tested programs have increased eightfold since the War on Poverty started, equating to an additional $800 billion per year in today’s dollars. …expanding transfer payments to reduce the poverty rate was simply a mathematical achievement. Fundamentally improving the lives of poor families has proved an entirely different task. …the key to the problem of poverty in this country was a failure among young people to achieve key life milestones. …when young people graduated high school, worked full-time, and married before having children, their odds of living in poverty dramatically reduced. …Analyzing 15 years of longitudinal data consisting primarily of poor unmarried mothers…, I find that many disadvantaged unmarried mothers were able to rise out of poverty when they later achieved success sequence milestones, even though they started on a different path. For example, 15 years after giving birth to a child outside of marriage, only 9 percent of mothers who earned a high school education, worked full-time, and later married were in poverty. Among mothers who failed to complete any of those three steps, the poverty rate was 79 percent.

Those “success sequence milestones” sounded familiar.

Sure enough, they are similar to what my late, great, friend Walter Williams wrote many years ago.

The problem, of course, is that government penalizes you if you get a job or get married.

Though I’m guessing the problem is worse in places like New York in California than in states like Florida and Texas.

P.S. Biden and other folks on the left want to bastardize the definition of poverty in hopes of further expanding the welfare state and creating more dependency.

Read Full Post »

I’ve previously pointed out that the so-called War on Poverty is a failure, both for poor people and for taxpayers.

My main argument is that poverty was steadily declining throughout American history, but that progress ground to a halt once politicians in Washington decided to spend trillions of dollars.

As you might expect, folks on the left have a different perspective. Or, to be more precise, they have two different perspectives.

  1. Some left-leaning people assert that that the post-1965 lack of progress is evidence that we need to have even more redistribution.
  2. But some of them instead assert that there has been a lot of progress, but not the kind that shows up in the official measure of poverty.

Today, let’s examine the second argument.

We’ll start with a chart showing many different ways to measure poverty.

The official poverty rate (“Official Poverty Measure”) comes from the Census Bureau and it gets the most attention in the media and elsewhere.

But is it the right measure, and does it show the impact of redistribution programs?

In a study published by the Journal of Political Economy, Richard V. BurkhauserKevin CorinthJames Elwell, and Jeff Larrimore put together a “full poverty measure” that captures the value of various handouts.

Based on their approach, there is almost no material deprivation in the United States. Their poverty rate as of 2019, shown in the above chart, was just 1.6 percent.

Here’s some of what they wrote.

Almost 60 years have passed since President Johnson declared his War on Poverty. Even so, academics and policy makers still debate its outcome. …disagreement over progress in the War on Poverty stems from disagreements over how poverty should be defined… We…create a poverty measure…which we refer to as the absolute full-income poverty measure (FPM)… We include both cash and in-kind programs designed to fight poverty, including food stamps (now the Supplemental Nutrition Assistance Program [SNAP]), the school lunch program, housing assistance, and health insurance. Finally, we hold poverty thresholds constant in inflation-adjusted terms using the Personal Consumption Expenditures (PCE) price index. Using this poverty measure, we find substantial reductions in poverty based on President Johnson’s standards. Specifically, we find that the absolute FPM poverty rate in 2019 was 1.6%, well below the official poverty rate of 10.5%.

Incidentally, the official poverty rate is now 11.5, so perhaps the authors’ FPM measure also has increased a bit.

But that’s not important for our discussion today. Instead, let’s consider whether their FPM measure shows that the War on Poverty has been a success.

The answer depends, at least in part, of whether you think government dependency is an acceptable outcome.

Here are some further excerpts from the study.

…we evaluate the extent to which poverty has fallen as a result of increases in market income versus increases in government transfers. As President Johnson further stated in his State of the Union address on January 8, 1964, “The War on Poverty is not a struggle simply to support people, to make them dependent on the generosity of others”… Contrary to this goal of President Johnson, we estimate that dependence—which we define as receiving less than half of full-income from market sources—among working-age individuals increased from 4.7% to 11.0% between 1967 and 2019. Likewise, dependence among children increased from 6.0% to 13.1%. …Success in reducing material hardship has come at the cost of having a greater share of the population dependent on government for at least half of their incomes.

Here are some charts from the JPE article, all of them showing how dependency increased for just about all groups in society.

Here’s one final excerpt, showing the difference between the right way and wrong way of reducing poverty.

…the War on Poverty…was not won by making people more self-sufficient, as President Johnson sought. Dependence (defined as receiving less than half of household income from market sources) among working-age adults and children more than doubled from 1967 to 2019. However, the rise in dependence was not uniform over the entire period, with dependence falling substantially, especially among children and non-aged Black individuals, from 1993 to 2000. This period is coincident with welfare reforms that required and encouraged work as well as a strong labor market.

This echoes my view that Bill Clinton’s welfare reform (replacing an entitlement with a block grant) was very successful and that it should be extended to other redistribution programs such as Medicaid and food stamps.

And it reinforces my view that Biden’s proposal for per-child handouts would be very harmful. The goal should be employment and self-sufficiency, not dependency and bigger government.

P.S. We can learn lessons about welfare and dependency by looking at data from Europe and Canada.

Read Full Post »

I wrote two months ago that President Ronald Reagan did a good job with regards to government spending. I echoed that sentiment in this recent interview.

I’ve tried to show Reagan’s success with various charts (see here, here, here, and here).

Today, let’s try a new visual.

This chart is taken from data in Table 8.4 of the OMB’s Historical Tables on the Budget. I added Column E (non-defense discretionary) and Column H (programmatic mandatory, i.e., entitlements) to come up with a measure of total domestic spending as a share of economic output.

Here are the key takeaways from the chart.

  • Reagan moved policy in the right direction, shrinking the burden of domestic spending (and this chart doesn’t even fully capture what he achieved since he was able to rescind some of the spending in Jimmy Carter’s last fiscal year).
  • All other presidents did a bad job, but LBJ and Nixon were especially awful (as also confirmed by long-run fiscal data) when looking at the pre-Reagan years.
  • Looking at the post-Reagan years, there’s been a steady increase in the burden of domestic spending, punctuated by two episodes of massive one-time spending increases that are identified on the chart.
  • We got decent results during the Clinton years, which in part was because of the GOP landslide in 1994, so plenty of credit to share.

The bottom line is that Reagan showed that a principled president can make progress.

Given America’s current fiscal trajectory, it’s more important than ever to mimic his successful policies today.

P.S. If you have some time to spare, click here for a two-hour video showing how Reagan (and Thatcher) saved the western world.

Read Full Post »

Last month, I shared data on per-capita welfare spending in American states.

The big takeaway was that states such as New York and California were spending more tan twice as much as states such as Texas and Florida. And I concluded that “Florida and Texas presumably are reducing poverty while states such as New York and California are subsidizing it.”

Are there similar numbers for the entire world? Can we see which countries have the most redistribution spending, on a per-capita basis?

I did something like that in 2019, but the comparisons were based on social welfare spending as a share of economic output, not on a per-capita basis. And the data only covered industrialized nations.

My (admittedly cursory) online search did not unearth any comprehensive country-by-country data, but this a good opportunity to share data on the Europe’s welfare spending as a share of the world’s total.

Here’s a shocking graph from a 2012 World Bank report.

Keep in mind, as you look at this data, that Europe’s population is only about 10 percent of the world total.

This has to be Europe’s most depressing chart. People have quibbled about these numbers, and we also have to assume that there may have been some changes over the past 10 years.

But it’s a safe guess that any “improvement” in Europe’s numbers would be because other nations expanded redistribution, not because European government became more fiscally prudent.

The bottom line is that European welfare states are too burdensome and that won’t end well.

P.S. By some measures, the U.S. is more redistributive than Europe. But that’s only because so much redistribution in Europe is financed by huge tax burdens on lower-income and middle-class households.

P.P.S. The World Bank study cited above also had some powerful data on the harmful impact of excessive government spending.

Read Full Post »

When I ask my leftist friends to identify a nation that got rich with big government, the knowledgeable ones try to change the subject.

The ones who are not well informed will oftentimes cite Denmark.

It is true that Denmark has a big and expensive government.

And it also is true that Denmark is a rich nation by world standards (though well behind the United States).

But it is not true that Denmark became a rich country with big government.

Instead, it got rich when government was small.

I’ve made that point before, but let’s take a deeper look at that issue.

The Fraser Institute just published The Free Enterprise Welfare State: A History of Denmark’s Unique Economic Model. The first chapter, authored by Lars Christensen, Matthew Mitchell, and Steven Globerman, includes some fascinating fiscal history about Denmark.

This chapter examines the growth of the Danish economy during the last 150 years… A strong commitment to classical liberal economic policies aimed at enhancing the rule of law and minimizing the role of government in the economy was at the heart of Denmark’s economic development. The late 1800s and early 1900s marked a period of primarily laissez faire economic policies for the country. …Details about government spending provide one indication of the government’s limited role in the economy. Figure 1.3 shows central government spending as a share of GDP in the 1870s (when available) and in 1929 for five European nations. Not only did Denmark spend significantly less than others as a share of GDP, but its spending as a share of GDP changed very little over this 60-year period.

Here’s the aforementioned Figure 1.3, showing that the fiscal burden in Denmark was tiny during the period when the country went from agricultural poverty to middle-class prosperity.

Keep in mind that these were also years when Denmark had almost no redistribution.

Its welfare state was smaller than what Hong Kong has today.

The authors then explain that government was still small at the end of the 1930s.

Notwithstanding increased government spending on social and public works programs, the size of government in Denmark was still limited at the end of the 1930s (see figure 1.6) and there remained a broad political consensus that the Danish economy should be based on free market principles and free trade. Even though there had been a gradual shift towards more income redistribution, the role of government in the economy remained limited.

Here is Figure 1.6.

You can see that the burden of government spending is higher than it was in 1870 and 1929, but still below 10 percent of GDP.

By way of comparison, the spending burden in Denmark in 1938, measured as a share of GDP, was only about half the size of government today in “small-government” jurisdictions such as Singapore and Taiwan.

The relatively good policy continued for a couple of decades after World War II.

..the size of the government, measured as a percentage of GDP, was actually lower in Denmark and Sweden than it was in the United States and the United Kingdom throughout the 1950s, ’60s, and ’70s, as shown in figure 1.9. At that time, neither Denmark nor Sweden had the kind of universal welfare states that we are familiar with today. In fact, both countries stayed relatively faithful to the traditional liberal economic values that had fuelled their economic expansions nearly a century before. As a result, Denmark became wealthy before substantially increasing government spending and taxes to support the large welfare state we associate with the country today.

Here’s Figure 1.9, showing that Denmark (as well as Sweden) were more frugal than the United States as recently as 1970.

Let’s conclude with bad news.

The welfare state in Denmark dramatically expanded starting in the late 1960s.

…it was during the late 1960s that things began to change. … from 1965 to 1980, total taxes as a share of Denmark’s Gross Domestic Product increased from 29 percent to over 40 percent (see figure 1.10). The two most important categories of central government spending financed by the increased tax revenues were social services and education. …the country has had some major policy setbacks, most notably the major macroeconomic policy mistakes of the 1970s when an explosion of government spending contributed to rapidly increasing wages, serious structural unemployment, relatively rapid price increases, and a balance of payments crisis.

The country has tried to claw back some of that excess spending in recent years, but the public sector remains an enormous burden.

Fortunately, the country follows very pro-market policies in other areas such as trade, regulation, and monetary policy.

So the net result is that Denmark rivals the U.S. in terms of overall economic liberty (and is much better than Hungary, a nations that some American conservatives greatly admire).

Read Full Post »

I periodically explain that redistribution is bad for prosperity, mostly because it encourages sloth and dependency among recipients.

Though it is important to realize that the taxes needed to fund redistribution also are harmful (the magnitude of the problem can be viewed here and here).

I also periodically share new scholarly research on these issues.

And that’s our topic for today since the U.K.-based Centre for Economic Policy Research has published some new research about Italy.

The study, which looks at why Northern Italy is much more prosperous than Southern Italy, was authored by Jesús Fernández-Villaverde, Dario Laudati, Lee Ohanian, and Vincenzo Quadrini.

We’ll start by confirming there is a big difference in relative living standards. As you can see from this chart, this gap has existed ever since Italian unification in the 1800s and is bigger now than it was 100 years ago.

Here are some key findings, most notably the harmful impact of redistribution..

In a new paper (Fernández-Villaverde et al. 2023), we seek to identify the major drivers of the regional income differences in Italy using the macroeconomic approach based on the measurement of various wedges… The model consists of two integrated regions. The first is representative of the Northern and Central regions. The second is representative of the Southern and Island regions. …our goal is to understand which of the measured wedges are especially important for generating lower income in the South. …We…find that inter-regional fiscal transfers contribute significantly to regional income differences (see Figure 2). The combined contribution of productivity differences and inter-regional fiscal transfers accounts for more than 70% of the income gap between Southern and Northern regions. The finding that inter-regional fiscal transfers contribute to regional income disparities is the most interesting finding, and the intuition is straightforward. First, inter-regional fiscal transfers are large. …In the counterfactual steady-state equilibrium without fiscal transfers, the output gap between the South and the North is reduced by one-fourth.

That’s remarkable. One-fourth of the gap between Northern Italy and Southern Italy could be eliminated simply by getting rid of redistribution.

Here’s the aforementioned Figure 2, which also is a good depiction of the dramatic difference between north and south.

There’s one other aspect of the study that is worth mentioning.

In their research on regional prosperity, the authors find that funds for “regional development” are not helpful.

And that is true regardless of whether the handouts come from Rome or Brussels.

Italy has invested large funds in regional development for decades. Were these monies well spent? …Nowadays, the European Structural and Investment Funds account for more than one-third of the whole budget of the EU, with a forecasted expenditure of €392 billion in 2021-2027. Will these funds make a difference? Our paper’s results cast doubt on the efficacy of these regional policies per se

I’m shocked, shocked.

P.S. The good news for Italy is that policy is not getting worse over time, but that also can be bad news since the country needs some shock therapy to avert a rather grim future (elaborated on here and here).

P.P.S. Not only does Italy provide some good evidence on the damage caused by redistribution, it also has led to research showing the harm of red tape.

Read Full Post »

Scandinavian countries have very unusual economic policy. They are very free market-oriented with regards to most types of economic policy.

The glaring exception is fiscal policy, where these nations get very low scores. The burden of government spending is very high, and that unsurprisingly also means very onerous tax policies.

The rich pay high taxes, of course, but the overall burden on upper-income taxpayers in Scandinavian nations is very similar to the tax burden on rich Americans.

The big difference between the U.S. and Scandinavia is the treatment of middle-class taxpayers.

Here’s some data from the OECD showing the marginal tax rate on two types of ordinary households. I’ve highlighted the U.S. and Scandinavian countries and you can see that every Scandinavian nation other than Iceland grabs a much bigger chunk of people’s income.

I decided to share this chart because I just came across a must-read article by Brian Riedl and John Gustavsson in the Manhattan Institute’s City Journal.

Here’s some of what they wrote about Scandinavian taxation.

The Nordic reality doesn’t reflect the progressive caricature. Finland, Norway, and Sweden collect an average of 42.6 percent of GDP in taxes, versus the 26.6 percent collected by America’s federal, state, and local governments. However, 14 percentage points of this 16-percentage point overage come from higher payroll and value-added tax (VAT) revenues that broadly hit the middle class. …Scandinavia’s additional tax revenues come mainly from slamming their middle classes with steep social security, consumption, and income taxes. How steep? Total social security taxes (including those employers pay) are twice as high in Sweden (31.42 percent) and nearly one-third higher in Norway than in the United States. Nordic VAT rates of approximately 25 percent raise roughly 9 percent of GDP in revenues, while America has no national VAT.

And when you compare the aggregate burden of Scandinavian consumption taxes with state sales taxes in the United States, you can understand how the middle class in America is comparatively lucky.

Here’s a chart based on OECD data.

The Riedl/Gustavsson article explains why Nordic-style taxation would be undesirable in the United States, all of which is true.

Heck, Nordic-style taxation is also undesirable in Nordic nations!

That being said, there are some policies in Scandinavian nations that I would like to copy. Like private social security in Denmark and Sweden. Like school choice in Sweden. Like spending restraint in Denmark. And privatized fisheries in Iceland.

Read Full Post »

Part I of this series reviewed some data about the United States growing much faster than the welfare states of the European Union.

Part II of the series looked at some very depressing data about the European Union losing ground compared to the United States, even though convergence theory tells us that should not happen.

For today’s installment, let’s see what the European Union’s statistical body concluded in a new report about the region’s economic performance. We’ll start with this chart showing that inflation-adjusted disposable income (the blue line) declined last year.

To be sure, American households also suffered a decline in inflation-adjusted income, so this is not just a Europe-specific problem.

Here’s some of Eurostat’s analysis.

…the nowcasted median disposable income will decrease in real terms in most EU countries. Rising prices for essential items (goods and services), such as food, energy and transport were the main reason for the decrease of the real income. …It is estimated that inflation led to a 1.9 % decrease for EU median disposable income in real terms in 2022 (compared to 2021). The effect of inflation is likely stronger for low-income households, as essential items represent a higher share of their overall consumption, and they have little margin for adjusting their consumption. In this context, the at-risk-of-poverty rate anchored in 2021…is estimated to statistically significant increase for about half of the EU countries. …Figure 6 shows the change in median disposable income in real terms at country level. The largest decreases were estimated in Estonia, Latvia, the Netherlands, Denmark, Slovakia and Czechia. It increased most sharply in Hungary and Bulgaria.

Here’s the map showing which nations enjoyed more real income in 2022 (dark blue) and which ones suffered big losses (dark orange).

Though don’t assume that nations such as Hungary and Bulgaria had good policy.

Inflation-adjusted disposable income can go up for good reasons (faster growth, lower taxes), but it also can increase for not-so-good reasons (more handouts).

P.S. The data above does not include the United Kingdom, which wisely left the European Union, or Switzerland, which wisely never joined.

Read Full Post »

In Part I of this series, we learned from a report in the Wall Street Journal that the combined economies of the European Union have grown by only 6 percent over the past 15 years compared to 82 percent growth in the United States.

That is stunning evidence that big welfare states lead to economic stagnation.

For Part II, let’s look at a remarkable new study by the Brussels-based European Centre for International Political Economy.

We’ll start with this chart, which shows that the U.S. is much richer. But what’s especially noteworthy is that the gap between the U.S. and E.U. keeps widening even though convergence theory says poorer nations should grow faster than richer nations.

Given the E.U.’s dismal performance over the past 15 years, it seems like the “anti-convergence” is becoming even more pronounced.

Here is some of the analysis from the report, authored by Fredrik Erixon, Oscar Guinea, and Oscar du Roy. They start by emphasizing the importance of long-run growth.

…it is the long-term trend that matters. An economy that grows at 3 percent per year will double in 24 years but an economy that grows at 1 percent per year will double only in 48 years. …If European countries were states in the United States, many of them would belong to the group of poorest… The result of this economic divergence between EU member states and US states is a growing wedge of GDP per capita between the EU and the US, which in 2021 was as large as 82 percent. If the trend continues, the prosperity gap between the average European and American in 2035 will be as big as between the average European and Indian today. …Economic growth in the Euro Area, a region that is comparable with the US, has been deeply disappointing: the region has been falling behind the US since the 1980s… At the current growth rates, it will take 20 years for output per person to double in the US, while in the EU it would take 43 years! …only two EU member states, Luxembourg and Ireland, have a GDP per capita higher than the US average.

One of the most interesting things about the report is the comparison of E.U. nations to American states.

As you can see, almost all American states rank about almost all European nations.

By the way, the above ranking is based on GDP per capita and the report notes that this approach overstates the prosperity of Luxembourg and Ireland.

…their GDP per capita overestimates their level of prosperity. In Ireland, GDP is boosted by large foreign pharmaceutical and IT multinationals based in the country which, while producing goods and services in Ireland, record a significant proportion of their global profits within Ireland. The Central Bank of Ireland estimated that Ireland should instead rank between the 8th and 12th position in the EU if the relevant parts of per capita income are considered. For Luxembourg the story is slightly different. High GDP per capita is mainly due to the cross-border flows of workers in total employment, as they contribute to overall GDP but are not residents of the country.

If you want a less-distorted view, I recommend the OECD’s data on per-capita “Actual Individual Consumption.” And the U.S. lead based on AIC data also has expanded over time.

Read Full Post »

At the risk of being repetitive, I’ve been arguing (and arguing, and arguing) that the United States should not turn its medium-sized welfare state into a European-style, large-sized welfare state.

Simply stated, that’s a route to economic anemia.

If you don’t believe me, look at this shocking chart, which compares European stagnation to American growth over the past 15 years.

The chart comes from a report in the Wall Street Journal. Here are some excerpts from that article.

Europeans are facing a new economic reality… They are becoming poorer. …Private consumption has declined by about 1% in the 20-nation eurozone since the end of 2019 after adjusting for inflation… In the U.S., where households enjoy a strong labor market and rising incomes, it has increased by nearly 9%. …Adjusted for inflation and purchasing power, wages have declined by about 3% since 2019 in Germany, by 3.5% in Italy and Spain and by 6% in Greece. Real wages in the U.S. have increased by about 6% over the same period… The eurozone economy grew about 6% over the past 15 years, measured in dollars, compared with 82% for the U.S. …Weak growth and rising interest rates are straining Europe’s generous welfare states… given rising borrowing costs, economists expect taxes to increase, adding pressure on consumers. Taxes in Europe are already high relative to those in other wealthy countries, equivalent to around 40-45% of GDP compared with 27% in the U.S. American workers take home almost three-quarters of their paychecks, including income taxes and Social Security taxes, while French and German workers keep just half.

The last line in the above excerpt merits special attention.

Big government in Europe is very bad for workers, who earn less income. But, to make matters worse, taxes consume a bigger chunk of their smaller incomes.

And the income gap is growing every years, as illustrated by this chart from the article.

Note, by the way, that Greek wages have dropped by nearly $10,000 since 2008. That is partly a consequence of that nation’s fiscal crisis.

As I’ve warned, the same thing is about to happen to Italy.

P.S. And if we don’t reform entitlements in the United States, we’ll eventually suffer the same fate (though politicians will first spend a couple of decades raising taxes and repeating Greece’s mistakes).

Read Full Post »

Ronald Reagan has many famous quotes, including “government is the problem” and “The nine most terrifying words in the English language are ‘I’m from the government and I’m here to help.'”

Channeling Reagan’s wisdom, I have repeatedly shared examples of how government makes things worse rather than better.

If it is any comfort, however, politicians in other nations routinely also make the mistake of thinking (or claiming) that more government can solve problems.

A report in the New York Times by Constant Méheut asks why there is ongoing discontent in French neighborhoods where the government has spent billions of euros.

After the 2005 riots, the French government invested billions of euros to revamp its immigrant suburbs, or banlieues, to try to rid them of run-down social-housing blocks. But the similarity of the recent riots, and what spurred them, almost a generation later has raised questions about whether the efforts to improve conditions in the banlieues have failed. …The reasons for the failure, they say: Change has come too slow, and, perhaps more important, the government programs have done little to address deeper, debilitating issues of poverty… Clichy-sous-Bois embodies the challenges facing France. The city was the center of the 2005 riots and has since become something of a laboratory for the changes promised by various governments. New social housing has sprung up in many neighborhoods. A government-funded cultural center opened in 2018… But when riots broke out across the country after the recent police shooting, Clichy-sous-Bois was hit hard again… A 2018 parliamentary report noted that the successive governments’ efforts to improve life in the suburbs had mostly failed, in part because they did not focus enough on helping residents escape poverty.

The article does not say how many billions were spent, but France has the highest burden of government spending in Europe. Which is saying something.

And it has the biggest welfare state. Along with stifling taxes.

Have those policies worked? Of course not.

Like many European welfare states, France is economically lagging.

It is also a country where poor people get plenty of handouts, but the article reminds us that that government spending to “help” the poor has an unfortunate consequence of trapping them in poverty (a problem that also exists in the United States).

P.S. None of this is a surprise to people who understand economic history.

Read Full Post »

The big fiscal debate in the United States is whether the United States should become a European-style welfare state, which is something that automatically will happen over the next few decades in the absence of genuine entitlement reform.

Some people even want to accelerate this process.

My response is usually to ask why the United States should copy Europe when there is a wealth of evidence that living standards are substantially lower on that side of the Atlantic Ocean.

Not only are living standards lower, but there is also lots of evidence that Europe is suffering from anemic growth.

Which means the gap in living standards is getting wider every year.

At the risk of understatement, copying European fiscal policy seems like a big mistake.

If you’re still not convinced, here’s some more evidence. In his column for the U.K.-based Financial Times, Gideon Rachman compares the U.S. economy to what’s happening in Europe.

The US economy is now considerably richer and more dynamic than the EU or Britain — and the gap is growing. …In 2008, the EU and the US economies were roughly the same size. But since the global financial crisis, their economic fortunes have dramatically diverged. As Jeremy Shapiro and Jana Puglierin of the European Council on Foreign Relations point out: “In 2008 the EU’s economy was somewhat larger than America’s: $16.2tn versus $14.7tn. By 2022, the US economy had grown to $25tn, whereas the EU and the UK together had only reached $19.8tn. America’s economy is now nearly one-third bigger. It is more than 50 per cent larger than the EU without the UK.” …Europe may never summon the will to reverse its inexorable decline in power, influence and wealth.

To address the final point in the above excerpt, we know the policies that would enable a European economic renaissance.

But don’t hold your breath waiting for that to happen.

There are some European nations with reasonably good overall economic policy, but only Switzerland has a good track record with regards to fiscal policy.

And all the recent evidence suggests that most European nations are increasing the fiscal burden of government (and overall economic policy also is becoming more dirigiste).

P.S. If you want to read the article Rachman cited from the European Council on Foreign Relations, click here.

P.P.S. Even better than Switzerland, European nations could copy Monaco.

Read Full Post »

There are three troubling things about the politics of poverty.

First, I frequently grouse and complain that some folks on the left don’t actually care about helping poor people. Instead, as explained in my Eighth Theorem of Government, they simply use poor people as props so they can expand the size and scope of the welfare state.

Second, I sometimes speculate that our friends on the left are more motivated by a disdain for the rich than they are by any desire to help the less fortunate (something that Margaret Thatcher observed many decades ago).

Third, some people knowingly (or perhaps in a few cases, unknowingly) lie by asserting that income inequality is the same thing as poverty – even if it means absurd conclusions such as there being more poverty in the United States than in Mexico.

For purposes of today’s column, we’re going to focus on this third group because lying about poverty may soon become official government policy.

In a column for the Wall Street Journal, the American Enterprise Institute’s Kevin Corinth warns that the Biden Administration is thinking about turning poverty hucksterism into official government policy.

A new report from the National Academy of Sciences seeks to redefine poverty. …the report’s real purpose could be to expand the welfare state. If the Census Bureau adopts the new poverty definition, millions more Americans could automatically be made eligible for benefits—leading to at least $124 billion in additional government spending over the next decade… It would also break with more than 50 years of precedent by establishing a relative standard. People could become better off and still be classified as “poor”; poverty would decline only if income at the bottom of the distribution increases more quickly than in the middle class. …Redrawing the official poverty line would be a nakedly political move without any scientific basis that could alter the scope of the safety net overnight.

I suspect readers won’t be surprised to learn that the report was put together by a very biased panel.

The 13 authors of the recent NAS paper appear to have been selected along partisan lines: 12 of them have contributed to Democratic causes or worked for Democratic administrations.

And I also suspect that nobody will be surprised to learn that a secondary effect will be to steer more redistribution to left-wing states.

As consequential is the potential reallocation of government assistance across states. The poverty line under the Supplemental Poverty Measure is higher in states like California and New York…and lower in states like West Virginia and Mississippi.

Adding $124 billion of additional cost to the welfare state would be bad news for taxpayers.

But the worst thing about this scheme is that it would enshrine dishonesty into Washington’s welfare state.

As I wrote a few years ago, it would be “insanely dishonest.” That’s because “everyone’s income could double and the supposed rate of poverty would stay the same.” Or that “a country could execute all the rich people and the alleged rate of poverty would decline.”

And now the Biden Administration is thinking about turning this type of dishonesty into official policy (which is hardly a surprise since the Obama Administration thought this awful idea was the right approach).

P.S. For anyone who actually wants to help poor people, we already know what works.

Read Full Post »

I have repeatedly pointed out that opponents of entitlement reform support big tax increases. And, as I explain in this segment from a recent presentation, they specifically support tax increases on lower-income and middle-class households.

Why do I assert that they support higher taxes on ordinary people? For the simple reason that there are not enough rich people to finance big government.

So this means, inevitably, that they support higher taxes on the rest of us (they probably support lots of debt-financed spending and central bank-financed spending as well).

Depending on where and how I make this argument, some people accuse me of being anti-Trump. Or anti-Biden.

Actually, I’m pro-math.

And there are some folks on the left who also understand this reality.

I’ve disagreed with many of her columns in the Washington Post, but Catherine Rampell deserves credit for honesty because her most-recent piece tells the truth about who will pay higher taxes as the burden of government increases. Here are some excerpts.

Democrats…wish to expand the social safety net, however, which requires — you guessed it! — more tax revenue. Democrats…claim…that all those safety-net expansions can be paid for solely by soaking “the rich.” …Alas, there’s not remotely enough money on those would-be money trees to pay for all the things that Democrats want. Or even the things that past Congresses have already committed to: Recall that the United States already has large fiscal deficits in the years ahead, even without creating new programs. …By all means, raise taxes on the ultrawealthy. …But if we really want a more robust welfare state, or even to sustain the welfare state we’ve already promised, that probably requires higher taxes from most of the rest of us, too.

At this point, I normally would state that Ms. Rampell deserves membership in my club of honest liberals. But she already is a member, thanks to a column she wrote two years ago.

I’ll close with the should-be-obvious point that any tax increases would be a bad idea, whether imposed on upper-income households or anybody else.

Which is why sensible people should resuscitate support for genuine entitlement reform.

Read Full Post »

The big fiscal fight in Washington is whether the United States should become a European-style welfare state.

In part, this is automatically happening because of demographic change and poorly designed entitlement programs. But there’s also a major effort by Joe Biden to accelerate America’s fiscal decline with massive expansions of redistribution and dependency programs.

There are two reasons why it would be a bad idea for the United States to become more like Europe.

  1. Since there are not nearly enough rich taxpayers to finance big government, it would mean massive tax increases on lower-income and middle-class households.
  2. It would sap economic vitality and depress growth, undermining the huge advantage Americans enjoy as measured by per-capita living standards.

Regarding the second point, here’s a chart that was part of a tweet from Stefan Schubert. It shows that the United States is widening it lead over the other nations of the G-7 (Canada, France, Germany, Italy, Japan, and the United Kingdom).

The above chart is from the Economist, and here are some excerpts from an accompanying article.

America remains the world’s richest, most productive and most innovative big economy. By an impressive number of measures, it is leaving its peers ever further in the dust. …America’s dominance of the rich world is startling. Today it accounts for 58% of the g7’s gdp, compared with 40% in 1990. Adjusted for purchasing power, only those in über-rich petrostates and financial hubs enjoy a higher income per person. Average incomes have grown much faster than in western Europe or Japan. Also adjusted for purchasing power, they exceed $50,000 in Mississippi, America’s poorest state—higher than in France. …Americans work more hours on average than Europeans and the Japanese. …they are significantly more productive than both. …Another lesson is the value of dynamism. Starting a business is easy in America, as is restructuring it through bankruptcy. The flexibility of the labour market helps employment adapt to shifting patterns of demand.

The most important sentence in that excerpt was the one about America’s poorest state (Mississippi) being richer than France.

That’s something to share the next time you’re talking with a leftist who thinks America should “catch up” with Europe.

P.S. I can’t resist sharing one more excerpt from the article. As you can see, the Economist does not approve of Biden-Trump protectionism.

…more likely their politicians are to mess up the next 30 years. Although America’s openness brought prosperity for its firms and its consumers, both Mr Trump and Mr Biden have turned to protectionism.

Excellent point. Hopefully the US eventually will have someone in the White House who understands that free trade makes the country more prosperous.

Read Full Post »

Leftists should be nice to rich people people because those entrepreneurs, investors, and business owners are the ones financing the federal government.

However, there are too few rich people to finance a European-sized welfare state.

The above video is a segment from a recent presentation to the Money Show, in which I explained that lower-income and middle-class taxpayers are going to get hit by massive future tax increases.

There are two inescapable reasons for this conclusion.

First, entitlement spending is exploding and, second, there are not enough rich people to pick up the tab. As such, you can’t finance a large welfare state without pillaging ordinary people.

You can’t do it if your name is Joe Biden.

You can’t do it if your name is Donald Trump.

But not everyone believes me

And that’s why I shared the charts in the video. The numbers clearly show that taxes on the rich will not suffice.

  • There are not enough rich people to finance the current level of government spending.
  • There are not enough rich people to finance future levels of government spending.
  • There are not enough rich people to finance the new spending Biden is proposing.

Perhaps the strongest evidence is that even Bernie Sanders recognizes this reality. He favors every possible class-warfare tax increase, but it’s very revealing that he also proposed a massive 11.5 percent payroll tax on the wages of everyone to finance his plan for “free” government-run healthcare.

By the way, let me add one very important point that I didn’t make in the video. I’m sure folks on the left will go for class-warfare tax increases before going after the rest of us.

And if they succeed in enacting those tax increases, we can be very confident of terrible economic consequences. It will be the reverse of Reagan’s very successful approach, which actually led to dramatic increases in tax payments from upper-income taxpayers.

Read Full Post »

I wrote last week about President Macron’s very modest effort to slow down the growth of the welfare state and started with a chart showing that France has the highest overall burden of government spending in the developed world.

The good news (relatively speaking) is that France is in third place, based on this chart from the OECD, when looking at the burden of government-provided retirement benefits.

To be sure, having the third-highest burden of retirement spending is hardly something to celebrate. And it is not exactly a big achievement to be slightly less worse than Greece and Italy.

This is why President Macron is pushing to increase the retirement age from 62 to 64.

But French voters and French lawmakers have an entitlement mentality and Macron’s initiative was faltering. So the government used executive authority to unilaterally impose the law.

Needless to say, this has triggered a lot of outrage. Here are some details from an article by Rich Noack in the Washington Post.

The French government used its executive powers Thursday to raise the retirement age to 64 and avoid a vote on an unpopular bill, outraging lawmakers who could retaliate with a no-confidence motion… Two-thirds of the French public have opposed the plans, and within minutes of Borne announcing the law’s adoption, demonstrators assembled near Parliament for their ninth day of mobilization, with some of them clashing with authorities. …Macron has been pushing for changes to the country’s pension system since he was elected in 2017… France has a lower minimum retirement age than many of its European neighbors… Germany, for instance, is preparing for an increase in the retirement age from 65 to 67, and lawmakers there have faced little public backlash. …Macron and his allies argue that the retirement age needs to reflect that increase if the country wants to preserve a welfare system that relies on a sufficiently large base of working-age contributors.

Here’s a chart from the article to show the excesses of the French system.

The Wall Street Journal opined this morning on the controversy.

The political difficulty of reforming pensions in Western democracies has been on display in France, with strikes and mass protests against Emmanuel Macron’s modest pension reform. …Give Mr. Macron credit for persistence—and political brass. …Thursday Prime Minister Elisabeth Borne invoked Article 49 of the French constitution, which enabled the Macron government to strong-arm a bill through the National Assembly without a vote. The National Assembly’s remaining recourse to block reform is to pass a motion of no confidence. That would block the legislation, oust Ms. Borne, and dissolve the government. …The opponents are on the populist left and right, including his presidential opponent in 2022, Marine Le Pen, who accused Mr. Macron of choosing “to govern with brutality” and called for Ms. Borne’s ouster. The cold reality is that France needs reform because its pay-as-you-go pension system is unsustainable. The retirement age is 62, one of the youngest in Europe, and Mr. Macron would stretch it only to 64 with some exceptions. The worker-to-retiree ratio has shrunk to 1.7 to 1 from 3 to 1 in 1970. French pensions already consume 14% of the economy.

The second-to-last sentence of the above excerpt deserves some emphasis.

Back in 1970, there were three workers (taxpayers) for every retiree. Now the ratio if 1.7 workers to every retiree, and that situation is going to get much worse over the next few decades (the same problem of demographic change exists in the United States).

So the real-world choice is reform or bankruptcy (especially since taxes already are maxed out).

P.S. Macron’s reform is better than the status quo, but it would be far better to shift to personal retirement accounts – which is something that has happened in dozens of nations.

Read Full Post »

Which European nation has the costliest welfare state?

Greece would be a good guess, but it’s only in second place.

At the top of the list, according to OECD data, is France, where government spending consumes nearly 60 percent of the nation’s economic output.

These numbers are very depressing, but they are going to get worse over time.

Like most nations in Europe, France is dealing with demographic decline. People are living longer, and also having fewer children.

And that means fewer people pulling the wagon and more people riding in the wagon.

The net result is that the burden of government spending is going to climb by another 12 percentage points of GDP over the next four decades.

Looking at the two charts, it’s obvious that France has a massive fiscal problem.

If it stays on its current course, a Greek-style fiscal collapse is inevitable.

Which explains why President Macron has proposed to take a small step in the right direction by raising the retirement age from 62 to 64.

But even this modest reform is an outrage to some French leftists. In a column for the Washington Post, Rokhaya Diallo denounces the proposed change as an assault on “the French welfare model.”

Like tens of thousands of others, I was proud to be on the Place de la République recently to defend the legacy of the French welfare state. …Across the country, millions have gathered in periodic protests to defend one of the crown jewels of the French welfare model: the pension system. President Emmanuel Macron is determined to reform the pension system and to increase the retirement age from 62 to 64 (he first intended to push it to 65). …According to Macron, the calculus is simple: The French system cannot sustain itself financially, and because life expectancy is increasing, people have to work longer. …Big companies, however, have far more resources at their disposal than individual citizens, and raising corporate taxes would be a fairer way of increasing government revenue. …The fact that we live longer does not mean that we should spend our lives working for companies. Why should we subordinate our lives to the needs of capitalism?

At the risk of being snarky, Ms. Diallo is complaining about the reality of math rather than “the needs of capitalism.”

Though, by proposing higher taxes on French companies, she sort of acknowledges that the status quo is untenable.

So is Ms. Diallo’s proposed policy of higher taxes on workers, consumers, and shareholders a feasible solution to France’s ever-growing fiscal burden? Could all the built-in new spending (12 percentage points of GDP) be financed by a higher corporate tax rate?

No. Not even close. The French corporate tax rate currently is 25.8 percent and it collects about 2.3 percent of GDP according to OECD data.

Given her economic naivete, Ms. Diallo might support a very radical approach, such as doubling the corporate rate to more than 50 percent. And she might think that change would boost receipts from 2.3 percent of GDP to 4.6 percent of GDP.

But she would be wrong. Wildly wrong. As shown by this map from the Tax Foundation, France already has the fourth-highest corporate tax rate in Europe. Any increase (especially a big increase) will simply cause more business activity to leave France and go to nations with less-onerous tax policy.

In other words, a higher rate would not lead to a big increase in revenue. Indeed, it might do so much damage to the business climate that the government would collect less revenue.

And don’t forget that an additional 2.3 percent of GDP in revenue (assuming it magically materialized) is still far less than the built-in spending increase of 12 percent of GDP. So her math is wrong in two ways.

The bottom line is that France has two choices.

  1. Stick with the status quo and eventually suffer a horrific fiscal crisis.
  2. Enact reforms to prevent an ever-growing spending burden.

Macron’s reforms are grossly inadequate, but at least he wants to take a small step in the right direction. Ms. Diallo wants to put her head in the sand.

P.S. In her column, Ms Diallo notes that lower-income workers don’t live as long.

…mortality numbers vary among social classes. Nurses live seven years less than other women: 20 percent of them and 30 percent of nursing assistants retire with disabilities. Blue-collar workers live six years less than executives, so that one-quarter of the poorest men die by age 62, while 94 percent of the rich are still alive at 64. Only 40 percent of the poorest survive to 80, whereas 75 percent of the wealthiest do.

I want to congratulate her. She accidentally has provided a very good argument for why folks on the left should support personal retirement accounts.

Read Full Post »

Today we are going to look at proposals to expand the burden of Social Security payroll taxes, and let’s start by recycling this 2008 video.

All of the analysis in the video is still accurate, but two of the numbers need to be updated.

  • Social Security’s long-run deficit is now $56 trillion rather than $24.9 trillion as was the case back in 2008.
  • Social Security payroll taxes now apply to income up to $162K rather than $102K as was the case back in 2008.

If you don’t have time to watch a 9-minute video, I can summarize the issue by noting that Social Security was designed as an “earned benefit,” which means workers contribute to the system in exchange for future benefits. The more you earn, the more you pay, and the more benefits you receive.

But because Social Security is supposed to be akin to an insurance program, there’s a limit on both the amount of benefits any retiree can receive and the amount of taxes that any worker must pay (the same principle applies in many other nations).

Some politicians want to get rid of the limit (the “wage base cap”) on the amount of taxes workers must pay. Instead of applying the 12.4 percent Social Security payroll tax on the first $162,000 of income, they want to impose the tax on all income.

In some cases, they want this big increase in marginal tax rates in order to prop up the Social Security system while in other cases they actually want to expand the program.

In either case, the economic consequences would be very bad.

In today’s Wall Street Journal, Travis Nix explains why this would be counterproductive.

…lawmakers in both parties are mulling the idea of lifting the payroll tax cap. The resulting increase in revenue would do little more than delay the inevitable by extending the program’s life a few more years. …European countries cap payroll taxes at much lower incomes than the U.S. does. Germany caps payroll taxes for health insurance at about $62,000 and the Netherlands caps theirs for social security at $40,370. Uncapping the payroll tax in the U.S. would only widen the disparity and make America a less attractive country in which to work and invest. …Uncapping the payroll tax would raise the top tax rate on Americans’ labor income—income and employee payroll tax combined—to as high as 43.2%. This excludes state taxes and the employer payroll tax, which make the rate even higher. The U.S. hasn’t seen labor tax rates that high since before Ronald Reagan. …European countries that cap their payroll taxes at relatively low incomes understand that you can’t fund a social-safety net without providing an incentive to work. The U.S. should too.

Let’s also look at what Mark Warshawsky of the American Enterprise Institute wrote last year.

…imposing a massive tax increase — 12.4 percentage points — on the earnings of about 10 million highly productive, mostly middle-class workers earning more than $160,200 would have several notable consequences. It would reduce their support for the program, severely discourage their labor market participation, and encourage payroll tax avoidance through converting earnings to incentive stock options and other forms of employee stock ownership. …In many instances, these workers would have their wages taxed at federal, state and local levels at rates exceeding 70 percent. …almost 20 percent of current and future covered workers are projected to earn above the taxable maximum in any one year.

And here is some of Allison Schrager’s analysis from 2020.

When it comes to financing the future of Social Security, many Democrats have a simple and wrong solution: lift the cap on earnings subject to the payroll tax. …there are costs to these plans. A 12.4% marginal tax increase is significant. If the cap is eliminated, an individual who makes $250,000 a year would see their Social Security tax liability increase by 88%. …many households—especially those in states with high state taxes—will be paying more than 60% in federal, state, and local income and payroll taxes… only 6% of the population earns more than the cap. But income varies over people’s lives: 36% of Americans will be in the top 5% of earners at least one year of their career.

I’ll close by observing that it we’ve had big fights under Bush, Obama, Trump, and Biden about whether the top personal income tax rate should go up by about 3 percentage points or down by 3 percentage points.

Since keeping marginal tax rates low helps encourage productive behavior, those were important fights.

Now we face a fight that should be far more important since some politicians want to raise the marginal tax rate by 12.4 percentage points.

It is true that Social Security is in deep financial trouble, but propping up (or expanding) the current system would be bad news for the economy and it would produce a bleaker future for young people.

It would be far better to begin a transition to personal retirement accounts.

P.S. Chile and Australia have created personal retirement accounts. You can also learn about reforms in SwitzerlandHong KongNetherlands, the Faroe IslandsDenmarkIsrael, and Sweden.

Read Full Post »

The worst piece of legislation in 2021 was Biden’s so-called stimulus, which added $1.9 trillion to America’s fiscal burden.

The worst provision of that legislation almost certainly was a temporary per-child entitlement of $3,000-$3,600.

Biden then wanted to make this entitlement permanent as part of his $5 trillion plan to “build back better.”

Fortunately, that boondoggle sank under its own weight and the slimmed-down (but still bad) version that ultimately was enacted earlier this year did not include any per-child handouts.

That’s the good news, at least relatively speaking.

The bad news is that Congress and the White House have renewed their push for a permanent per-child entitlement.

And, because Republicans will control the House of Representatives starting in January, they are trying to push the policy through next month.

The Wall Street Journal editorialized today about per-child handouts.

A core Democratic priority in Congress is resurrecting a $3,000 child tax credit for dependents ages six and up, with a $600 bonus for younger children. …The Internal Revenue Service is now another turnstile of the welfare state. That’s because over time Congress made more of the credit “refundable,” which means available to those who don’t owe federal income taxes. …a universal basic income for people with children. …The full Democratic allowance would cost $1.6 trillion over 10 years… Low-income voters are always assumed to support cash benefits, but 46% of those earning less than $50,000 opposed the payments. That may be because Americans understand that poverty in the U.S. is now less about material deprivation and more about idleness, addiction, mental illness and other destructive realities that can’t be cured with a bigger check.

There were many arguments against these per-child handouts (reversing Bill Clinton’s welfare reform, setting the stage for universal basic income, etc).

But those topics are not playing a big role in this debate.

Instead, the White House and Congress are engaged in a naked vote-buying scheme.

They want to create more dependency, regardless of the economic and societal consequences.

What are some of those consequences? Those are discussed in a column by Scott Hodge, which also is in today’s Wall Street Journal.

He starts with a mea culpa about his role in creating child credits and also warns about the risks of creating a system where the IRS is a dispenser of goodies rather than a tax-collection agency for almost half the population.

I was one of the inventors of the child tax credit, nearly 25 years ago—and I think it’s a bad idea. …Key elements of this plan made their way into the 1994 House Republicans’ Contract with America. Congress enacted the $500 child tax credit as part of the Taxpayer Relief Act of 1997, and it grew from there. …The Bush tax cuts in 2001 temporarily doubled the credit to $1,000… The 2017 Tax Cuts and Jobs Act doubled the credit again, to $2,000… Each expansion meant fewer households on the tax rolls. …The expanded credit…contributed significantly to increasing the number of households with little or no income-tax liability. …some 74 million tax filers—or nearly half (48.3%) of all filers in 2021—had no income tax liability. …Can we have a sustainable tax system if the number of nonpayers continues to grow?

Since I’m mostly worried about the economic consequences, here’s the part of Scott’s column that grabbed my attention.

…recent studies estimating the economic effects of the proposed expansion suggest that it would cause people to leave the workforce, reduce work effort, and lower capital investment, ultimately shrinking economic output. A recent study by economists at the University of Chicago determined that without any changes in behavior, expanding the credit would reduce child poverty by 34% and “deep” child poverty—families whose income is less than half the poverty level—by 39%. But those gains would come at a cost: the diminution of the workforce by 1.5 million people. …A new study by Congress’s Joint Committee on Taxation…determined…the policy would reduce the labor supply by 0.2% and reduce the amount of capital by 0.4%. As a result of the reduced supply of labor and capital investment, gross domestic product would shrink by 0.2%.

I’m guessing that some readers will be shrugging their shoulders because numbers such as 0.2 percent and 0.4 percent don’t sound very big.

But keep in mind that we have dozens of bad policies in Washington that have this type of effect, and their cumulative impact is very big.

And for those who like comparisons, it’s worth observing that living standards in Europe are significantly below American levels precisely because politicians in places such as Greece, France, and Italy have made even more of these mistakes.

The bottom line is that free enterprise is the best way of helping poor people, not government dependency.

Read Full Post »

When I write about Argentina, I normally have bad things to say.

Today, for only the second time, I’m going to say something positive about Argentina. At least in a back-handed way.

I’m currently in Buenos Aires for a conference. And because Argentinian monetary policy is even worse than U.S. monetary policy, the dollar is very strong and I’m able to enjoy great steak dinners for about $15.

Unfortunately, my gain is Argentina’s loss.

In a column for the Wall Street Journal, Dave Seminara discusses that nation’s long-run decline.

Argentina was one of the world’s seven richest countries at the turn of the last century thanks to its agricultural abundance. “People used to say someone is as rich as an Argentine.” …But bad governance has taken a heavy toll. More than a third of Argentines live in poverty and tens of thousands of small businesses closed during the pandemic. …nearly every young person…is plotting an escape to Europe or North America. …Argentina ranks 126th in the World Bank’s ease of doing business index and 96th on Transparency International’s corruption perception index, behind developing countries like Ethiopia, Tanzania and Kosovo. A bloated public sector weighs down Latin America’s third-largest economy. Roughly half the country either works for the government or depends on it for social welfare benefits. …The left’s mistakes in Argentina…profligate social spending, high taxes, and too many restrictions on commerce—are eerily similar to the priorities of the American left.

The most important passage in the above excerpts is that “Roughly half the country either works for the government or depends on it for social welfare benefits.”

How can you save a country when such a high percentage of the population has a direct incentive to vote for more government?

But it’s possible the outlook is even worse if you compared private sector workers to government bureaucrats.

Writing for National Review, Antonella Marty is very dismayed by Argentina’s trajectory.

Argentina’s annual inflation rate now exceeds 70 percent — a 30-year high. Its monthly inflation (just under 8 percent) is comparable to the U.S.’s annual inflation… Argentina is starting to resemble Venezuela — and no country wants to resemble Venezuela. How did things get this bad? The answer is actually quite simple: a big government that loves printing money. For decades, government intervention in Argentina’s economy has ballooned to such an extent that the state basically dictates the overwhelming majority of private-sector activity either directly or indirectly. The public sector’s meddling is notorious, crowding out the entrepreneurship, innovation, and job creation that keeps markets free and healthy. While Argentina’s population exceeds 45 million people, only about six million Argentines are employed in the private sector, while 55 percent of the country’s registered workers are employed by the government.

I don’t know which factoid is more depressing. Is it that “only about six million Argentines are employed in the private sector” or is it that “55 percent of the country’s registered workers are employed by the government”?

For what it’s worth, I assume “registered workers” does not include people in the underground economy. And because taxes and red tape are such a nightmare in Argentina, a lot of economic activity has been forced into the shadows.

But that does not change the fact that the country has a far-too-heavy burden of government. Politicians have turned a rich country into a basket case. And the situation seems to get worse every year, even when supposedly right-leaning governments occasionally get elected.

P.S. There’s an interesting debate whether Woodrow Wilson or Franklin Roosevelt was the worst president in U.S. history. In Argentina, there’s no ambiguity.

Read Full Post »

I have repeatedly opined that big government enables corruption.

And I have also asserted over and over again that big government is a racket for the benefit of insiders.

So you can understand why I get upset when the rich and powerful use the coercive power of government to line their pockets at the expense of ordinary taxpayers.

Now I have a new reason to be angry.

Reporting for the New York Times, Neil MacFarquhar describes a scandal involving Mississippi bigwigs feeding at the public trough.

John Davis, who served as executive director of the Mississippi Department of Human Services under former Gov. Phil Bryant, pleaded guilty to both federal and state charges of embezzling federal welfare funds. Millions of dollars were transferred to friends and relatives, court documents say. According to a lawsuit filed by the state in May, around $5 million was diverted to Ted DiBiase, a flamboyant retired wrestler once known as “The Million Dollar Man,” and two of his sons… Much of the money went to fictitious services, bogus jobs, first-class travel arrangements and even one son’s stay at a luxury rehab center in Malibu, Calif., that cost $160,000, the suit claims. Similarly, the state claims that Marcus Dupree, a former high school football phenom and professional running back, who was paid to act as a celebrity endorser and motivational speaker, did not perform any contractual services toward the $371,000 he received to purchase and live in a sprawling residence with a swimming pool and adjacent horse pastures in a gated community. Mr. Favre, who earned more than $140 million in his Hall of Fame career, was paid $1.1 million for speeches he never gave, the suit said. He also orchestrated more than $2 million in government funds being channeled to a biotechnology start-up in which he had invested, according to the suit. …The case follows a state audit released in May 2020 suggesting that as much as $94 million of TANF funds might have gone astray.

Sounds like a typical story about big government and corruption, right?

That’s certainly true, but some of our friends on the left argue that it is also evidence that Bill Clinton’s welfare reform backfired.

Experts said the fraud was rooted in changes enacted in such programs in 1996, when cash benefits paid to poor families were replaced by block grants issued to states.

Since I have defended Clinton’s welfare reform (along with some of his other good policies), the above excerpt caught my attention.

So I looked for more information.

In a piece for the American Enterprise Institute, Angela Rachidi explains the underlying issues.

A scandal involving former NFL quarterback Brett Favre and the federal welfare program Temporary Assistance for Needy Families (TANF) exploded…following new revelations that Mississippi officials, including the former governor, misdirected federal TANF money to enrich themselves, their celebrity friends, and other well-connected individuals. …the scandal draws attention to the TANF program. Critics have partly blamed the welfare reform law from 1996, which created TANF, for allowing such fraud. …Instead of an entitlement where government officials distribute money to all eligible people, TANF is a block grant provided… As awful as this scandal is, the fraud and abuse on display in Mississippi is not unique to TANF and not caused by its block grant structure. The Government Accountability Office (GAO) estimated that from 2015–2017 the annual average amount of Supplemental Nutrition Assistance Program (SNAP) benefits (or food stamps) “trafficked,” meaning retailers taking a fraudulent profit, was $1.2 billion. The GAO also found that improper payments in Medicaid, including payments for services not provided, totaled $36.7 billion in 2017. Earlier this month, the Department of Justice charged a nonprofit organization in Minnesota with a $250 million scheme that took federal pandemic-relief money earmarked for a child nutrition program and instead pocketed the funds.

In other words, corruption is an inherent part of government programs, whether the money is distributed as block grants or sent directly to recipients.

But not all government spending is created equal. Some ways of spending money do more damage than other ways of spending money.

Ms. Rachidi points out that welfare reform produced good results.  I don’t know if it saved money for taxpayers, but it led to progress as measured by variables such as labor force participation and child poverty.

None of this excuses what happened in Mississippi, but the context is important. Welfare reform, which created TANF, transformed a broken entitlement program—Aid to Families with Dependent Children—into a more effective system that gives states flexibility to address the underlying causes of poverty, including limited employment and unmarried parenthood. These reforms have significantly reduced dependence on cash welfare and increased employment among single mothers, which helped dramatically lower child poverty over the past two decades.

The obvious takeaway, as I pointed out back in 2015, is that we should we should be expanding on Bill Clinton’s success by replacing other federal entitlements with block grants.

The federal government maintains a Byzantine maze of redistribution programs, so there are lots of opportunities for progress. Medicaid is an obvious example, along with food stamps. Especially since both programs are riddled with fraud.

P.S. Unsurprisingly, Joe Biden wants to move in the wrong direction.

P.P.S. In my libertarian fantasy world, the federal government would have neither entitlements nor block grants. That also happens to the world envisioned by America’s Founders (and the reality Americans enjoyed up until the 1930s).

Read Full Post »

I often cite the OECD’s data on “actual individual consumption” to show that the average American enjoys higher living standards than the average European.

In this clip from a recent presentation, I compare the United States and France.

I’m motivated to write on this topic because of a recent tweet from Arnaud Bertrand.

I don’t know who he is, but he shares some very depressing data about the well-being of ordinary people in France.

The above data, according to Monsieur Bertrand, is before taxes on income.

Which makes me curious, of course, so I went to the OECD’s data on “Taxing Wages.”

Here is the data from Table 3.1, showing the tax burden on lower-income and middle-class taxpayers in France and the United States.

As you can see, the tax burden is much higher in France for every type of household. It doesn’t matter whether the household is single or married, the level of income, or the amount of children.

Indeed, the tax burden in France in every case is above the OECD average and the tax burden in the US is below average.

And don’t forget that average Americans also have much higher incomes than their French counterparts.

The bottom line is that Americans earn more and keep more. Something the keep in mind the next time one of our leftist friends agitates to make America more like Europe.

P.S. From the perspective of French taxpayers, the only good news is that nobody seems to be treated as poorly as the Spanish government treats Senor Alvarez.

Read Full Post »

In this clip from an interview with Chile’s Axel Kaiser, I discuss “Wagner’s Law” and the lessons to be learned from fiscal policy in Western Europe.

If you don’t want to watch the video, my discussion can be summarized in three sentences.

  • Yes, welfare states in Western Europe are comparatively rich by world standards.
  • But those  countries became rich when they had relatively small governments.
  • Adopting high taxes and big welfare states has since stunted their economic growth.

And here’s a fourth sentence that I should have mentioned.

  • They compensate for bad fiscal policy by having laissez-faire policies in other areas.

I expect that some people won’t accept my argument without some supporting evidence, so I’m going to share some charts.

We’ll start with this chart from Our World in Data. As you can see, nations in Western Europe has almost no welfare states prior to World War II. And it wasn’t until the 1960s and 1970s that big welfare states began to exist.

In other words, all the economic growth and industrial development that occurred in the 1800s and early 1900s took place when the fiscal burden of government was very small.

And if you want to see more charts to confirm this data, click here, here, and here.

Next we have a chart showing how the burden of government spending in the United States and Western Europe used to be similar, but then began to diverge after value-added taxes were adopted in the late 1960s and early 1970s.

Last but not least, let’s consider whether the expansion of the welfare state in Western Europe had negative economic consequences.

The answer is yes. This chart, prepared by Prof. Leszek Balcerowicz (former head of Poland’s central bank) shows that Western Europe was rapidly converging with the United States, but then began to lose ground after big welfare states were imposed (and also after improvements in American economic policy under Presidents Reagan and Clinton).

And if you want to see more charts to confirm this data, click here, here, here, and here.

P.S. Since I added a fourth sentence above, explaining that many European nation have good policies in other areas to compensate for bad fiscal policy, here’s a chart I prepared in 2018 showing how many European nations score very highly for economic freedom once fiscal policy is removed from the equation.

To see overall rankings of economic liberty, you can peruse the data from Economic Freedom of the World and the Index of Economic Freedom.

The bottom line is that Western European nations (with notable exceptions such as Italy, France, and Greece) get good scores, but would be far stronger if they had better fiscal policy.

And that’s the lesson that developing nations should learn.

P.P.S. As part of the interview, Axel and I also talked about California’s grim economic outlook.

Read Full Post »

What’s the most depressing chart in the world?

If you believe in limited government and you’re looking back in time, this example or this example are good candidates.

But if we’re looking into the future, this chart from a new study by the European Central Bank is very sobering.

And it’s a depressing chart because it doesn’t matter whether you believe in big government or small government. That’s because this chart shows a dramatic shift in population demographics.

Simply stated, Europe’s welfare states are in deep trouble because over time there will be fewer and fewer workers to pay taxes and more and more old people expecting benefits.

Here’s what the ECB experts, Katalin Bodnár and Carolin Nerlich, wrote about their findings.

The euro area, like many other advanced economies, has entered an era of drastic demographic change. …Declining birth rates and rising life expectancy are causing the number of pensioners to increase relative to workers. In the next one and a half decades, this trend will be amplified as the sizeable baby boom generation enters retirement and the cohort of workers shrinks. …The old-age dependency ratio is projected to reach almost 54% by 2070… If left unaddressed, population ageing will pose a burden on public finances in the euro area, given the relatively strong role of publicly financed pension and health care systems. Debt sustainability challenges might arise from mounting ageing-related public spending, which will be particularly a concern in high debt countries.

That last sentence in the above excerpt should win a prize for understatement of the year.

Many of Europe’s welfare states already are on the verge of crisis. And as demographics change over time (findings replicated in the European Commission’s Ageing Report), they will go from bad to worse.

Here’s a breakdown of how the “age dependency ratio” will change in various nations.

By the way, if you look at the right side of Chart 4, you’ll see Japan’s horrible numbers as well as a worrisome trend for the United States.

Most people focus on how demographic change will lead to more debt.

I think it’s more important to focus on the underlying problem of government spending.

This next chart combines both. The vertical axis shows the increase in age-related government spending while the horizontal axis shows debt levels.

The bottom line is that countries in the top-right quadrant are in deep trouble. Especially in the long run (though Italy could go belly-up very soon).

The ECB report does suggest ways to address this looming crisis.

To safeguard against the adverse economic and fiscal consequences of population ageing, there is a need to build-up fiscal buffers during good economic times, to improve the quality of public finance and to implement growth-enhancing structural reforms. …Further pension reforms are needed that encourage workers to postpone their retirement.

Don’t hold your breath waiting for any of these things to happen. Building up “fiscal buffers” means running surpluses today to offset deficits tomorrow. But European nations are running big deficits because of excessive spending today, so there will be no maneuvering room in the future.

P.S. Here’s some comedy (and more comedy) about Europe’s fiscal mess.

P.P.S. It is possible to reduce large debt burdens, so long as governments simply restrain spending.

Read Full Post »

Older Posts »