When debating big issues such as the size and scope of government, I like to think that facts matter. Maybe I’m being naive, but people should look at evidence before deciding whether to make government bigger or smaller.
And with Biden proposing a big expansion in the size of the welfare state, this is why I regularly compare the economic performance of the United States and various European nations.
After all, if we’re going to make America more like Europe, shouldn’t we try to understand what that might mean for the well being of the citizenry?
With this in mind, I want to share this tweet (based on this data) from Stefan Schubert at the London School of Economics.
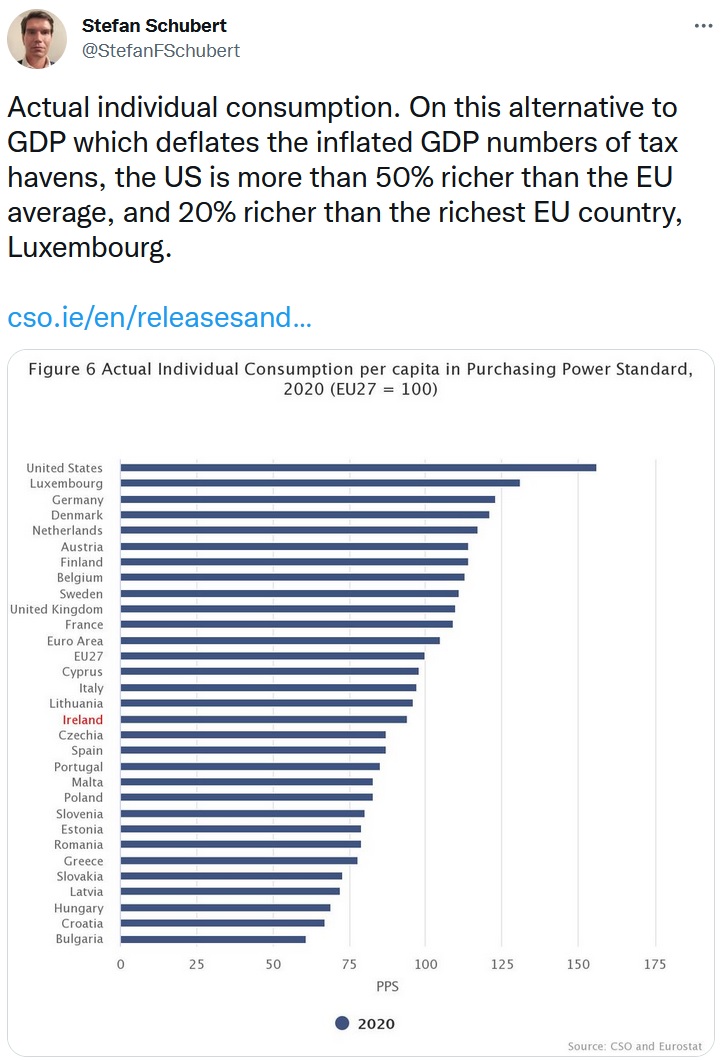
The obvious takeaway is that the average person in the United States enjoys much higher living standards (more than 50 percent higher) than the average person in the European Union.
Even more astounding, the United States even has a big 20-percent advantage of the wealthy tax haven of Luxembourg.
By the way, the above data may understate the gap if you make apples-to-apples comparisons.
 Nima Sanandaji compared the economic output of Scandinavians who emigrated to the United States with Scandinavians who stayed home.
He found even bigger gaps, one example of which is the data about Swedes in this chart.
Let’s look at one more bit of data.
Another way of illustrating the gap is see how European nations no longer are converging with the United States (and may actually be diverging).
The only good news for Europeans (if we’re grading on a curve) is that there’s been a decline in both the relative and absolute levels of economic freedom in the United States during the 21st century.
If that continues, the U.S. may “catch up” to Europe at some point in the future. Joe Biden certainly is working for that outcome.

[…] To show that living standards are much higher in the United States than they are in Europe, I periodically share OECD data on average individual consumption (2012, 2014, 2017, 2019, and 2022). […]
[…] But another problem is that some of the questions also were steroid-fueled examples of grading on a curve. For instance, based on Question #1, we’re supposed to be impressed that the United States has grown faster than Europe’s decrepit welfare states. […]
[…] The USA is out-performing Europe […]
[…] That is stunning evidence that big welfare states lead to economic stagnation. […]
[…] the risk of being repetitive, I’ve been arguing (and arguing, and arguing) that the United States should not turn its medium-sized welfare state […]
[…] response is usually to ask why the United States should copy Europe when there is a wealth of evidence that living standards are substantially lower on that side of the Atlantic […]
[…] response is usually to ask why the United States should copy Europe when there is a wealth of evidence that living standards are substantially lower on that side of the Atlantic […]
[…] Most informative […]
[…] Most informative […]
[…] Most informative […]
[…] Does Appelbaum think we’ll have “productive lives” if our living standards drop by 50 percent? […]
[…] Most informative […]
[…] Most informative […]
[…] by observing that the economic data is unfavorable when compared to the United States. Not only are living standards lower in EU nations, but those countries also are continually falling further […]
[…] by observing that the economic data is unfavorable when compared to the United States. Not only are living standards lower in EU nations, but those countries also are continually falling further […]
[…] just yesterday about Europe lagging behind the United States, and that’s in addition to many similar columns over the past […]
I agree. I, too, would pick C if that had been an option in the thought experiment. But the experiment was designed as simply as possibly to designate between sufficiency and equality.
As for your last point, that contribution of the wealthy is already baked into the average. The median, on the other hand, would tell us where the typical person (who is not necessarily the average person) lives. I obviously haven’t done the math, but it’s entirely possible that while the average person in the U.S. is 15 or 20 or whatever percent ahead of the average Swede (to pick on them again), the Swede who lives at his country’s median is ahead of the American who lives at his country’s median.
To turn to another thought experiment, would most people consider country A or country B to be more prosperous if both contain five people and in country A incomes are 20K, 30K, 70K, 80K, and 300K and in country B incomes are 40K, 70K, 80K, 100K and 120K. The average for country A is 100K with a median of 70K. The average for country B is 82K (18K less than country A), but with a median of 80K (10K higher than country A)?
Obviously, you could pick different numbers and get different results, but the bottom line question must always be, which set of numbers better mirrors the two societies, the U.S. and Sweden.
Would you rather live in your Society B where almost everyone earns $70,000 but a few people are billionaires, or Society C where literally everyone earns $70,000? I’d rather live in B. Because I don’t believe rich people are a problem, at least not in a generally free market economy like the US. Those billionaires probably got rich by providing society with better products and services. They also provide jobs. They’re also likely to invest their current wealth in a way that generates additional future betterments, whether in their own companies or others that need funding. All this is why average (or mean) is a better indicator of OVERALL prosperity than median. Because it includes the impact of rich people who actually do benefit the rest of society.
I’m not really hung up on the issue of inequality. There is a wonderful (and very short) book on that topic by the Princeton philosopher Harry Frankfurt. It’s called, On Inequality. He makes the insightful argument that what matters morally is sufficiency, not equality. Take two countries, A and B. In A absolutely everyone makes $30,000 a year and struggles to get by (i.e. equality but not sufficiency). In country B, nearly everyone makes about $70,000 a year and lives well. A few fall short, but are well provided for by a social safety net (which I think we have to a large degree in this country, although I’m sure it could use improvement). But here’s the kicker. In country B there are a number of multi-billionaires. So we have quite a bit of inequality but a great degree of sufficiency. In which country would you rather live (I realize I’m preaching to the choir, here, but I thought Frankfurt’s insight was worth sharing if you weren’t already aware of it). I suspect the overwhelming number of people, outside maybe Peter Singer, would choose B. In other words, sufficiency trumps inequality.
I do wonder about your comment that average is a better indicator of overall prosperity. In a country like the U.S., where so much wealth is concentrated in the upper 10 percent (I realize I’m starting to beat a dead horse, but I’m really looking for an argument that shows me where I’m wrong), vis-a-vis our European friends, I would think that mean would be the better indicator. I’d like to see Dan address this in a column.
Sorry to be so long-winded, but I thought the Frankfurt insight was worth sharing. Even if you were already aware of it, I’m sure there might be some reading this who aren’t.
phkershner,
It depends on what you’re looking for. You seem very keen on measuring inequality, and for that median is indeed ‘better.’ However, there’s nothing wrong or unreasonable about using an average. Average is a better indication of overall prosperity.
Thank you, John. So, I gather that Americans have more spending power even after things like health care, day care, education, etc,, are accounted for (whether paid for through taxes or privately). That is very helpful. I guess my only remaining question (and I don’t expect you to answer it, although I would certainly welcome that) is whether it would be more reasonable to use median figures rather than average figures since American wealth is skewed much more toward the top 10 percent than is true in most of the developed world.
Actual Individual Consumption does consider taxes. First, taxes obviously reduce the consumption of individuals, and that’s reflected in AIC. However, some tax money received by government ends up being spent on individual consumption (according to govt priorities, not necessarily yours), and AIC also includes that spending.
“My question is: Why is Ireland in red?”
“cso.ie”: it’s an Irish chart, from their Central Statistics Office.
Reblogged this on Utopia, you are standing in it!.
This is actually a reply to oiltranslator, not to John. But I couldn’t find any way to make that happen.
You raise a valid point about taxation, and while I didn’t mention it specifically, I do think it was implied by my comments about Sweden. Everyone knows that the social safety net requires large tax revenue. And I have read that Sweden’s social safety net (as well as those found in other OECD nations) is starting to fray. So, again, you raise a valid point. I only wish Dan would be open about all this (including why he is using average rather than mean which skews the data in favor of the U.S).
With regard to Ireland, I have no clue.
So there are no taxes in Sweden?
The startling effect of forfeiture as prohibition enforcement was a 5% drop in consumption as the economy crumbled. My question is: Why is Ireland in red?
Hey,,, John, I appreciate that. It’s always so nice to find civil conversation on the internet. I do wish that sometime Dan might address the question we are tossing around in a full length article. And maybe include the question of whether we should be using average or median. Thanks again for your insight. It is helpful. Maybe Dan will see our posts and be inclined to address the issues we’ve raised. 🙂
A couple people in recent months have complained that the Actual Individual Consumption data that Dan likes to quote is incomplete, and really Europeans are much better off than AIC shows because of public expenditures. Well, of course there’s no such thing as a perfect metric to compare economic well-being across multiple countries. But AIC DOES try to capture the health and education spending of both governments and non-profits, so it is a better measure of OVERALL economic well-being than you think.
You have shown this data more than once, but to compare apples to apples (as you say) don’t we have to consider what Europeans don’t have to pay for that we have to pay for? I may have 15 or 20 percent more purchasing power than someone in Sweden, let us say, but I have to use that purchasing power to pay for day care and health care and education, among other things, for which my Swedish friend doesn’t have to pay. Doesn’t this have to be taken into account? Furthermore, don’t you also have to take into account the fact that we have much greater wealth inequality here than they have in Europe? You move casually from a chart showing consumption per capita to saying, “The obvious takeaway is that the average person in the United States enjoys much higher living standards (more than 50 percent higher) than the average person in the European Union.” But since the average in the U.S. is so skewed by the wealth of the top 10 percent, perhaps you should be using median rather than average,