Feeds:
Posts
Comments

Posts Tagged ‘Debt’

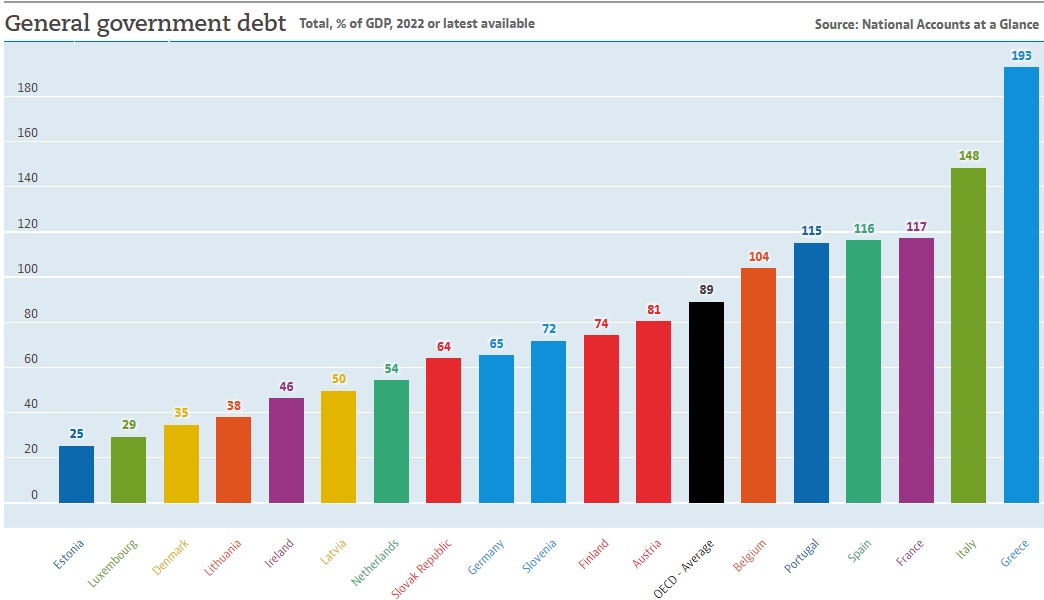
I wrote a two-part series (here and here) in 2022 predicting that Italy was at risk of suffering a fiscal crisis.

If and when it occurs, it will be because investors decide that Italy’s government might default (i.e., be unable to make payments on its debt). Interest rates would spike, financial markets would get shaky, banks would be a risk, and there would be a lot of pressure for a Greek-style bailout.

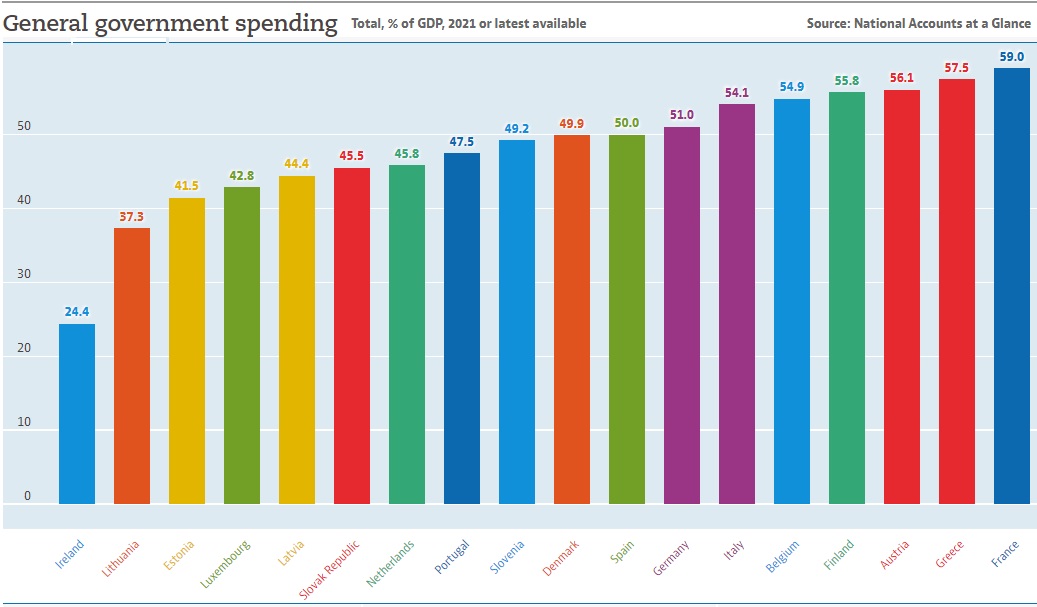
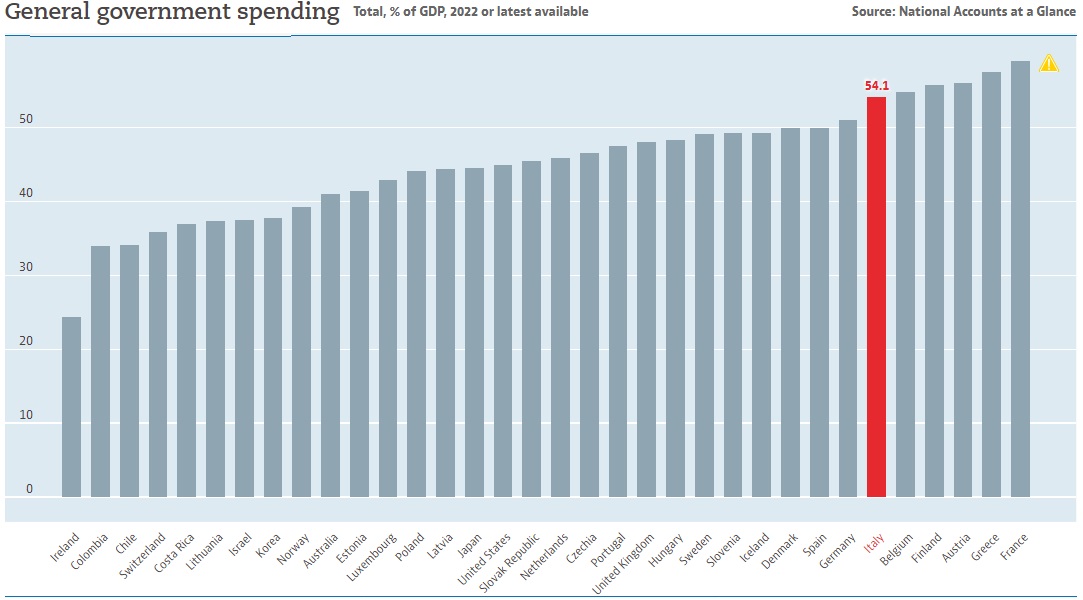
Should that happen, my role will be to point out that the real problem is that the burden of government spending in Italy is excessive (same message I delivered a dozen years ago).

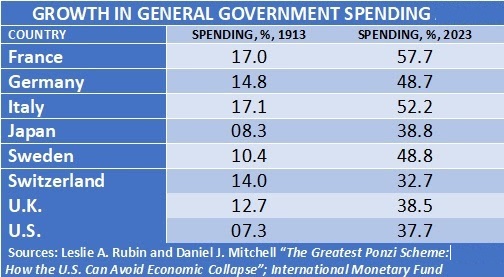
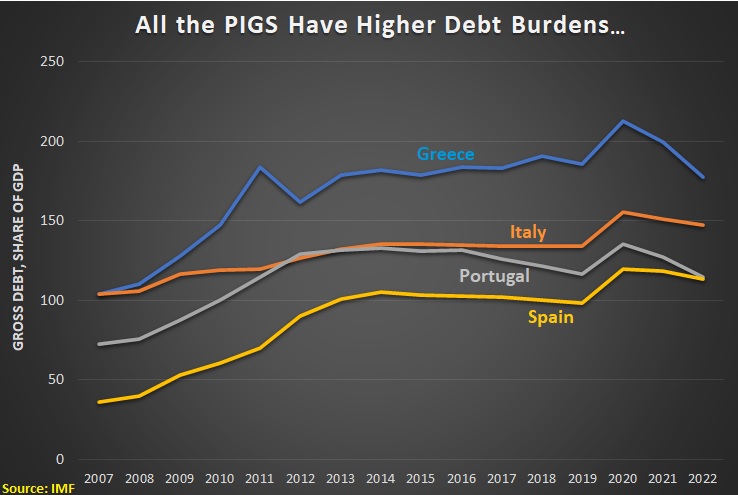
As shown by OECD data, it’s one of the most profligate nations in Europe.

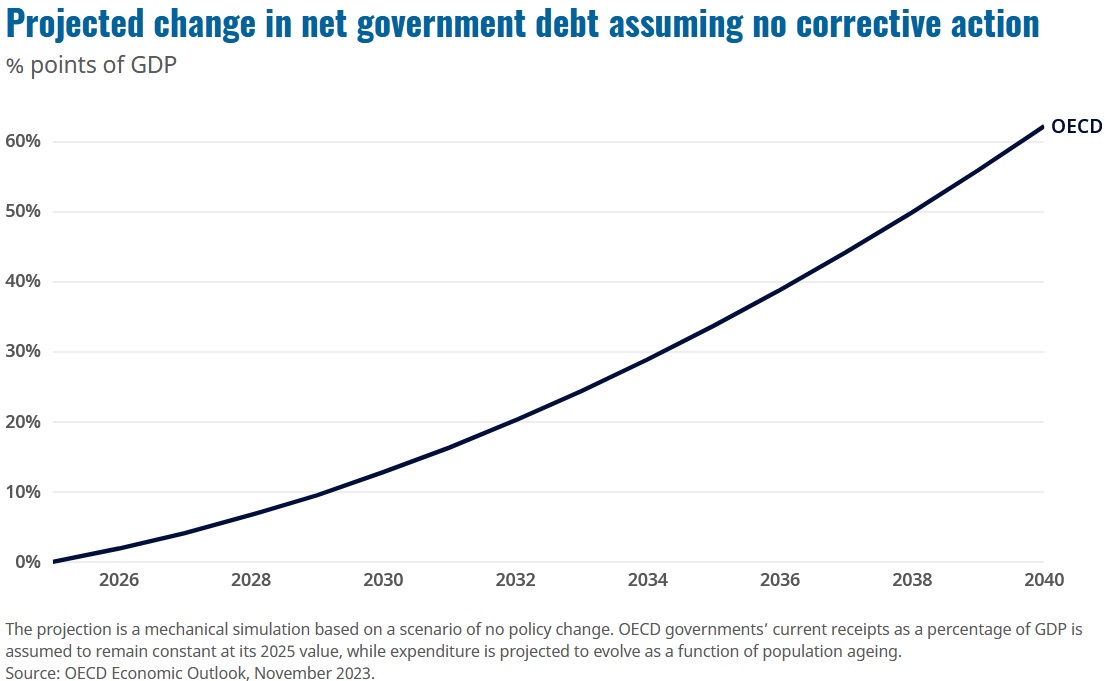
And I suppose it’s worth mentioning that Italy’s demographic outlook is very grim, thus increasing medium- and long-run fiscal risks.

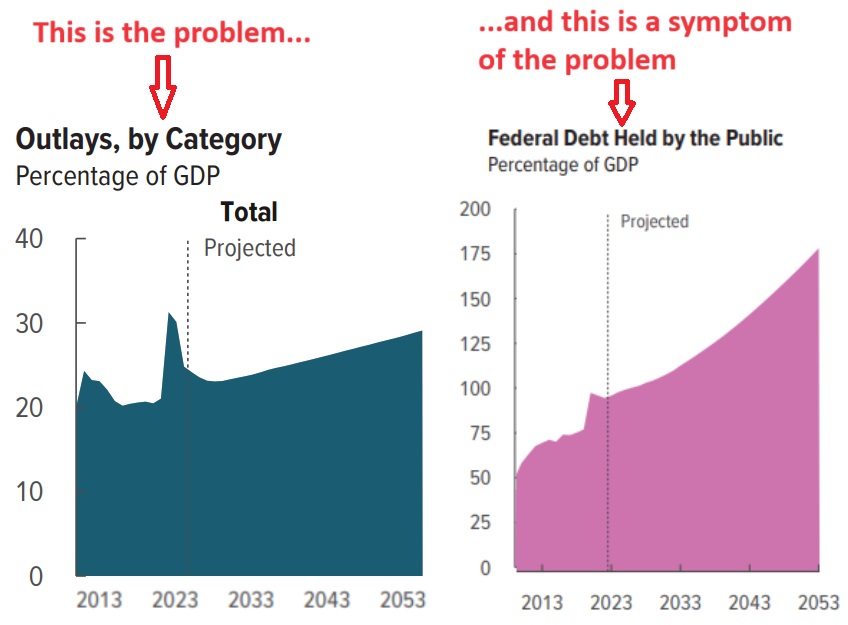
That’s the macro outlook.

Now let’s look at a specific example of why Italy is a fiscal mess. The Economist recently reported on a government giveaway that has become a nightmare.

…a home-improvements subsidy…has turned into the fiscal equivalent of King Kong: a monster running amok, wreaking havoc… Mr Giorgetti revealed that claims of the subsidy, known as the “superbonus”, made in the four years that the scheme has been running, together with claims of another that offsets the cost of renovating façades, would eventually drain the treasury of €219bn ($233bn). That is almost 10% of Italy’s GDP last year. …a left-populist coalition…introduced the superbonus in 2020… The idea was to stimulate the stricken economy… The government offered to pay homeowners 110% of the price of energy-saving renovations. …The cash was not to be reimbursed directly, but in the form of tax credits that could be sold on. …the superbonus has proved wildly popular. That should not have been a surprise: what is not to like about being repaid more than you have spent? Or not spent: since the tax credits are tradeable, many homeowners simply passed them on to their builders without having to part with a euro. A second reason is outright fraud. Last August Giorgia Meloni, Italy’s prime minister, said that contracts falsified to claim the subsidies constituted the biggest-ever rip-off of the Italian state. That was when they amounted to a mere €12bn; since then, the figure has risen to €16bn. A third problem is overpricing. Because the superbonus refund is greater than the outlay, actual or theoretical, it is in the interests of both the builder and the homeowner to inflate the cost of the work.

At the risk of understatement, this is one of the dumbest spending programs I’ve ever read about.

To put this in an American context, it’s sort of like adding together the fraud of the Trump-Biden pandemic spending, the perverse incentives created by Fannie Mae and Freddie Mac, and the third-party payer problem caused by government in the health sector.

Read Full Post »

Last year, I filled out a do-it-yourself federal budget prepared by the Washington Post and another one put together by the Committee for a Responsible Federal Budget.

In both cases, my main complaint was that they did not give enough options to shut down counterproductive departments and/or offer enough proposals for much-needed entitlement reform.

Today, I’m going to write about a do-it-yourself budget from the American Enterprise Institute. But I’m not going to bother to share my results because I think the model has a fatal flaw.

To illustrate, here is the model’s baseline estimate for national well-being (in this case, “welfare” refers to the overall prosperity of the nation rather than redistribution spending). As you can see, the model assumes that national well-being eventually begins to shrink if we leave government policy on autopilot.

Because the burden of government spending is projected to dramatically increase in coming decades, I don’t have any problem with the assumption that living standards will begin to decline.

After all, if America becomes a European-style welfare state, it’s perfectly reasonable to expect European-style economic malaise.

But here’s where things go awry. To show how the model is messed up, I made these two choices.

  • The biggest-possible increase in income taxes.
  • The biggest-possible increase in payroll taxes.

I then clicked “run model” and here are the results. In every single year, it shows that national well-being improves with these two big tax increases.

Before explaining how and why this is wrong, here is an explanation of the model’s methodology.

In our October 2023 working paper, we…explain, justify, and show the results of our macroeconomic projection model of the U.S. economy and federal budget. …As a companion to our working paper, we have developed a dashboard which allows users to adjust assumptions and implement their own policies to reduce future levels of debt and improve welfare for generations to come. By adjusting the sliders on the left-hand side of the screen, users can, e.g., increase income taxes, increase levels of investment, reduce Social Security benefits, and change projected health care elasticities. …Users can adjust various assumptions or implement policy changes using the sliders on the left, then click “Run Model” to produce new projections using this new set of assumptions. For example, to reduce deficits, one could increase income and Social Security payroll tax rates by one percentage point each, cut non-health federal spending by ten percent, and increase the average Social Security replacement rate by five percentage points. New projections after making these changes are shown… The solid circles continue to show baseline assumptions while the empty circles represent outcomes under the new set of assumptions.

So why does the modal produce screwy results?

Here’s what you need to know.

…welfare improves as, in our model (based on assumptions made by CBO), deficits crowd out investment, reduce capital, and slow economic growth, so efforts to reduce the deficit will generally improve welfare.

There is nothing wrong with that bit of analysis, but it’s fatally incomplete.

It fails to account for how tax increases would negatively impact national well-being. And it also fails to account for how a rising burden of government spending will adversely impact national well-being.

To put it in simple terms, projecting the economy based solely on what happens to deficits and debt is like predicting the outcome of a baseball game by looking at what happened in the 2nd inning. That’s part of the answer, but grossly inadequate.

Which is an analogy I should have used in this video from 2009, which explains that spending is the problem, not red ink.

If you don’t want to spend a few minutes with the video, this short column tells you why fixating solely on deficits leads to absurd results. And this column is a must-read for people who think tax-financed spending somehow is less harmful than debt-financed spending.

P.S. I write about “Fiscal Fights with Friends” when I think someone is well meaning but is pushing bad policy or bad analysis. Previous editions have focused on Medicaid reform, tax increasesparental leave, the value-added taxfiscal policy, the flat tax, and the carbon tax (twice),

Read Full Post »

The Congressional Budget Office has released its new Long-Term Budget Outlook and I will continue my annual tradition (see 20182019202020212022, 2023) of sharing some very bad news about America’s fiscal future.

Most budget wonks focus on what CBO says about deficits and debt. And those numbers are grim.

But it’s much more important to focus on the underlying problem of excessive spending. After all, red ink is merely one of the symptoms of a government that is too big.

So here’s CBO’s forecast of spending and revenue over the next three decades. As you can see, both taxes and spending are becoming bigger burdens.

The bad news is that the tax burden is rising over time

The worse news is that the spending burden also is rising over time. And the worst news is that the spending burden is rising even faster than the tax burden in rising.

Here’s what CBO wrote in the report.

In the Congressional Budget Office’s projections, deficits…grow larger over the next 30 years because…spending…increases faster than revenues over the subsequent 30 years. Both federal spending and federal revenues equal a larger percentage of the nation’s gross domestic product (GDP) in coming years than they did, on average, over the past 50 years. Under current law, total federal outlays would equal 23.1 percent of GDP in 2024, remain near that level through 2028, and then increase each year as a share of the economy, reaching 27.3 percent in 2054… From 1974 to 2023, outlays averaged 21 percent of GDP; over the 2024–2054 period, projected outlays average about 25 percent of GDP… The key drivers of that increase over the next 30 years are higher net interest costs, which result from rising interest rates and growing federal debt, and growth in spending on major health care programs, particularly Medicare, which is caused by the rising cost of health care and the aging of the population.

To elaborate on that final sentence, our next visual is CBO’s forecast for both health entitlements and Social Security.

You can see that Social Security is becoming a bigger burden, but programs such as Medicare and Medicaid are easily the nation’s main budget problem.

By the way, this chart is why there is an inevitable and unavoidable choice to make.

We either have entitlement reform or we have massive tax increases. Sadly, the two main presidential candidates in 2024 prefer the wrong option.

P.S. Here’s one final excerpt from the report. CBO acknowledges that higher tax burdens will be bad for growth.

The agency’s economic projections…incorporate the effects of changes in federal tax policies scheduled under current law, including the expiration of certain provisions of the 2017 tax act. Under current law, tax rates on individuals’ income are scheduled to increase at the end of 2025, when those provisions are scheduled to expire. Those changes aside, as income rises faster than inflation, more income is pushed into higher tax brackets over time. That real bracket creep results in higher effective marginal tax rates on labor income and capital. Higher marginal tax rates on labor income reduce people’s after-tax wages and weaken their incentive to work. Likewise, an increase in the marginal tax rate on capital income lowers people’s incentives to save and invest, thereby reducing the stock of capital and, in turn, labor productivity. In CBO’s projections, that reduction in labor productivity puts downward pressure on wages. All told, less private investment and a smaller labor supply decrease economic output and income in CBO’s extended baseline projections.

This may seem obvious, especially for people familiar with the academic research on this topic, but CBO used to have some very silly views on tax policy.

P.P.S. CBO also used to produce some very silly analysis on spending policy, but in recent years has been much better.

Read Full Post »

My book on fiscal policy, co-authored with Les Rubin, is now officially published.

I wrote a sneak-peak column about The Greatest Ponzi Scheme on Earth last week.

There are three main takeaways from our book.

Okay, I’ll admit those bullet points are an oversimplification.

But there’s a reason for that.

Our book does show how we got into our current fiscal mess (because of too much spending).

And it shows why things will get worse in the future if we leave government on autopilot (because of too much spending).

Moreover, we have lots of evidence for the right way to avert a fiscal disaster. Richard Rahn wrote about our book in his Washington Times column.

In a new book, “The Greatest Ponzi Scheme: How the U.S. Can Avoid Economic Collapse,” Leslie A. Rubin and Daniel J. Mitchell provide a well-written and informative history of how much of the world and particularly the United States managed to get into the current fiscal mess. …British Prime Minister Margaret Thatcher said it best: “The problem with socialism is that you eventually run out of other people’s money.” Before World War I, government spending in almost every country was a small share of gross domestic product. …In the United States, things began to change in the 1930s with the development of welfare programs… Mr. Rubin and Mr. Mitchell review many of the so-called entitlement programs that are the real budget busters. The payments from these programs consistently grow faster than the economy or tax revenue and now consume the bulk of the federal budget. Anyone who can do basic math can quickly understand the problem. When a country reaches the point where it is borrowing just to pay interest on the debt, game over.

That’s the bad news in the book. And Richard captures some of that bad news with this table showing how the burden of government spending has significantly increased over the past 100-plus years.

But our book also has good news, as Richard explains.

Fortunately, there are a number of success stories that serve as role models of what to do. …Switzerland is perhaps the best model for fiscal responsibility in a highly developed country, in that for the most part the Swiss keep government spending growing no more rapidly than the private sector.

As you might expect, I like his conclusion.

Mr. Rubin and Mr. Mitchell have done a great service in providing a highly understandable book, outlining the disaster about to engulf us if we do not change quickly, but equally important, a road map for getting out. Every policymaker and concerned citizen ought to buy this book and refer to it often — an economic bible of sin and salvation.

I want you to buy the book, but if you are a regular reader of this column, you already know the only practical way of averting a fiscal crisis in the United States. Simply follow the Golden Rule. And, because of its spending cap, Switzerland is a good role model.

Read Full Post »

I narrated a six-minute video in 2009 to explain why America’s fiscal problem is spending rather than red ink. Here’s the same message in just 51 seconds.

If 51 seconds is too much, here’s a visual I created using the latest long-run forecast from the Congressional Budget Office.

The key thing to understand is causality. America’s ever-growing burden of government spending is causing rising levels of debt.

This is a point I’ve made several times in the past.

But there are two reasons why I’m revisiting the issue today.

First, Mark Warshawsky of the American Enterprise Institute has a new article explaining that the federal government’s deficit is much bigger if you use accrual accounting rather than cash-flow accounting. Here are some excerpts.

Last week, the Treasury Department released…the massive Financial Report (FR) of the US Government. Using an accrual accounting basis, rather than a cash basis, the FR shows a much poorer picture of the current finances of the federal government than the conventional budget. …The budget deficit under the conventional cash-basis terms increased from $1.4 trillion in 2022 to $1.7 trillion in 2023, or about 6.2 percent of GDP… The alternative measure presented in the FR of…$3.4 trillion in 2023…was double the cash basis deficit.

In other words, the symptom of red ink, measured on an accrual basis, is twice as bad as shown in the official numbers.

But I point this out because the real lesson to be learned is that our spending problem is worse than what is shown in the official numbers (blame entitlements).

Second, I want to again share this visual from 2021. It shows that debt-financed spending is bad for prosperity, but also shows that tax-financed spending and inflation-financed spending are similarly bad.

One takeaway from this little flowchart is that replacing debt-financed spending with tax-financed spending doesn’t solve the problem.

If we correctly identify spending as the problem, by contrast, then the only practical solution is to restrain spending.

P.S. This analysis is why a spending cap amendment (like TABOR or the Swiss Debt Brake) is much better than a balanced budget amendment.

Read Full Post »

Back in April, I warned that European governments were spending too much, sewing the seeds of another fiscal crisis (aided and abetted by the European Commission).

Let’s expand on that issue today, focusing specifically on the eurozone (the European nations that use the euro currency).

Here’s some OECD data on the burden of government spending in the major eur0-using countries.

That’s a depressing chart. All of those nations are far above the growth-maximizing size of government.

But a fiscal crisis doesn’t happen simply because a country has too much government. It also matters how much of the spending burden is financed by borrowing. And much existing debt there already is.

Speaking of which, here’s some OECD data on existing government debt in those nations.

Greece and Italy have the biggest debt burdens, but France, Spain, Portugal, and Belgium also have debt levels above 100 percent of GDP.

By the way, the future outlook also matters.

On that basis, Europe is in even greater danger, largely thanks to entitlements and demographics.

The OECD does not have country-specific projections of future debt, but here’s a chart from that bureaucracy’s recent Economic Outlook. It shows a 60 percent increase in debt for OECD governments over the next two decades.

I’m guessing a chart for eurozone nations would also show a big increase in debt levels (just like we saw a big jump last decade).

It is very likely that all the new spending and all the new debt will produce bad results.

Here are some excerpts from Desmond Lachman’s article in National Review.

Some 25 years after launching the euro, there has been continued divergence between the public finances and economic performances of the euro zone’s northern members and its southern periphery. While Germany and the other northern member countries have enjoyed prosperity and generally pursued responsible budget policies, income levels today in countries like Greece and Italy are practically unchanged from where they were some 15 years ago. Meanwhile, public-debt levels in the euro zone’s economic periphery have risen to record highs. …there is every reason to think that economic divergences will be exacerbated. That will raise new questions about the euro’s survivability once the European Central Bank (ECB) finally ends its bond-buying activities.

He’s right about the pernicious role of the European Central Bank.

That bureaucracy enabled more spending and more debt, and that means an ever bigger bubble that will cause more damage when it bursts.

And Lachman writes that it’s a matter of when, not if.

Up until last year, high public-debt levels were not of much concern when interest rates were low and when the ECB was buying massive amounts of bonds to support the euro zone economy. However, those days are long gone. In the wake of the recent inflation spike, the ECB…is about to finally end its bond-buying program. That will substantially increase the cost of rolling over the large amount of public debt that will come due next year. All of this makes it all too likely that it is a question of when — and not if — we will have another round of the European sovereign-debt crisis.

For what it’s worth, I think he’s right about another debt crisis.

And Italy will probably be where it starts.

P.S. While the European Central Bank has contributed to the problem, the European Commission also has enabled more profligacy.

As originally envisaged…, the euro zone contained no provisions allowing for rescues financed from within the currency union. This was designed to stop the historically less fiscally responsible members from free-riding… But it did not work out… To avoid taking the currency union into territory where one or more of its members might default, the euro zone (after adopting various ad hoc financing mechanisms and participating in a number of bailouts) now has institutionalized an emergency-funding regime.

P.P.S. The Maastricht criteria failed in part because they targeted the wrong variable.

In an effort to ensure responsible budget policies, the euro zone adopted the so-called Maastricht criteria, which were meant to guide each country’s budget policy. Members were supposed to restrain their budget deficits to no more than 3 percent of GDP. They were also supposed to bring their public-debt levels down to 60 percent of GDP. It would be an understatement to say that the Maastricht criteria have been observed in the breach. …Greece, Italy, Portugal, and Spain…all had budget deficits in excess of 3 percent of GDP and public-debt-to-GDP ratios exceeding 100 percent.

The right solution is a Swiss-style spending cap, and even the German government seems to understand that’s the right approach. And if some nations don’t want to adopt this solution, they should be allowed to default.

Read Full Post »

The United States is in fiscal trouble because of over-spending by Washington. And the problem will get worse in the future because of poorly designed entitlement programs.

But it also will get worse because Washington is filled with politicians who knowingly lie and simply don’t care.

To illustrate, here’s a viral tweet from Congressman Ro Khanna of California, which received 4.5 million views, followed by two correcting tweets (here and here) from Brian Riedl of the Manhattan Institute.

Sadly, neither of Brian’s tweets received much attention (less than 10,000 views compared to 4,500,000 views for Khanna’s nonsense).

Yet every honest person (including some honest leftists) knows Brian’s analysis is correct and Congressman Khanna is doing nothing but providing vapid and fraudulent clickbait.

Megan McArdle wrote about this for the Washington Post. Here are some excerpts.

Khanna’s assertions about the debt are simply not true, not even in the low, Washington sense of facially correct, yet wildly misleading. And I assume Khanna knows better. …everyone in Washington is playing the same damned game, a noxious hybrid of “let’s pretend” and “not it.” The budget hawks in the GOP have been effectively vanquished by the Trump faction, and the days when Democrats strove to claim the mantle of fiscal responsibility are long gone. …there is no excuse for failing to balance the books, except that the political trade-offs are hard, and — contra Khanna — almost certainly involve making changes to Social Security and Medicare. Together, these programs account for about one-third of spending, and that share is growing.This is America’s real budget crisis. And yet it pales in comparison with the biggest problem of all: politicians who keep trying to pretend our troubles away, rather than face up to what needs to be done.

Megan is right about Khanna, and she’s also right about Trump pushing aside fiscally rational Republicans.

So we have two parties in Washington controlled and led by people who are doing bad things, probably know they are doing bad things, but they simply don’t care (just in case anyone wonders why I think politicians are disgusting and reprehensible).

P.S. Megan’s column is wrong in that she also wrote that Ronald Reagan was “the most profligate of the bunch” in part because of his “failure to restrain spending.” That’s wildly wrong. A comprehensive study on fiscal history from the Mercatus Center showed LBJ and Nixon were the worst of the worst, while Reagan got the best marks. If you want to understand Reagan’s track record on spending, click here, here, here, and here.

Read Full Post »

Washington has a spending addiction. And it’s bipartisan.

To understand the magnitude of the problem, let’s look at how fast taxes and spending have increased this century compared to population plus inflation.

There are two obvious takeaways from this data.

  1. Washington receives more than enough tax revenue. Receipts have increases 137 percent since 2000, well beyond the 101 percent combined increase of inflation and population.
  2. The crowd in Washington is grotesquely profligate. The federal spending burden has jumped 255 percent since 2000, more than 2-1/2 times faster than needed to keep pace with inflation plus population.

I’m sharing this data because reckless fiscal policy at some point will probably produce a crisis. James Capretta of the American Enterprise Institute recently wrote on this topic.

Here are some excerpts.

…the only reason a debt crisis has not already occurred is that market participants assume a tax and spending correction is coming at some point. …if and when the market consensus shifts toward assuming a fix is not coming after all, a debt crisis would emerge in short order. Demand for U.S. debt would fall, interest rates would rise (thus causing deficits to widen still further), and a crisis will have begun. …the U.S. has only about 20 years left before debt reaches a level that it could not be brought back under control without a wrenching break from today’s benign economic environment, such as an extended period of hyperinflation. …The U.S. is now operating with no margin for error… It would not take much at this point for the market to conclude that U.S. political dysfunction is a hardening reality and not a passing phenomenon. The follow-on conclusion that a rational and planned course correction will never be forthcoming could be the match that lights the fire.

The bottom line is that the profligacy of Bush, Obama, and Trump has led to anemic growth and rising dependency.

For what it’s worth, I think that’s already a crisis, albeit a slow-acting crisis akin to cancer.

Capretta is writing about a different kind of crisis, mostly likely a sudden panic in financial markets (like Greece back in 2009-10), which is more akin to a heart attack.

Either option is bad.

I’ll close with good news and bad news.

The good news is that we know how that spending restraint is en effective way to reduce debt. We even know that’s the way to reduce enormous levels of debt.

The bad news is that politicians will want to impose tax increases. And history tells us that will simply lead to more spending and more debt.

Read Full Post »

Since I’m a big fan of spending caps in Switzerland and Colorado, I’m always on the lookout for research and analysis about fiscal rules.

For instance, there are pro-spending-cap studies from left-leaning bureaucracies such as the International Monetary Fund (here and here) and the Organization for Economic Cooperation and Development (here and here). There are also similar studies from the European Central Bank (here and here).

We can now add to that research with a new working paper from Switzerland’s Federal Finance Administration.

Authored by Thomas Brändle and Marc Elsener, it’s a very helpful review of different fiscal rules.

Let’s start by sharing a chart from the study on the number of fiscal rules. As you can see, the most dominant types of rules are anti-deficit (gray line) and anti-debt (black line).

Since I don’t think those rules are very effective, I’m more encouraged by the growing number of expenditure rules (blue line).

Here are some of the findings from the report.

A rich empirical literature investigates the impact of fiscal rules. First, the focus is on surveying recent studies that investigate the relationship between fiscal rules and “traditional” fiscal performance measures, such as public debt and budget balances. …For EU countries and the period 1990-2012, Nerlich and Reuter (2013)…find that the introduction of fiscal rules is related to lower public expenditures as well as to lower revenues. As the impact on revenues is smaller, the primary balance improves. This impact is stronger when fiscal rules are enacted in law or constitution and supported by independent fiscal institutions and effective medium-term expenditure frameworks. Fiscal rules have the strongest limiting impact on social spending, compensation of public employees.

Here are some additional studies that are cited in the paper.

Based on a panel of 30 OECD countries, Fall et al. (2015) find that fiscal rules are related to improved fiscal performance. In particular, a budget balance rule appears to have a positive and significant effect on the primary balance and a negative and significant effect on public spending. Expenditure rules are associated with lower expenditure volatility and higher public investment efficiency. …Focusing on expenditure rules, Cordes et al. (2015) present an analysis for 29 advanced and developing countries for the period 1985–2013. Using a dynamic panel estimation approach, the analysis shows that these rules are associated with better spending control…and improved fiscal discipline. …Asatryan et al. (2018) study whether constitutional-level fiscal rules – expected to be more binding – impact fiscal outcomes. …they find that the introduction of a constitutional balance budget rule leads to a lower probability of sovereign debt crisis. For their most preferred sample of 132 countries between 1945 and 2015, they find that the debt-to-GDP ratio decreases by around 11 percentage points on average with constitutional balance budget rules. Most of these consolidations are explained by decreasing expenditures rather than increasing tax revenues.

I’m most interested in controlling the burden of government spending.

For my friends who are mostly fixated on red ink, it’s worth noting that Switzerland’s spending cap – which took effect in 2003 – has caused a dramatic shift from rising debt to falling debt.

Debt did increase during the pandemic, of course, but Switzerland’s debt increase was very small compared to the United States.

And Swiss lawmakers will now be required to impose additional spending restraint to make up for that extra red ink.

Needless to say, there is no similar “clawback” requirement in the United States.

I’ll close by sharing this table from the study, which summarizes the recent academic research on fiscal rules.

My takeaway from all this research is that spending restraint is the only practical solution to protect against “goldfish government.”

Especially given the demographic changes that are making modern-day welfare states unsustainable,

Read Full Post »

I’ve been warning for many years (including less than two weeks ago) that it would be a big mistake to have a “grand bargain” budget deal that includes tax increases.

This is not because of math. It is possible, of course, to have an acceptable budget agreement that includes tax increases.

But only in theory. In reality, we have gobs of evidence (even from the New York Times, albeit inadvertently) that budget deals with higher taxes don’t work.

The reason is that politicians can’t resist the temptation to increase spending whenever they think more tax revenue might be available.

In other words, Milton Friedman was right when he warned that “History shows that over a long period of time government will spend whatever the tax system raises plus as much more as it can get away with.”

Unfortunately, some people don’t understand history. Or they don’t care.

For instance, Fareed Zakaria argues in the Washington Post that politicians should impose a value-added tax. Here are some excerpts.

Total debt is now more than $33 trillion, the deficit is over 7 percent of gross domestic product, and this year’s net interest payment on the debt will probably be over $650 billion… For almost a generation, policymakers have been able to avoid seriously confronting deficits… Fortunately, there is a simple solution staring us in the face… Adopt a national sales tax, like every other advanced economy in the world. …According to the Congressional Budget Office, a broad 5 percent tax of this kind could raise $3 trillion over the next decade… On average, European Union countries get roughly 20 percent of their tax revenue from a VAT; the United States is getting zero. …It is time for the United States to join more than 160 other countries with a value-added tax and ask all Americans to chip in to set the country on a firmer fiscal path for decades.

Zakaria’s numbers are accurate. A VAT would raise a lot of money, as predicted by the CBO. And European nations generate a lot of VAT revenue.

But what about his analysis? Is Zakaria correct that a VAT would put America on “a firmer fiscal path”?

Since he cites Europe, let’s look at the evidence. I did this back in 2012, looking at the nations in Western Europe that are most similar to the United States, and comparing tax and debt levels both before and after value-added taxes.

And I did the same thing in 2016. In both cases, I used five-year averages to ensure that the numbers were not misleading because of the business cycle or anything else that might produce quirky data for a year or two.

In both cases, I found that politicians imposed massive tax increases, with VATs playing a big role. But I also discovered that politicians spent even more money (just as Friedman predicted), so the net result was more red ink.

Let’s now update that research.

We’ll start with this chart, which shows yet again that there has been a massive increase in tax revenue in Western European nations over the past five-plus decades.

If Zakaria and other pro-tax increase people are right, all that new revenue should have produced “a firmer fiscal path” of less debt.

Our second chart shows that government debt in the late 1960s averaged about 45 percent of GDP in Western Europe.

So what actually happened?

Did debt get paid off? Did debt get reduced? Was Western Europe put on “a firmer fiscal path”?

Of course not

As shown in our final chart, debt levels in the past five-plus decades have doubled to nearly 90 percent of GDP.

By the way, I’m mixing and matching data from several sources, so I’m sure that the numbers from the late 1960s are not a perfect match for the IMF numbers I used for 1919-2023.

That being said, there’s no arguing with the core finding. Massive revenue increases resulted in much higher levels of red ink because politicians increased the burden of government spending even faster.

Needless to say, analysis from “public choice” tells us that the same thing would happen in the United States.

Read Full Post »

Even though America’s long-run fiscal outlook is very grim, I wrote a two-part series earlier this year (here and here) to explain why the situation is not hopeless.

First and foremost, I noted that the only good solution is long-run spending restraint. Fortunately, that’s been done before. There have been three periods of good fiscal policy in recent decades.

And I also explained that we already know what specifically needs to be done to fix entitlements (which unambiguously are the cause of our long-run problems).

In other words, we know the problem, we know how to solve it, and history shows that periods of fiscal restraint are possible.

I’m not the only one who is expressing optimism.

Two former Senators, Rob Portman (R-OH) and Kent Conrad (D-ND), have a column in yesterday’s Washington Post about the need to address America’s fiscal problems.

And they also don’t think the situation is hopeless. Here’s their core argument.

The deficit has doubled in the past year, and the national debt — some $33 trillion… — is diminishing our standing in the world. It is immoral to leave this level of debt to our children and grandchildren, and it is already affecting our economy. …But this is not a hopeless situation. …it is time to try an approach that removes some of our divisive politics from the picture: Congress must establish a bipartisan commission to put the country on a sustainable fiscal path. …Democrats will resist many of the necessary spending reductions, Republicans will resist needed revenue increases, and Democrats and Republicans alike will balk at the needed reforms to entitlement programs. But this approach has repeatedly helped move the country out of stalemate in the past. …our near- and long-term fiscal outlook is dangerously unsustainable. A fiscal commission should explain in objective terms the fiscal crisis we face and its consequences, scrutinize the entire federal budget, and make specific recommendations on revenue and spending, including what should be done to rescue our entitlement programs from insolvency. …A bipartisan commission might be our best chance to bestow upon future generations a stable financial future rather than an overwhelming financial burden and an America in decline.

I’m glad that these two former lawmakers are calling attention to our fiscal mess.

That being said, I have two big concerns with their argument.

  1. They focus on red ink, which should be viewed as a symptom. The real problem is excessive spending. Real-world evidence shows that if you cure the underlying disease of excessive government, you automatically solve the symptom of deficits and debt.
  2. They explicitly – and mistakenly – open the door to tax increases. But once taxes are on the table, we know from history that the result will be a deal filled with (very bad) tax increases and make-believe (and quickly vanishing) spending restraint.

Interestingly, the New York Times accidentally did some research that proves my case.

In an article back in 2011, Catherine Rampell looked at various bipartisan budget deal to measure the ratio of tax increases to (supposed) spending cuts.

What she found was that only one budget deal had zero tax increases, the one in 1997. Indeed, that budget deal actually cut taxes.

And guess what? That was the only budget deal that produced a budget surplus.

The moral of the story should be obvious.

P.S. Senators Portman and Conrad seem to think that Simpson-Bowles budget plan is a good framework, but I explained in 2012 and 2013 why that plan would be an unmitigated disaster.

P.P.S. My opposition to higher taxes is practical rather than ideological. Back in 2012, I listed three big tax increases I would accept assuming politicians would be willing to make some long-overdue spending reforms. Suffice to say nobody on the left has been willing to accept that offer.

Read Full Post »

The burden of federal spending today is too high, diverting resources from the productive sector of the economy and sapping America’s economic vitality.

Unfortunately, today’s bad news about excessive government spending will become tomorrow’s terrible news.

The problem is entitlement programs.

When politicians created programs such as Medicare, Medicaid, and Social Security, they did not understand (or did not care) about what might happen if people started living longer and/or having fewer children.

These demographic changes are profoundly important because they translate into an ever-growing burden of government spending. Simply stated, the United States is becoming a society with more and more people expecting benefits from the government and fewer and fewer taxpayers to pay for those goodies.

The Center for Freedom and Prosperity has just released a three short studies to explain this problem. Authored by Robert O’Quinn, who has held senior positions in both the executive and legislative branches, this three-part series will make you better informed than most so-called budget experts in Washington.

Part I of the three-part series is a primer on the federal budget. It explains all sorts of wonky topics such as the differences between “mandatory spending” and “appropriations.” Readers will learn about the importance of “budget reconciliation” and “federal debt held by the public.” This paper does not look at policy choices, but readers will learn about the process of making fiscal policy (something I explained with far less detail back in 2018).

Part II of the three-part series a primer on federal spending, revenue, and red ink. Readers will learn how federal spending and revenue have changed over time (hint: both have increased, but spending has grown at the fastest rate). The paper explains the economic impact of spending, taxes, and deficits. For those who don’t have time to read the study, here’s the most important thing to understand.

Federal outlays are growing significantly faster than the U.S. economy, while federal receipts are growing slightly faster than the U.S. economy. Consequently, federal budget deficits and federal debt held by the public are widening as a percent of GDP. …the key problem is the growing burden of spending. Replacing debt-financed spending with tax-financed spending would leave the nation’s fiscal burden unchanged. Or it might make a bad situation even worse if politicians increase spending because of an expectation of additional revenue.

Part III of the three-part series is a primer on entitlement programs. It explains that entitlements are responsible for America’s growing burden of government spending. Readers will learn about the fiscal consequences of Medicare, Medicaid, and Social Security. Everyone should read this report, but for those of you with limited time, this chart is the most important thing to understand. You can see the burden of different spending categories in 2000, 2023, and 2054, and the problem areas are quite obvious.

All three studies are primarily designed to inform readers about basic facts so they have a real-world understanding of America’s deteriorating fiscal outlook.

I’ll conclude this column, though, by making a very important point about public policy. Simply stated, the United States will not be able to issue endless amounts of government debt.

As a result, this means that the nation will have to close the huge long-run gap between spending and revenue by making an unavoidable choice between massive tax increases and genuine entitlement reform.

Because of their opposition to entitlement reform, politicians such as Joe Biden and Donald Trump prefer giant tax increases. And because there are not enough rich people to finance big government, the Biden-Trump tax increases will target lower-income and middle-class households.

Read Full Post »

I’m not a big fan of Moody’s, Fitch, and Standard & Poor’s.  As I explained in this 2011 interview, these credit rating firms don’t provide much insight, at least with regards to assessing whether governments can be trusted to honor their debts.

That being said, I don’t object to Fitch’s decision to reduce America’s rating from AAA to AA.

Here’s some of what the company wrote.

Fitch Ratings has downgraded the United States of America’s Long-Term Foreign-Currency Issuer Default Rating (IDR) to ‘AA+’ from ‘AAA’. …The rating downgrade of the United States reflects the expected fiscal deterioration over the next three years, a high and growing general government debt burden, and the erosion of governance relative to ‘AA’ and ‘AAA’ rated peers over the last two decades that has manifested in repeated debt limit standoffs and last-minute resolutions. …Additionally, there has been only limited progress in tackling medium-term challenges related to rising social security and Medicare costs due to an aging population.

While I agree with the downgrade, I have a couple of observations.

  • The US is in strong shape in the short run: There is zero chance that bondholders will lose money in the next 20 years. Even if Republicans and Democrats had a bigger-than-normal fight over the debt limit, leading to some bondholders not getting paid on time, lawmakers would fully compensate them in any eventual agreement.
  • The US is in terrible shape in the long run: American politicians are grotesquely irresponsible. They mostly understand that America faces an entitlement crisis, but most of them are unwilling to address the problem. Heck, some of them want to dig the hole deeper by expanding the welfare state.
  • America’s long-run fiscal problem is bipartisan: Starting with LBJ and Nixon, politicians from both parties have expanded the burden of government. The deterioration has continued this century with two Republican presidents and two Democratic presidents pushing for more spending.

By the way, there’s little reason for future optimism. Trump and Biden attack anyone who wants to do the right thing on entitlements, so that makes it more likely that politicians eventually will compound the damage of higher spending by enacting higher taxes.

P.S. A big problem with the credit rating firms is that they seemingly think tax increases and spending restraint are equally acceptable ways of reducing red ink and improving creditworthiness. But since higher taxes lead to less growth and encourage more spending, the inevitable result is that tax increases lead to more debt. Just look at what’s happened in Europe.

Read Full Post »

I sometimes disagree with the Committee for a Responsible Federal Budget because they mistakenly focus on reducing deficits and debt, which makes them very vulnerable to supporting counterproductive tax increases (such as Biden’s misnamed Inflation Reduction Act).

But they generally provide useful analysis, so I regularly read CRFB publications.

And when they put together online quizzes (whether well designed or poorly designed), I can’t resist seeing my score.

Which is why I just filled out their online test to see if I could “Fix the National Debt.”

They start with projections of what debt will be in 2033 and 2050 if we leave fiscal policy on autopilot.

If you take the test, you get all sorts of options to increase spending, reduce spending, raise taxes, and/or cut taxes.

When I finished, here are the projections for debt levels in those two years.

The test did not require much time, so that’s good.

But there are three pieces of bad news.

  1. There were not nearly enough options to restrain and/or cut spending and zero options for shutting down departments (such as  EducationEnergyHUDAgriculture, and Transportation).
  2. There was no data on what happens to the burden of government spending as a share of GDP, which is a more important indicator of good policy than what happens to debt as a share of GDP).
  3. You don’t even get to see whether the budget is balanced or in surplus by 2033 or 2050, which is not that important but nonetheless would be interesting to see (here’s how it can happen).

That being said, the test was fun to take and I recommend others give it a try. Feel free to list your results in the comments.

P.S. Here are the shortest and longest quizzes that I’ve shared.

P.P.S. Here’s the Washington Post‘s budget quiz for those who want to focus on fiscal policy.

Read Full Post »

The Congressional Budget Office has released its new Long-Term Budget Outlook and I will continue a now-annual tradition (see 2018, 2019, 2020, 2021, 2022) of sharing some very bad news about America’s fiscal future.

Here’s the most important chart. It shows two unfortunate developments. First, we see that the tax burden is gradually increasing as a share of economic output. Second, we see that the burden of federal spending is increasing even faster.

What happens when spending grows even faster than revenue?

We get more government debt. Or, to be more precise, this next chart shows that we get a lot more debt.

Indeed, the debt is going to reach unprecedented levels over the next 30 years.

I normally don’t fret that much about red ink. After all, deficits and debt are largely symptoms of a much bigger problem, which is excessive government spending.

That being said, high levels of debt can trigger a crisis if investors decide (like they did in Greece) that a government can’t be trusted to pay all promised money to bondholders.

Now let’s get back to the underlying problem of too much government.

What’s driving America’s long-run problems? In part, the answer is higher interest payments on the ever-increasing debt.

But the real problem, as CBO shows in Figure 2-5, is entitlement programs.

Looking at the above charts, and at the risk of repeating what I’ve already written (many times), the United States is between a rock and a hard place. The only choices are:

  1. Keep fiscal policy on auto-pilot, allowing government to grow until we suffer a Greek-style debt crisis.
  2. Impose massive tax increases on the middle class to finance an ever-bigger future government.
  3. Reform entitlement programs to restrain the growing burden of government spending.

Unlike Joe Biden and Donald Trump, I think the obvious choice is #3.

P.S. There was some sensible economic analysis in the CBO report.

Here’s what it said about the economic impact of deficits.

Deficits grow in the agency’s budget projections, and as a result, the federal government borrows more each year. That increase in federal borrowing pushes up interest rates and thus reduces private investment in capital, causing output to be lower in the long term than it would be otherwise, especially in the last two decades of the projection period. Less private investment reduces the amount of capital per worker, making workers less productive and leading to lower wages. Those lower wages reduce people’s incentive to work and, consequently, lead to a smaller supply of labor.

And here’s what CBO says about the impact of taxes.

Under current law, tax rates on individual income will rise at the end of 2025 when those provisions are scheduled to expire. Moreover, as income rises faster than inflation, more income is pushed into higher tax brackets over time. That real bracket creep results in higher effective marginal tax rates on labor income and capital income.11 Higher marginal tax rates on labor income would reduce people’s after-tax wages and weaken their incentive to work. Likewise, an increase in the marginal tax rate on capital income would lower people’s incentives to save and invest, thereby reducing the stock of capital and, in turn, labor productivity. That reduction in labor productivity would put downward pressure on wages. All told, less private investment and a smaller labor supply decrease economic output and income in CBO’s extended baseline projections.

Nothing wrong with that analysis. There are negative consequences when governments borrow and there are negative consequences when governments tax. But there was a sin of omission. CBO also should have explained (as it has on other occasions) that there are negative economic consequences when governments spend.

Read Full Post »

Looking just at fiscal policy, who is the worst president in American history?

Based on historical data from the Office of Management and Budget, I calculated a few years ago that Richard Nixon was the biggest spender, followed by Lydon Johnson.

But I was only looking at the growth of inflation-adjusted spending during the fiscal years when various presidents were in office.

What about long-run estimates of how various presidents have changed America’s (depressing) fiscal trajectory.

Glenn Kessler of the Washington Post did something like this, though he focused on red ink rather than the spending burden.

That being said, he found somewhat similar results. Only he reports that LBJ was the worst with Nixon being the second worst.

Policy choices made long ago are more responsible for the fiscal state of the nation. Assigning a particular president responsibility for a debt increase is rarely productive, because so much depends on factors beyond a president’s control — an economic crisis such as the Great Recession or the pandemic, for example. …Which president has contributed the most to the nation’s long-term fiscal imbalance? That would be Lyndon B. Johnson… Through an exhaustive study of Congressional Budget Office and Office of Management and Budget reports, …LBJ’s share of the fiscal imbalance is 29.7 percent. Close behind is Richard M. Nixon, with 29.2 percent. Johnson enacted Medicare and Medicaid in the mid-1960s, and then Nixon in the early 1970s expanded both programs and also enhanced Social Security so that benefits were indexed to inflation. …almost two-thirds of the nation’s long-term fiscal imbalance is a result of policy choices made more than 50 years ago.

I’m not surprised that Medicare and Medicaid get so much blame. They deserve it!

By the way, Kessler did not do his own calculations.

Instead, he relied on some research by Charles Blahous. Here’s the relevant table from that study, which was published in late 2021.

I’m not surprised that Reagan was the best president.

P.S. Biden was not included since he has just entered office when the research was conducted. If there is a similar study 10 years from now, I’m guessing he will be like Obama with bad but not horrible results. Yes, Biden has an awful fiscal agenda, but his failed stimulus and the watered-down (and absurdly misnamed) Inflation Reduction Act may wind up being the only significant damage he imposes.

Read Full Post »

Regarding the debt ceiling, the hysterical headlines about default and an economic apocalypse are silly because the Treasury Department surely will “prioritize” if Republicans and Democrats don’t reach an agreement.

The above clip was taken from an interview last week with the Soul of Enterprise.

I wasn’t intending to write about this topic, but it’s getting a lot of attention now that the deadline is approaching.

If you want to understand the real issue, there is an excellent column in the Wall Street Journal by former Senator Phil Gramm and his long-time aide, Mike Solon.

They explain that the fight is between House Republicans, who want domestic discretionary spending to grow at a slower rate and Democrats in the Senate and White House who want it to grow at a faster rate.

Here’s some of what they wrote.

Of the $5 trillion of stimulus payments between 2020 and 2022, some $362 billion has yet to be spent. The House debt-limit bill proposes to claw back $30 billion—or some 8% of the unspent balance. Only in Mr. Biden’s White House and Mr. Schumer’s Senate Democratic Caucus could such a modest proposal be considered extreme. …The most recent CBO estimate projects that fiscal 2024 discretionary spending will clock in at $1.864 trillion—a 10% real increase from the pre-pandemic estimate. …This growth in nondefense discretionary spending is the post-pandemic bow wave that Mr. McCarthy’s debt-limit plan seeks to mitigate. Even if the House GOP’s proposed reductions in discretionary-spending growth took effect, total discretionary spending would still be 2.4% more in inflation-adjusted dollars than the CBO’s 2020 projection for fiscal 2024. …A clean debt-ceiling hike would give us more government spending, and the House GOP’s proposal would allow more private spending. Only in Washington is that a hard choice.

Needless to say, I disagree with both sides. There should be deep and genuine cuts in domestic discretionary spending.

But a slower increase is better than a faster increase. And I reckon any support for fiscal restraint by Republicans is welcome after the reckless profligacy of the Trump years.

The bottom line is that fights over the debt limit are messy, but if we actually got some good policy reforms, such battles could save us from something very bad in the future.

Read Full Post »

The Swiss Debt Brake and Colorado’s TABOR work because they limit spending. Balanced budget requirements, by contrast, have a weak track record.

My point in the above discussion with the Soul of Enterprise is mostly based on economics.

Our fiscal challenge in the United States is excessive government spending. And the problem is projected to worsen in coming decades because of demographic change and poorly designed entitlement programs.

So it makes sense to directly address the problem with a spending cap.

By contrast, a balanced budget amendment is merely designed to inhibit debt-financed spending. That’s a good goal, but it won’t lead to good results if politicians react by simply increasing tax-financed spending. Or if they finance spending with bad monetary policy.

As I point out in the video, balanced budget requirements and anti-deficit rules have not produced good results in American states or EU nations.

The takeaway is that good policymakers should push for spending caps for theoretical reasons and practical reasons.

P.S. I was very pleasantly surprised when the German government recently endorsed EU-wide spending caps.

P.P.S. Remarkably, there are pro-spending-cap studies from left-leaning bureaucracies such as the International Monetary Fund (here and here) and the Organization for Economic Cooperation and Development (here and here). There are also similar studies from the European Central Bank (here and here).

P.P.P.S. It should go without saying, but I’ll say it anyhow, that a spending cap should be set at a level that actually results in less government.

Read Full Post »

I rarely write about the national debt for the simple reason that it is far more important to focus on the burden of government spending.

After all, improper spending saps economic vitality, regardless of whether it is financed with taxes, borrowing, or money printing.

But I’m writing about debt today because something very interesting has happened in the past few years.

From early 2020 to late 2022, profligate politicians increased the national debt by about $3 trillion, yet government debt actually  declined when measured as a share of economic output.

Here’s a chart from the St. Louis Federal Reserve Bank, which shows that over the past couple of years that debt has dropped from nearly 135 percent of GDP down to about 120 percent of GDP.

So what happened? How can debt explode, yet the debt burden simultaneously fall?

There’s one good answer and one very bad answer.

The good answer is that the economy fell into a terrible recession when the Coronavirus pandemic first began. And since GDP was falling while deficit spending was skyrocketing, that explains why debt spiked upwards in early 2020.

But as that downturn has faded, overall economic output (GDP) has recovered. And because GDP increased during that period faster than debt increased, it means less debt as a share of GDP.

Which is partly what is shown in the chart.

But there’s also a bad reason. Irresponsible monetary policy has saddled the economy with high rates of inflation.

In the short run, as explained by Veronique de Rugy of the Mercatus Center, this has made the debt burden appear smaller.

Government debt as a share of the U.S. economy is falling. This must mean President Joe Biden’s administration and Congress are practicing fiscal responsibility, right? No, it doesn’t. The main driver behind the reduction is inflation… The missing debt is nothing to celebrate when it’s due to inflation, something especially harmful for poorer Americans who see their living standards erode. …the inflation, which came as a surprise to so many, …led to the decrease in the debt-to-GDP ratio. According to an International Monetary Fund (IMF) fiscal monitor study, in countries with debt-to-GDP over 50 percent, for every 1 percentage point of unexpected inflation, the debt ratio will be reduced by 0.6 percentage points. This perfectly explains most of the debt-ratio decline. …The Biden administration has inadvertently reduced the debt-to-GDP ratio. But it has done it in the worst possible way, refusing to heed warnings of an inflation debacle and instill some fiscal common sense. This has made the work of the Fed harder, if not impossible, and life more difficult for rich and poor Americans alike.

There’s some wonkiness in the above excerpt, but all you really need to know is that high rates of inflation can reduce the value of financial assets. Especially assets (like government bonds) that pay low rates of interest.

This is a form of financial repression.

And it only works in the short run. In the long run, inflation leads to higher interest rates (as we are now observing).

So any short-run benefits are more than offset by higher long-run costs. Sort of the monetary version of my Fourteenth Theorem of Government.

P.S. History shows us that there is a very successful recipe for reducing large debt burdens.

Read Full Post »

Why did many European nations, most notably Greece, suffer fiscal crises about a dozen years ago?

Because the burden of government spending, which already was excessive, increased even further.

And with taxes already very onerous in those countries, much of that new spending was financed with borrowing.

Investors then realized it was very risky to finance the various spending sprees. And when they stopped buying bonds from these governments (or started demanding higher interest rates to compensate for risk), that triggered the crises.

One would think that the nations most affected – Portugal, Italy, Greece, and Spain (the PIGS) – would have learned a lesson.

Nope.

As you can see from this IMF data, those governments did not use the post-crisis recovery as an opportunity to get debt under control. Instead, every nation has more debt today than it did when the crisis occurred.

And why do these nations have higher debt levels?

For the simple (and predictable) reason that they have not reduced the burden of government spending.

Instead, as you can see from this next chart, governments are now consuming even greater shares of national economic output. Which means a greater chance of more crises.

To make a bad situation even worse, the European Central Bank cranked up the figurative printing press starting in 2020 by massively expanding its balance sheet.

Dumping all that money into the system quite predictably caused prices to soar. And now that the ECB is belatedly trying to undo its mistake.

That puts the PIGS under more pressure, as Desmond Lachman explained for National Review.

Christine Lagarde, the president of the European Central Bank (ECB)…has to raise interest rates at a time when governments in the euro zone’s economic periphery are more indebted today than they were at the time of the 2010 euro zone sovereign-debt crisis. This more hawkish interest-rate policy, coupled with a shift to quantitative tightening, now risks triggering another round of the euro zone debt crisis. …One of the ECB’s problems in having to raise interest rates aggressively to contain inflation is that such a course risks exacerbating the cracks that are now emerging in the European banking system. …if current trends continue, then another round of euro zone sovereign-debt crisis, where investors lose faith in the government’s ability to repay its debt, could be just around the corner. …This is especially true for Italy, where until recently the ECB had been buying Italian government bonds equivalent to that government’s net borrowing needs.

By the way, Lachman seems to think the Fed should allow continued inflation in order to help bail out Italy and the other PIGS.

That would be a big mistake. The long-run damage of that approach would be much greater than the long-run damage (actually, long-run benefits) of letting Italy and the others go bankrupt.

P.S. The problem in Europe is too much government spendingnot the euro currency.

P.P.S. Eurobonds will make things worse in the long run.

P.P.P.S. It is possible to reduce large debt burdens, so long as governments simply restrain spending.

P.P.P.P.S. From the archives, here’s some comedy (and more comedy) about Europe’s fiscal mess.

Read Full Post »

The 2023 Social Security Trustees Report was released yesterday, and just like I did last year (and the year before, and the year before that, etc), let’s look at the fiscal status of the retirement program.

There is a lot of data in the Report. But the most important set of numbers can be found in Table VI.G9.

As you can see from this chart, these numbers show the amount of revenue coming into the program each year, adjusted for inflation, as well as the amount of yearly spending. Both are rising rapidly.

Since the orange line (spending) is climbing faster than the blue line (revenue), the obvious takeaway is that Social Security has a deficit.

But that would be an understatement.

As you can see from the second chart, the cumulative deficit over the next 77 years is more than $60 trillion.

You’ll notice, of course, that I added a bit of editorializing to both charts.

That’s because it is reprehensible that Joe Biden and Donald Trump are opposed to reforms that would modernize the program.

They won’t admit it, but their approach necessarily and unavoidably means huge tax increases on lower-income and middle-class households.

P.S. If you are not Biden or Trump and want to do what’s best for America, I suggest learning about reforms in Australia, Chile, SwitzerlandHong KongNetherlands, the Faroe IslandsDenmarkIsrael, and Sweden.

Read Full Post »

In this segment from a December interview, I explain that budget deficits are most likely to produce inflation in countries with untrustworthy governments.*

The simple message is that budget deficits are not necessarily inflationary. It depends how budget deficits are financed.

If a government finances its budget deficits by selling bonds to private savers and investors, there is no reason to expect inflation.**

But if a government finances its budget deficits by having its central bank create money, there is every reason to expect inflation.

So why would politicians ever choose the second option? For the simple reason that private savers and investors are reluctant to buy bonds from some governments.

And if those politicians can’t get more money by borrowing, and they also have trouble collecting more tax revenue, then printing money (figuratively speaking) is their only option (they could restrain government spending, but that’s the least-preferred option for most politicians).

Let’s look at two real-world examples.

  • Consider the example of Japan. It has been running large deficits for decades, resulting in an enormous accumulation of debt. But Japan has very little inflation by world standards. Why? Because governments bonds are financed by private savers and investors, who are very confident that the Japanese government will not default..
  • Consider the example of Argentina. It has been running large deficits for decades. But even though its overall debt level if much lower than Japan’s, Argentina suffers from high inflation. Why? Because the nation’s central bank winds up buying the bonds because private savers and investors are reluctant to lend money to the government.

If you want some visual evidence, I went to the International Monetary Fund’s World Economic Outlook database.

Here’s the data for 1998-2022 showing the average budget deficit and average inflation rate in both Japan and Argentina.

The bottom line is that prices are very stable in Japan because the central bank has not been financing Japan’s red ink by creating money.

In Argentina, by contrast, the central bank is routinely used by politicians as a back-door way of financing the government’s budget.

*To make sure that my libertarian credentials don’t get revoked, I should probably point out that all governments are untrustworthy. But some are worse than others, and rule-of-law rankings are probably a good proxy for which ones are partially untrustworthy versus entirely untrustworthy.

**Borrowing from the private sector is economically harmful because budget deficits “crowd out” private investment. Though keep in mind that all the ways of financing government (taxes, borrowing, and money creation) are bad for prosperity.

Read Full Post »

Every six months or so, the Congressional Budget Office produces a 10-year forecast and most fiscal experts focus on the projections for deficit and debt.

Those are important (and worrisome) numbers, but I first look at the data showing what will happen to taxes and spending.

And you can see from this chart that the fiscal burden of the federal government is projected to grow at a very rapid pace over the next decade.

Other fiscal experts fret that deficits and debt are increasing between now and 2033, but the above chart shows that the real problem is that the spending burden is rising faster than the tax burden.

The real fiscal fight in Washington is how to close the gap between the red spending line and the green revenue line (supporters of Modern Monetary Theory say we can just print money to finance big government, but let’s ignore them for purposes of today’s column).

Since I think Washington is spending far too much, I want to close the gap by restraining the growth of government.

So here’s a second chart illustrating what would happen if there was some sort of spending cap. As you can see, a spending freeze (like we had from 2009-2014) would balance the budget by 2030.

And spending would have to be limited to 1.3 percent annual growth if the goal is to balance the budget within 10 years,

We can solve the problem. That’s the good news.

The bad news is that politicians don’t want to restrain spending.

And, even if they did want to do the right thing, adhering to a 1.3 percent spending cap would require serious entitlement reform. So don’t hold your breath hoping for immediate progress.

P.S. The numbers are out of date, but here’s a video that explains how spending restraint is the key to fiscal balance. And here’s a video on how some other nations made enormous progress with multi-year spending restraint.

Read Full Post »

Regular readers know that I generally don’t get overly agitated about government debt (I get far more upset about counterproductive spending, regardless of how it is financed).

But even I recognize that there is a point where debt becomes excessive.

So let’s start today’s column with the simple observation that America’s current fiscal trajectory is unsustainable.

The burden of federal spending is projected to jump over the next several decades up to 30 percent of GDP while taxes “only” increase to about 19 percent of GDP.

It is inconceivable that all that new spending will be – or can be – financed by borrowing. Simply stated, domestic and international investors will decide that bonds from Uncle Sam are too risky.

So that leaves only two options.

  1. Spending restraint, inevitably requiring entitlement reform.
  2. Massive tax increases, inevitably targeting middle-class Americans.

Regarding those two choices, Donald Trump supports massive tax increases.

He’s not overtly admitting that agenda, but that’s the unavoidable outcome based on what Joshua Green of Bloomberg recently reported about his opposition to entitlement reform.

Trump is hoping to reverse his fortunes and revive his moribund presidential campaign with a…short video message. …he looks straight to camera and declares, “Under no circumstances should Republicans vote to cut a single penny from Medicare or Social Security.” …In fact, he has been remarkably consistent and outspoken over the years in his attacks on Republican efforts to cut Social Security and Medicare. …he was viewed as the least conservative Republican nominee in decades. He favored lots of infrastructure spending…and he made a big deal about protecting Social Security and Medicare.

The story also explains that Trump was the big-government candidate among Republicans in 2016 (as I noted at the time) and suggests he will hold to that position as the 2024 race develops.

Trump’s position set him apart from the other 16 Republican presidential candidates, who generally shared Ryan’s belief, prevalent among House Republicans, that cutting Social Security and Medicare was a fiscal imperative. That’s where DeSantis comes in. …DeSantis was also one of the founding members of the House Freedom Caucus, which drove the effort to cut entitlements when he was in Congress. DeSantis voted repeatedly — in 2013, 2014, and 2015 — for budgets that slashed spending on Social Security and Medicare

By the way, the article is flat-out wrong on a few points.

It is grossly inaccurate to assert that the Ryan budgets “slashed spending.” Overall spending increased in the budgets that Ryan, DeSantis, and other Tea Party Republicans supported back in 2013, 2014, and 2015.

All that happened is that spending would not have been allowed to grow as fast as previously planned.

Also, while the Ryan budgets included genuine Medicare reform (and much-needed spending restraint), they did not address Social Security reform. So the report was wrong on that as well.

But I’m digressing. The key thing to understand is that Ryan, DeSantis and other Republicans in the House last decade tried to do the right thing.

Donald Trump, by contrast, did the wrong thing. And he wants to do the wrong thing in the future. And that means huge future tax increases on you and me.

Read Full Post »

When leftists (or misguided rightists) tell me that Americans are under-taxed and that the government has lots of red ink because of insufficient revenue, I sometimes will direct them to the Office of Management and Budget’s Historical Tables in hopes of changing their minds.

I’ll specifically ask them to look at the data in Table 1-3 so they can see what’s happened to federal tax revenue over time. As you can see from this chart, nominal tax revenues have skyrocketed.

The reason that I send them to Table 1-3 is that they can also peruse the numbers after adjusting for inflation.

On that basis, we see the same story. Inflation-adjusted federal tax revenues have grown enormously.

The two charts we just examined are very depressing.

So now let’s peruse at a chart that is just mildly depressing.

If you look at federal tax revenues as a share of economic output, you’ll see that Uncle Sam currently is collecting slightly more than 18 percent of economic output. Since the long-run average is about 17 percent of GDP, that’s not a horrific increase.

However, there are still some reasons to be quite concerned.

  • The Congressional Budget Office projects the tax burden as a share of GDP will expand even further over the next few decades.
  • That means that politicians in DC not only are getting more money because of inflation, but also because the economy is expanding.
  • Third, not only are politicians getting more money because the economy expanding, they’re slowly but surely expanding their share.

That’s very bad news for those of us who don’t like higher taxes and bigger government.

Some people, however, have a different perspective

In one of his columns for the New York Times, Binyamin Appelbaum argues that Americans are undertaxed.

…the United States really does have a debt problem. …Americans need more federal spending. The United States invests far less than other wealthy nations in providing its citizens with the basic resources necessary to lead productive lives. …Measured as a share of G.D.P., public spending in the other Group of 7 nations is, on average, more than 50 percent higher than in the United States. …There is another, better way to fund public spending: collecting more money in taxes. …If the debt ceiling serves any purpose, it is the occasional opportunity for Congress to step back and consider the sum of all its fiscal policies. The nation is borrowing too much but not because it is spending too much. The real crisis is the need to collect more money in taxes.

I give Appelbaum credit for honesty. He openly advocates for higher taxes and bigger government, explicitly writing that “Americans need more federal spending.”

And he is envious that spending in other major nations is “more than 50 percent higher than in the United States.”

But this raises the very obvious point about whether we should copy other nations with their bigger welfare states and higher tax burdens. After all, European nations suffer from weaker economic performance and lower living standards.

Does Appelbaum think we’ll have “productive lives” if our living standards drop by 50 percent?

Does he think that “invest” is the right word for policies that lead to lower economic performance?

The bottom line is that I’m completely confident that Appelbaum would be stumped by the never-answered question.

P.S. Dishonest leftists claim tax increases will lead to less red ink while honest leftists like Appelbaum admit the real goal is a bigger burden of government.

Read Full Post »

Back in 2016, here’s what I said about the debt limit during some congressional testimony (and I made very similar points in some 2013 testimony).

Near the end of my testimony (about 4:55) I discuss “prioritization,” which is what would happen if the debt limit is not raised and the Treasury Department has to decide which payments are made (and which payments are delayed).

I then pointed out that federal tax revenues in 2017 were expected to be 11 times greater than annual interest payments.

As such, there obviously would have been plenty of cash available to make interest payments, as well as to finance other economically or politically sensitive items (I assume, for instance, that Treasury would have prioritized monthly Social Security benefits as well).

Would this have been messy? Yes. Would it have been uncharted territory not covered by the law? Yes. But would it have been better than default, which would have caused turmoil in financial markets? Another yes.

Which now brings us to the present day. We’re now in another debt limit fight, so I decided to look at the most-recent data from the Congressional Budget Office to see whether the federal government will still have plenty of cash so that interest payments on the debt can be prioritized.

Lo and behold, annual tax revenue this fiscal year is going to be more than 11 times greater than annual interest payments. Just like in 2017.

In other words, we presumably can sleep easy. There’s plenty of money to pay interest on the debt.

There would only be a default if Joe Biden or Janet Yellen (the Treasury Secretary) deliberately chose not to prioritize. And the odds of that happening presumably are way below 1 percent.

Some people may wonder why we should accept even that small risk? Why not simply increase the debt limit so that the odds of a default are 0 percent?

That’s a fair point, but it must be balanced by the recognition that the United States is on a path to long-run economic and fiscal chaos. So I can also understand why some lawmaker say the debt limit should only be raised if accompanied by some much-need spending restraint.

And, for those who care about real-world evidence, that’s what has happened in the past. Indeed, Brian Riedl notes that it’s the only plausible vehicle for altering the nation’s fiscal trajectory.

I’ll close by expressing pessimism that House Republicans will achieve anything in the current fight over the debt limit.

We won’t get something really good, like a spending cap. But I start with very low expectations, so I guess I’m happy that Republicans are at least pretending to care once again about excessive government spending.

A journey of a thousand miles begins with a first step!

P.S. I partially disagree with Brian Riedl’s list. The 1990 Bush tax increase was not a “deficit-reduction law.” And it was post-1994 spending restraint that produced a balanced budget, not Clinton’s 1993 tax increase.

P.P.S. Remember that debt is bad, but it should be viewed as a symptom. The underlying disease is excessive government spending.

Read Full Post »

As part of my annual “Hopes and Fears” column, a rejuvenated interest in spending restraint was at the top of my list.

This clip from a recent interview summarizes the economic issues.

If you don’t want to watch the video, here are the three things to understand.

  1. Tax-financed spending is bad for prosperity.
  2. Debt-financed spending is bad for prosperity.
  3. Monetary-financed spending is bad for prosperity.

And if you understand those three things, then you realize that the real problem is spending.

At the risk of over-simplifying, taxes, borrowing, and printing money should be viewed as different ways of doing a bad thing.

Since I mentioned over-simplifying, I’ll close with a couple of observations that are somewhat contradictory.

  • First, I don’t worry very much about whether there is a surplus or a deficit in any particular year, but it is a good idea to have long-run fiscal balance (compared to the alternatives of financing the budget with borrowing or printing money).
  • Second, while taxes are the most appropriate way to finance spending, tax increases are a reckless and irresponsible option because we have so much evidence that politicians will respond with additional spending and additional debt.

Which brings us back to the main lesson, which is that spending is the problem and spending restraint is the solution.

Not just a solution. The only solution.

P.S. This video is a bit dated, but all of the economic analysis is still completely accurate.

Read Full Post »

I don’t worry much about budget deficits. Simply stated, it is far more important to focus on the overall burden of government spending.

To be sure, it is not a good idea to have too much debt-financed spending. But it’s also not a good idea to have too much tax-financed spending. Or too much spending financed by printing money.

Other people, however, do fixate on budget deficits. And I get drawn into those debates.

For instance, I wrote back in July that Biden was spouting nonsense when he claimed credit for a lower 2022 deficit. But some people may have been skeptical since I cited numbers from Brian Riedl and he works at the right-of-Center Manhattan Institute.

So let’s revisit this issue by citing some data from the middle-of-the-road Committee for a Responsible Federal Budget (CRFB). They crunched the numbers and estimated the impact, between 2021 and 2031, of policies that Biden has implemented since becoming president.

The net result: $4.8 trillion of additional debt.

By the way, this is in addition to all the debt that will be incurred because of policies that already existed when Biden took office.

If you want to keep score, the Congressional Budget Office projects additional debt of more than $15 trillion over the 2021-2031 period, so Biden is approximately responsible for about 30 percent of the additional red ink.

Some readers may be wondering how Biden’s 10-year numbers are so bad when the deficit actually declined in 2022.

But we need to look at the impact of policies that already existed at the end of 2021 compared to policies that Biden implemented in 2022.

As I explained back in May, the 2022 deficit was dropping simply because of all the temporary pandemic spending. To be more specific, Trump and Biden used the coronavirus as an excuse to add several trillion dollars of spending in 2020 and 2021.

That one-time orgy of spending largely ended in 2021, so that makes the 2022 numbers seem good by comparison.

Sort of like an alcoholic looking responsible for “only” doing 7 shots of vodka on Monday after doing 15 shots of vodka every day over the weekend.

If that’s not your favorite type of analogy, here’s another chart from the CRFB showing the real reason for the lower 2022 deficit.

I’ll close by reminding everyone that the real problem is not the additional $4.8 trillion of debt Biden has created.

That’s merely the symptom.

The ever-rising burden of government spending is America’s real challenge.

P.S. If you want to watch videos that address the growth-maximizing size of government, click herehereherehere, and here.

P.P.S. Surprisingly, the case for smaller government is bolstered by research from generally left-leaning international bureaucracies such as the OECDWorld BankECB, and IMF.

Read Full Post »

I don’t spend much time worrying about why the United States has a big budget deficit. I’m much more concerned about the fact that the federal government is too big and that it is spending too much.

Moreover, there’s plenty of evidence that we can quickly get rid of deficits with some long-overdue spending restraint. In other words, deal with the underlying disease of excessive government and the symptom of red ink goes away.

But since many people focus first and foremost on fiscal balance, let’s take a look at why budget surpluses at the turn of the century have turned into big budget deficits.

I’m motivated to address this issue because of this chart from Brian Riedl’s impressive collection. It shows spending increases are responsible for 97.5 percent of the shift.

Some of you may be wondering if the chart is accurate. I can easily imagine my friends on the left exclaiming, “What about the Bush tax cuts and the Trump tax cuts?!?”

Those tax cuts did happen, but they were mostly offset by Obama’s “fiscal cliff” tax increase and real bracket creep (the tax burden tends to increase over time since even small increases in economic growth will push households into higher tax brackets).

So the net result of all these factors is that there has been a very small reduction (0.2 percentage points) in tax revenue as a share of economic output.

Others of you may be wondering if the spending numbers may be exaggerated because of pandemic-related spending.

That is a fair question since the crowd in Washington used the opportunity to spend a couple of trillion dollars. But the silver lining to that dark cloud is that it was almost entirely one-time spending that took place in 2020 and 2021 (for what it’s worth, budget experts have mocked Biden’s claim of deficit reduction this year since it is simply a result of expiring emergency outlays).

There is some one-time spending in 2022. As noted in the chart, Biden’s reckless student loan bailout is a big chuck of the increase in “other mandatory spending.”

As such, I suppose I should say that higher spending is “only” responsible for 96.8 percent of today’s higher deficits, not 97.5 percent.

The bottom line is that all 21st-century presidents (and Congresses) have been big spenders.

P.S. According to the long-run forecast from the Congressional Budget Office, a bad situation will get even worse over the next 30 years. And more than 100 percent of that future decline will be the result of excessive spending (something that’s been true for many years).

Read Full Post »

As part of “European Fiscal Policy Week,” I’ve complained about bad Italian fiscal policy, bad Europe-wide fiscal policy, bad British fiscal policy, and also the unhelpful role of the European Union.

But I want to end the week on an optimistic note, so let’s take a look at Switzerland‘s spending cap.

Known as the “debt brake,” the rule was approved by 84.7 percent of voters back in 2001 and took effect with the 2003 fiscal year.

And if you want to know whether it has been successful, here’s a comparison of average spending increases before the debt brake and after the debt brake.

The above data comes directly from the database of the IMF’s World Economic Outlook.

There are some caveats, to be sure.

  • The IMF data cited above is not adjusted for inflation, though inflation has not been a problem in Switzerland.
  • The IMF numbers also show total government spending rather than just the outlays of the central government, but most cantons also have spending caps.

The bottom line is that Swiss fiscal policy dramatically improved after the spending cap took effect.

Switzerland’s Federal Finance Administration has a nice English-language description of the policy.

The debt brake is a simple mechanism for managing federal expenditure. …Expenditure is limited to the level of structural, i.e. cyclically adjusted, receipts. This allows for a steady expenditure trend and prevents a stop-and-go policy. …The debt brake has passed several tests since its introduction in 2003… The binding guidelines of the debt brake helped to swiftly balance the federal budget when it was introduced. The debt brake prevented the high tax receipts from the pre-2009 economically strong years from being used for additional expenditure. Instead, it was possible to build up surpluses and reduce debt. …s public finances are well positioned when compared internationally. Aside from the Confederation, most of the cantons have a debt brake too.

Here’s a chart from the report. It shows that debt is on a downward trajectory, especially when measured as a share of economic output (the right axis).

For what it’s worth, I’m glad the debt brake reduced debt, but I care more about controlling government spending. That being said, the Swiss spending cap also is a success on that basis.

The burden of spending as a share of GDP was increasing before the debt brake was approved. And since 2003, it’s been on a downward trajectory.

Here’s what Avenir Suisse, a Swiss think tank, wrote back in 2017.

Since the early 2000’s, Switzerland’s fiscal institutions have been successful in keeping the overall levels of taxation and spending at moderate levels. The country’s high fiscal strength is based on…Switzerland’s debt brake, a key institutional mechanism for managing public finances which subjects the Confederation’s fiscal policy to a binding rule…and contributes significantly to the country’s fiscal discipline. …Switzerland’s spending cap has helped the country avoid the fiscal crisis affecting so many other European nations. …The Swiss debt brake is the ideal model for other countries lacking fiscal discipline to embrace. …The Swiss debt brake’s most important contribution, however, cannot be measured in figures… In the early 1990s fiscal policy was oriented more towards the demands of the public sector… Today, however, the administration, the government and the parliaments believe it is self-evident that expenditures must develop in the medium term in line with revenue. Fiscal federalism, as an important element in the cantons, protects against overcrowding access to the tax side.

That last sentence deserves some elaboration. The authors are noting (“overcrowding access to the tax side”) that it is possible to increase spending by increasing taxes, but that’s not an easy option in Switzerland because voters can use direct democracy to reject tax hikes (as they have in the past).

P.S. The Debt Brake has an opt-out clause that allows more spending in an emergency. And, during the pandemic, spending did jump by more than 12 percent in just one year. But there’s also a claw-back provision that requires lawmakers to be extra frugal in subsequent years. And that policy seems to be successful. The big spending surge in 2020 was followed by two years of zero spending growth (with another year of no spending growth projected for 2023).

P.P.S. Look at this map if you want to see how much better Switzerland is than the rest of Europe.

P.P.P.S. Look at these charts if you want to see how Switzerland is doing better than the United States.

Read Full Post »

Older Posts »