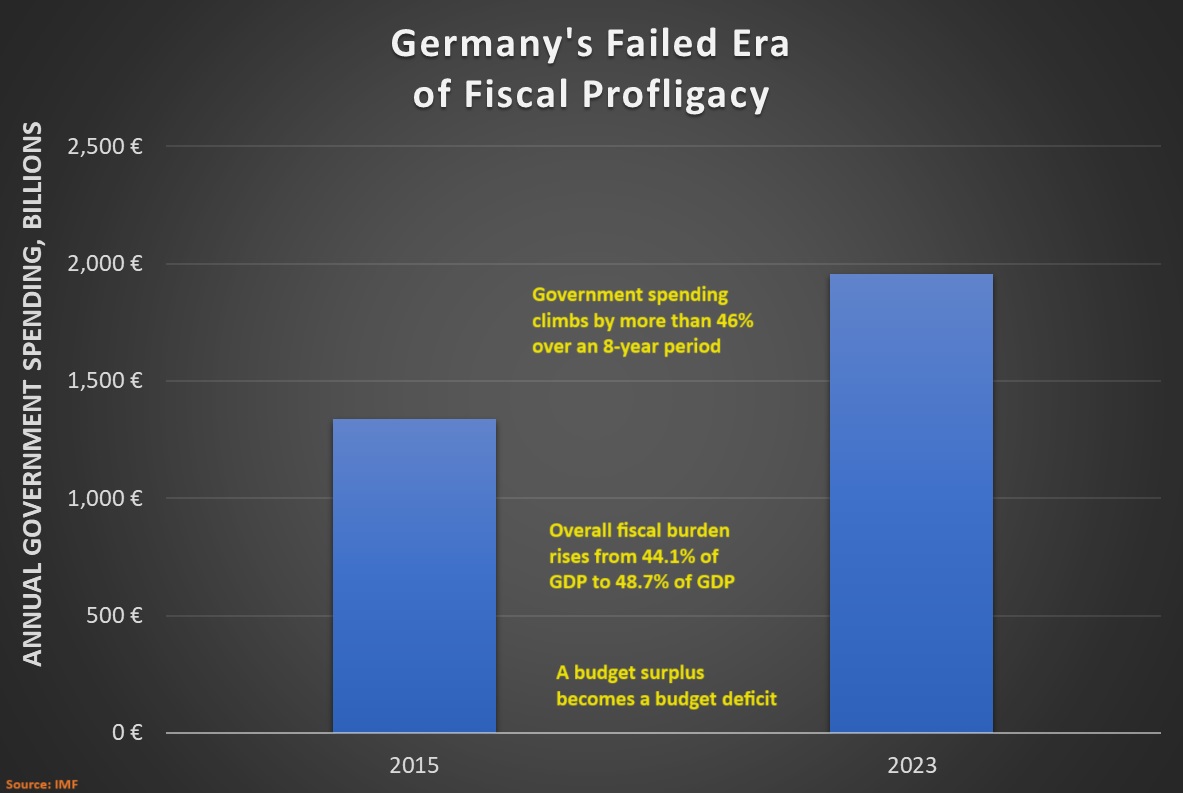
Just a few months ago, I wrote about Germany’s fiscal decay.
Over the past eight years, government spending has grown much faster than the private sector, thus violating the Golden Rule of fiscal policy.
Given the shift to bad policy in Germany, I was very interested to see that the New York Times has a report by Liz Alderman and Melissa Eddy that explains how Germany no longer is the economic engine in Europe.
Here are some excerpts.
Something extraordinary is happening to the European economy: Southern nations that nearly broke up the euro currency bloc during the financial crisis in 2012 are growing faster than Germany… In a reversal of fortunes, the laggards have become leaders. Greece, Spain and Portugal grew in 2023 more than twice as fast as the eurozone average. Italy was not far behind. …southern European countries made crucial changes that have attracted investors, revived growth and…reversed record-high unemployment. Governments cut red tape and corporate taxes to stimulate business and pushed through changes to their once-rigid labor markets, including making it easier for employers to hire and fire workers.
It’s encouraging to read about some pro-market reforms in Southern Europe.
It’s also encouraging that the New York Times seems to be acknowledging that free markets are the way to achieve more growth.
That being said, I’m not ready to declare that the PIGS (Portugal, Italy, Greece, and Spain) are the new role models for economic policy.
For instance, the NYT story is based on just one year of economic data. And I’ve warned that it is risky to draw big conclusions without seeing decades of evidence.
But a journey of a thousand miles begins with a first step. Given my interest in fiscal policy, I looked at the IMF data to see which countries have been most responsible over the past few years.
Lo and behold, Greece and Italy have been doing a decent job.
Three years of fiscal restraint may not seem like much, but it’s worth noting that the burden of government spending in Greece has declined by more than 10 percentage points of GDP.
And the spending burden in Italy has been reduced by nearly 7 percentage points of GDP.
Keep that up for 5-10 more years, and those countries could become Switzerland.
Do it for 10-20 years, and they can become Singapore or Taiwan.
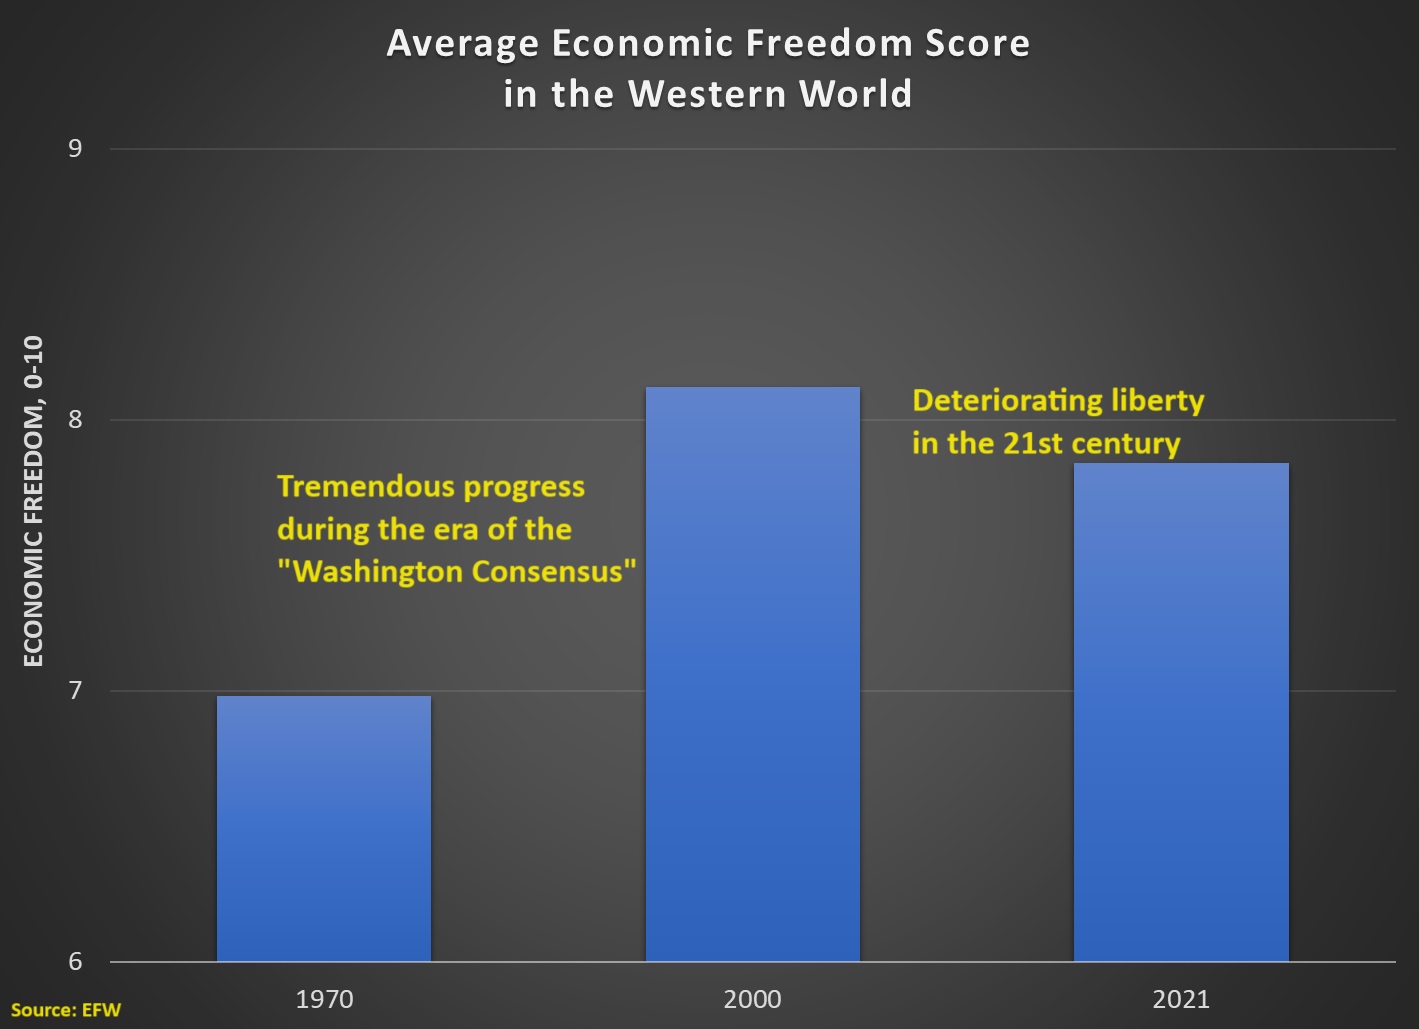
Sadly, here’s a more up-to-date chart showing that the loss of economic freedom is a problem for the entire western world (the advanced nations of North America, Western Europe, and the Pacific Rim).
As you can see, a big increase in economic liberty during the era of the “Washington Consensus” followed by a decline since the turn of the century.
Sadly, only three nations – Israel, South Korea, and Taiwan – improved their economic freedom scores between 2000 and 2021. Every other country declined.
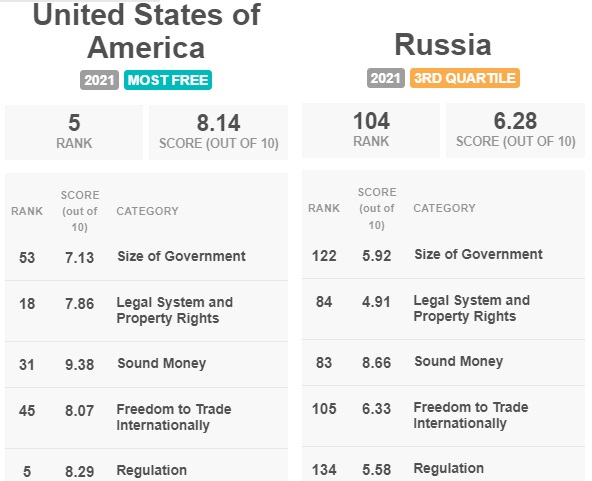
Moreover, it pains me to acknowledge that the United States suffered the biggest decline, dropping from 8.84 to 8.14.
The situation has become so bad that even the New York Times has noticed. Here are some excerpts from a story by Patricia Cohen.
More than 2,500 industrial policies were introduced last year, roughly three times the number in 2019, according to a new study. And most were imposed by the richest, most advanced economies — many of which could previously be counted on to criticize such tactics. …the trend is worrying some international leaders and economists who warn that such top-down economic interventions could end up slowing worldwide growth. …“There are different ways of shooting yourself in the foot,” M. Ayhan Kose, the deputy chief economist of the World Bank, said about the trend of rich countries pursuing industrial policies. “This is one way of doing it.” …The current wave of policies…is a stark contrast to the classic open markets, hands-off government ideology championed by the citadels of capitalism in recent decades. …After years of complaints about China’s subsidies of private and state-owned industries, the United States and Europe have increasingly copied Beijing’s playbook, undertaking multibillion-dollar industrial policies.
It’s rather strange that those mistakes were not mentioned. Or, perhaps not so strange since the reporter was talking to people at the annual meeting of the International Monetary Fund and World Bank. And the IMF this century has been controlled by political types who preach a dirigiste message of bigger government and higher taxes.
I’ll close by citing an additional passage that is very discordant.
…faith in the superiority of free-market policies was deeply shaken in recent years by a string of global jolts — the pandemic, supply chain meltdowns, soaring inflation and interest rates, Russia’s invasion of Ukraine, and rising tensions between the United States and China.
Why on earth did the reporter assert that faith in free enterprise was shaken by things that have nothing to do with capitalism?!?
To illustrate the importance of higher growth rates, I sometimes inform audiences that the United States today would be as poor as Mexico if the American economy had grown 1-percentage point slower over the past 130 years.
Needless to say, I then point out that we avoided that fate because we were fortunate enough to have decent economic policy.
But I also ask people to imagine how much richer we could be if we had great economic policy (sort of like Hong Kong before China’s crackdown) rather than decent economic policy.
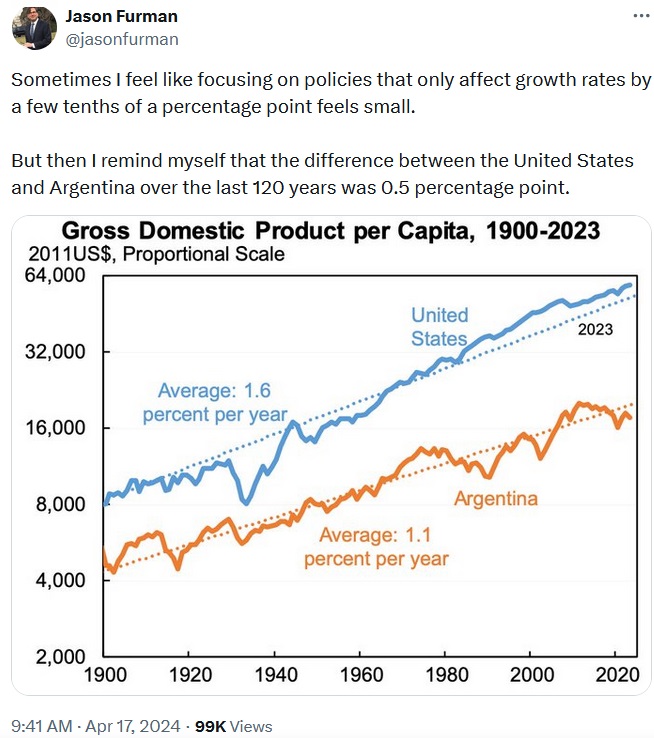
I now have a new example to share. Here’s a fascinating tweet from Jason Furman, who was Chairman of President Obama’s Council of Economic Advisers.
As you can see, it does not seem like there has been a huge difference in per-capita economic growth between the United States and Argentina. But it turns out that 0.5 percentage points actually is enormous when looking at 100-plus years of data.
If you want even more evidence about why 0.5 percentage points of growth is important, the Economistreported a few years ago that Argentina was the world’s worst-performing economy over the past century.
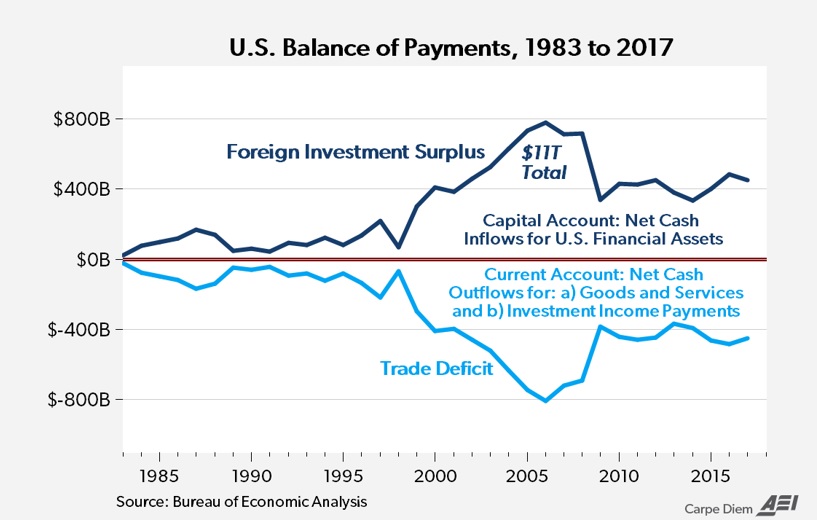
The most important thing to understand is that a trade deficit is the same thing as a financial account surplus (formerly known as a capital surplus), which is easy to understand when reviewing this graph.
And that type of surplus occurs when foreigners obtain dollars (by selling to Americans) and then decide that the best use of that money is to invest in the U.S. economy.
That’s generally a sign of a country’s economic strength.
Unfortunately, some people don’t grasp this relationship. And that leads them to supporting misguided ideas, such as protectionist trade restrictions.
But sometimes they want an indirect approach. For instance, one of Trump’s main advisers wants to weaken the dollar. In a column for Forbes, Christine McDaniel explains why this is a very foolish idea.
Robert Lighthizer, a former U.S. trade negotiator and a potential Treasury Secretary pick for a second Trump administration, is reportedly discussing ways to devalue the dollar in order to reduce the U.S. trade deficit. But…a devaluation is a cut in a nation’s standard of living. …Currency devaluation might sound like an appealing way to trim the trade deficit: All else equal, weakening the U.S. dollar would make U.S. exports cheaper, imports more expensive, and potentially reduce the trade deficit. But all other things don’t remain constant in such scenarios, and devaluing your own currency ends up having the opposite intended effect. It makes the economy less competitive and less efficient. … Anything the United States would gain through a devaluation in terms of cheaper exports, it would lose through its relatively pricier imports. Raw materials, intermediate goods, and capital goods comprise over half of U.S. imports. …So, either American consumers and businesses would face higher prices here at home, U.S. exports would become less competitive, or a bit of both. …Currency devaluation is a race to the bottom that you can’t win. You might be able to get quick hits on the board in the immediate term, but within months, those are inevitably followed by punishing penalties.
Catherine Rampell of the Washington Post makes similar points in her column.
Trump’s policy team is reportedly scheming to devalue the U.S. dollar. …Trump’s objective…is to boost U.S. exports and reduce imports. Basically, if a dollar buys, say, fewer euros or Japanese yen than it currently does, that makes U.S.-made products look a little cheaper and potentially more attractive to European and Japanese customers (among others). …That is, until you consider everything else that might happen if we deliberately tried to weaken our currency… how would Team Trump weaken our currency? That’s not totally clear. He might try to force the Federal Reserve to cut interest rates. …a weaker dollar would likely lead to higher prices for American consumers… So much for Trump’s pledge to vanquish inflation.
Both of these columns make good points, but they’re understating the main argument. What everyone needs to realize is that devaluation is inflation.
And presumably there’s no need nowadays to explain why inflation is bad, considering the damage caused when central banks decided to devalue currencies during the pandemic.
Moreover, it’s a bad policy that won’t work. Because once the Fed’s easy-money policy leads to rising prices, that will boost the cost of American-produced goods.
So the long-run impact may be a higher trade deficit.
P.S. Ms. Rampell makes another observation that deserves attention.
Deliberately weakening the dollar, or even attempting to, also threatens its role as the world’s “reserve currency.”
If you want to know more about that issue, click here.
Unfortunately, policy veered in the wrong direction, especially starting in the 1960s.
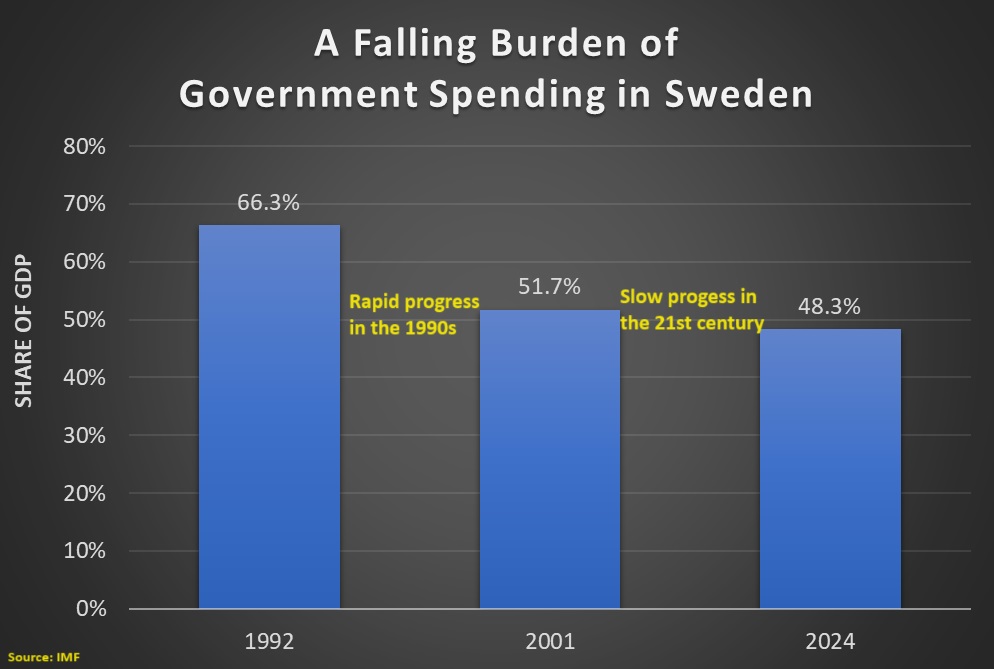
But things have gotten better in recent decades. Ten years ago, I wrote about a very impressive period of spending restraint in the 1990s. That was worthy of praise, but what’s noteworthy is there has been no backsliding.
Indeed, IMF data shows that Sweden has continued to make progress, albeit at a slow pace.
It goes without saying (but I’ll say it anyhow) that the burden of government spending is still far too high. But a government that consumes 48 percent of GDP is better than one that consumes 52 percent of GDP.
And 52 percent of GDP is far better than 66 percent of GDP.
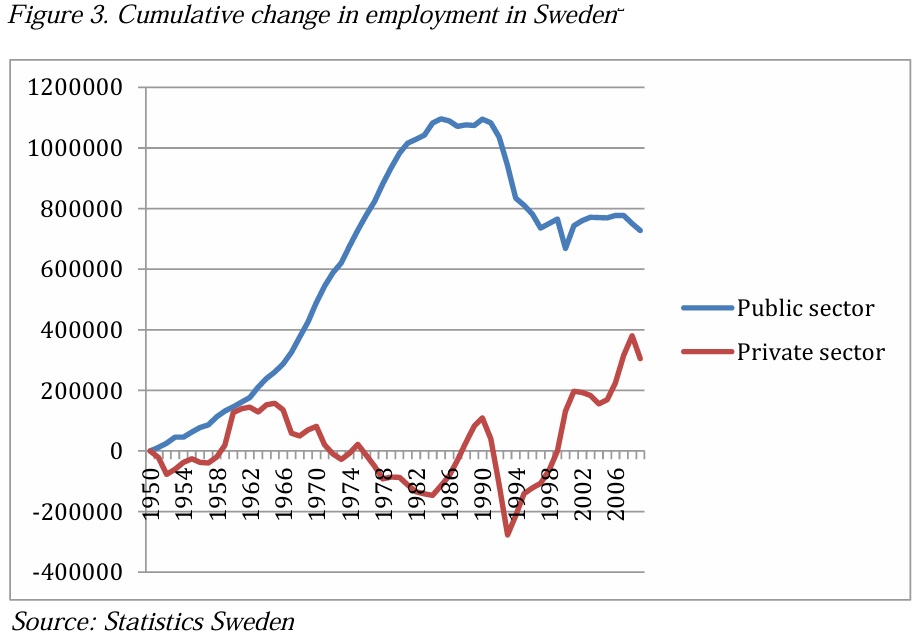
But Sweden has made progress is areas other than fiscal policy. Here are some excerpts from a 2014 report by Stefan Fölster and Johan Kreicbergs of the Reform Institute.
The seventies and eighties saw Sweden’s tax burden rise from an average European level to the world’s highest. The public sector expanded vastly. All facets of the welfare system were made more generous… Meanwhile, labour market regulation increased… Throughout these years, Swedes’ individual after-tax real income stagnated, private sector job creation ceased, and public debt spiralled higher. This culminated in a severe economic crisis in the early 1990s. …many Swedes began to react to the country’s lacklustre economic performance… At first, a few public utilities and the financial markets were opened to competition, and an important tax reform was implemented. …emphasis at the time was placed on reforms that opened significant sectors in the economy to greater competition. …significant changes were introduced to the tax system, macroeconomic policy framework, and social insurance system. …The results of this wave of reforms are remarkable. During the twenty years before 1995, GDP and productivity growth was substantially lower than in other countries. Virtually no net jobs were created in the private sector and government debt increased rapidly. Moreover, disposable income of Swedish households grew only in a very slowly. Since 1995, every aspect of the Swedish economy has changed. GDP and productivity growth have been higher than in comparable countries. Employment in the private sector has grown by more than 1% annually, while public sector employment has decreased. Public finances are now stronger than in most countries. Furthermore, median disposable income of Swedish households has grown 4 times faster after 1995, compared to the previous 20 years.
Here’s my favorite chart from the report.
It shows how the numbers of bureaucrats skyrocketed in the 1960s and 1970s, while jobs in the economy’s productive sector languished.
As a result of reforms, however, the number of bureaucrats has decline and jobs in the private sector have increased.
The net effect of all the reforms – lower tax rates, reduced spending burden, deregulation, etc – has been very positive.
But it’s better than people think. And its economic history shows that bad policy lowers living standards and that good reforms improve living standards.
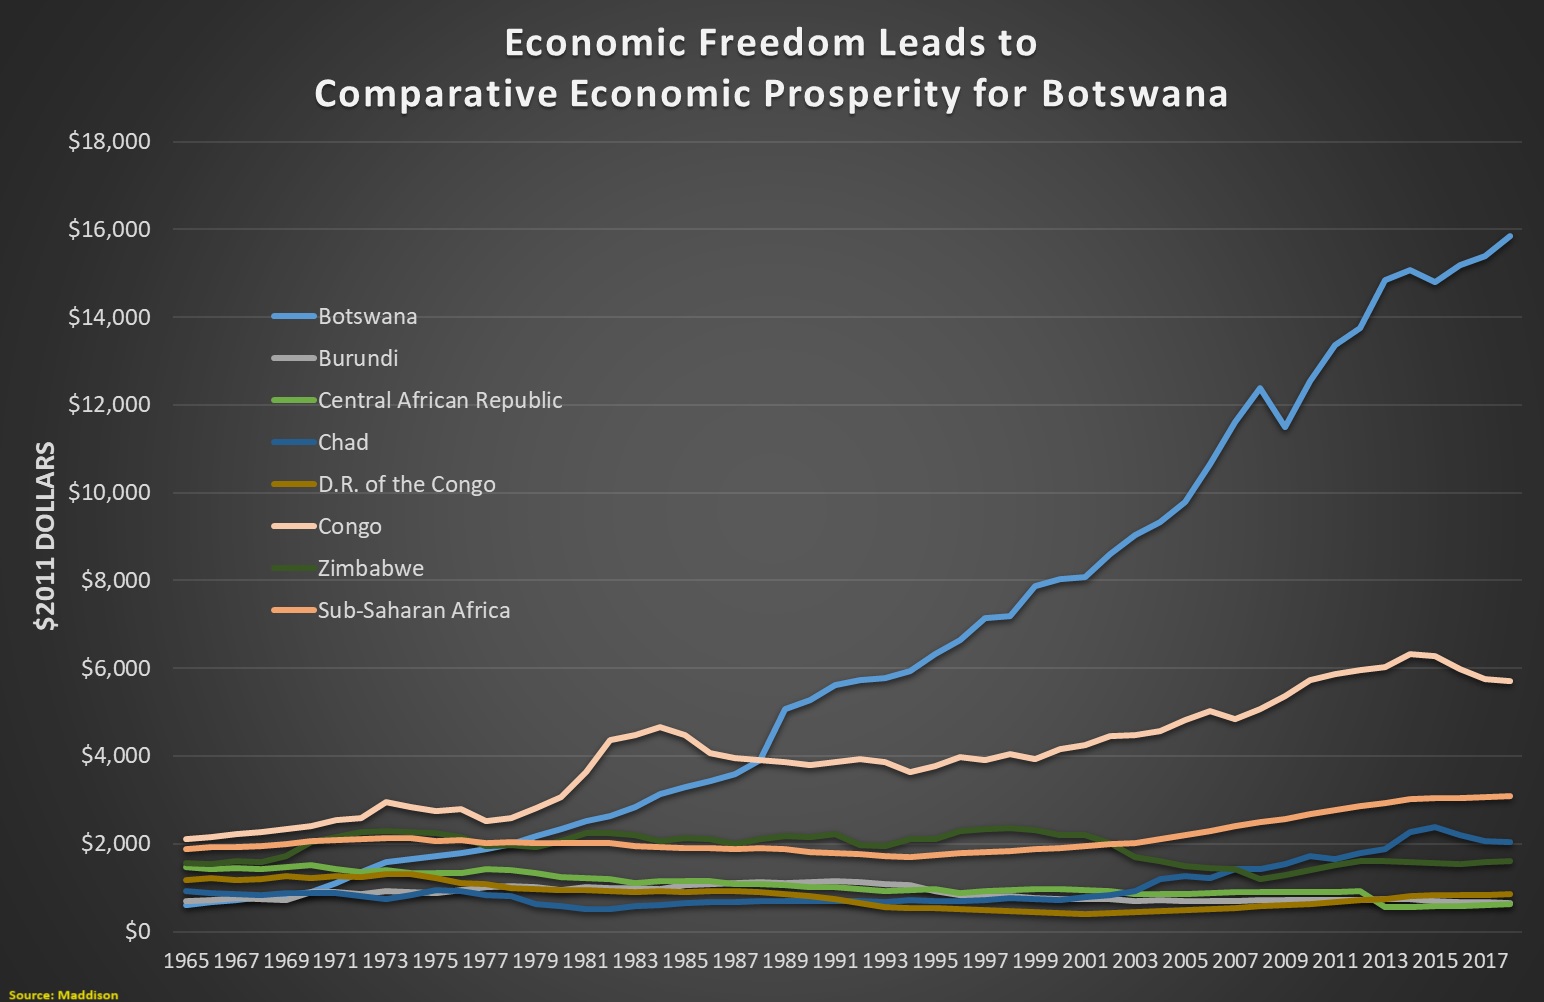
I wrote about Botswana yesterday, but focused on the narrow issue of how some of that nation’s leaders dunked on virtue-signalling politicians in Germany and the United Kingdom.
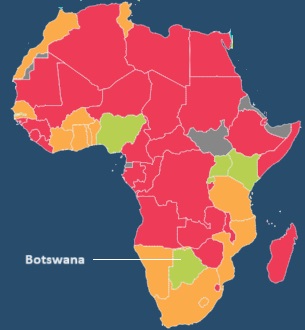
But I did share a chart about how Botswana has out-performed other African nations thanks to more economic liberty.
How much more economic liberty? As you can see from the map, Botswana is one of only three nations is sub-Saharan Africa to be in the second quartile (green) for economic liberty according the Fraser Institute’s Economic Freedom of the World.
Being in the second quartile normally is nothing to brag about. Indeed, I criticize countries such as Greece, Italy, and France for being in that group.
But almost every other African country does worse. A few are in the third quartile (orange) and most are in the fourth and last quartile (red).
Does Botswana reap any benefits as a result of having the highest level of economic freedom in Africa (other than a couple of small island nations)?
Let’s update the chart I shared yesterday. Here are the new numbers, which include about 10 more years of economic data. As you can see, Botswana is still the continent’s big success story.
Let’s look at some analysis about Botswana’s economic policy.
We’ll start with some excerpts from a column that Marian Tupy wrote for CapX back in 2020.
Another success story that speaks to the universal applicability and adaptability of classical liberal principles is Botswana. While by no means perfect, Botswana has outperformed the rest of Africa economically… In 1966, when the Bechuanaland Protectorate gained independence from Britain, GDP per capita was just amounted to $518 a year. By 2018, it stood at $8,031 – an increase of 1,450%. Over the same period, the global average rose 136%, from $4,625 to $10,894. Put differently, Botswana’s economy grew 10 times faster than the rest of the world. The country’s economy is even more impressive compared to its immediate neighbors. Between 1966 and 2018, South Africa’s GDP per capita rose 32%, from $5,631 to $7,434, and Zimbabwe’s just 35%, from $981 to a meagre $1,322. …for much of its independence Botswana was, according to the Economic Freedom of the World report, one of Africa’s most economically free countries. While many other nations embraced some form of socialism, Botswana was, broadly speaking, capitalist.
And here are some excerpts from an article published by the Foundation for Economic Education in 2018.
Authored by Luis Pablo de la Horra, it reaches similar conclusions.
Whereas Asia has experienced tremendous economic growth, Africa is the continent that has benefited the least from global capitalism. …Despite Africa’s general economic underdevelopment, some countries have attained relatively-high levels of economic growth and prosperity. …Botswana gained independence from Britain in 1966. At the time, Botswana was an extremely poor country. …Today, Botswana has the highest income per capita (adjusted for purchasing power) of the region, comparable to countries like Costa Rica or Mexico. Economic growth in Botswana has been inclusive: the share of people living in poverty (i.e., with less than $1.90 a day) has declined dramatically, moving from 34.8 percent of the population in 1993 to 18.2 percent in 2009. Poverty levels are expected to fall even further, declining to 10.6 percent in 2019. …How did Botswana manage to get out of the poverty trap? Or put in another way, what differentiates Botswana from its less developed neighbors like Zimbabwe or Zambia? …Botswana is the second freest economy in Africa (only surpassed by Mauritius). It has a sensible regulatory environment and a reasonable rule of law. …In addition, trade barriers are relatively low while successive governments have managed to keep public finances under control.
Yesterday’s column was entitled “Great Moments in Botswana Government,” but ranking in the second quartile for economic liberty means today’s column is merely labeled as “Good Moments in Botswana Government.”
P.S. That being said, good is better than bad. To learn more about Botswana’s relative success, people should watch this video I shared in 2018.
P.P.S. International bureaucracies such as the OECD and IMF are giving terrible advice to African nations.
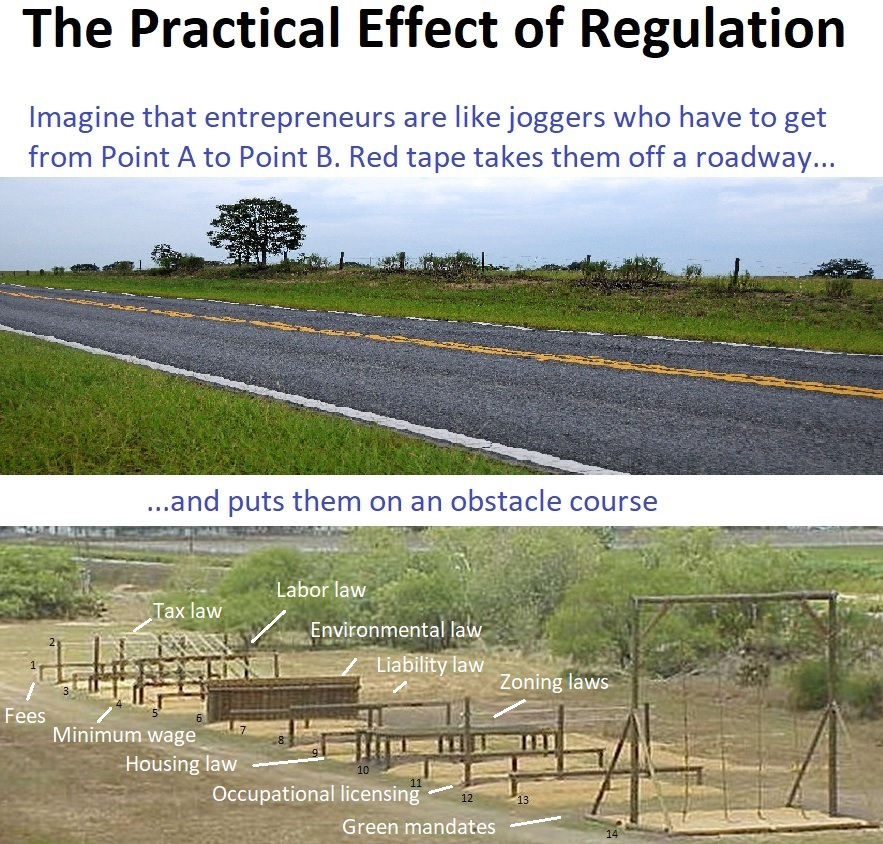
Sensible regulation requires cost-benefit analysis. In other words, do the positive effects of a government intervention outweigh the negative effects?
For instance, a nationwide, 5-miles-per-hour speed limit definitely would reduce traffic fatalities, but lawmakers fortunately don’t impose that kind of rule because it would be absurdly costly.
And since the scholarly research shows a clear link between health and wealth, it’s possible that some (supposedly) pro-safety regulations may wind up leading to a net loss of life.
Other regulations may not have that deadly effect, but they can still be bad news because they increase costs with no concomitant benefits.
For an example, let’s go back more than 20 years to look at an academic study on dentistry. The authors, Morris M. Kleiner and Robert T. Kudrle, found that red tape was not good news for consumers.
Here are some excerpts.
We have analyzed the impact of stricter occupational licensing requirements on economic outcomes, dental prices, and earnings using dental records of the consumers of these services. …we sketched a model linking regulation to the flow of new dentists as well as to quality and prices. …Alternative multivariate statistical models were used to test the impact of more restrictive licensing provisions, first on dental outcomes and then on the prices of dental service prices and practitioner earnings. …we are able to provide some evidence on how tougher dental regulation reduces the flow of dentists to the states over time. We also show that stricter regulation raises prices, but has no effect on untreated deterioration. …more stringent regulation does not appear to affect some indirect measures of service quality, such as lower malpractice premiums or fewer patient complaints. …Our multivariate estimates show that increased licensing restrictiveness did not improve dental health, but it did raise the prices of basic dental services. Further, using several tests for the robustness of our estimates, we found that the states with more restrictive standards provided no significantly greater benefits in terms of lower cost of untreated dental disease. Our estimates…show that more regulated states have somewhat higher dental prices. …Consequently, moving toward more restrictive policies that limit customer access to these services could reduce the welfare of consumers. …To the extent that states are considering a reduction in the pass rate on dental exams or making it more difficult for out of state practitioners to enter, our analysis suggests that there would be no gains to consumers in terms of overall dental health.
This flowchart from the study illustrates what the authors were trying to measure.
The bottom line is that we have yet another case study (for others, see here, here, here, here, here, here, here, here, here, and here) of red tape being bad news.
P.S. In recent decades, the U.S.A. has had two presidents (here and here) that pushed for less red tape.
In 2021, I shared a cartoon strip about a worker blaming capitalism after losing his job following an increase in the minimum wage.
One month ago, I shared a meme with a similar message. It showed the European Central Bank investigating supposedly mysterious price increases when the ECB’s bad monetary policy obviously deserves the blame.
Today, let’s look at another example of free enterprise being blamed for problems caused by government.
Heather Long of the Washington Postopines about young people not being big fans of free markets. Here’s some of what she wrote.
…whyAmericans under 40 are so disillusioned with capitalism. …Young people in America have come of age during the Great Recession, the sluggish recovery that followed and then the coronavirus pandemic. Unemployment has been 10 percent or higher twice in the past 15 years. …shore up Social Security. …Young people have seen the headlines that, if nothing changes, Social Security will start having to reduce benefits in 2034. …a better way to ensure that Social Security will be there for younger generations is to raise taxes slightly on corporations and the wealthy. …Young Americans have had a harsh introduction to capitalism. …a wise place to start would be to give workers a secure retirement again, starting with Social Security.
There are two major flaws in her analysis.
First, the 2008 financial crisis was not the fault of capitalism. It was bad monetary policy and foolish Fannie Mae/Freddie Mac subsidies. And while I don’t particularly blame government for the pandemic, it also would be absurd to blame capitalism for the accompanying economic troubles.
Second, it’s even more absurd to assert that Social Security is good for young people. Those are the people who are getting a terrible deal from the program. And even if young people aren’t directly hit by the author’s proposed tax increases, they will indirectly suffer as the economy gets weaker.
Since Ms. Long was writing an opinion column, I reckon we can’t say that her piece is an example of media bias. But she deserves a booby prize for poor analysis.
The good news is that there is very little risk that President’s new budget – which is very similar to his previousbudgets – will be approved by Congress.
The bad news is that his budget is filled with terrible policy. Big expansions in the burden of spending and big increases in tax rates.
At the risk of understatement, the economic consequences of those policies would be unfortunate.
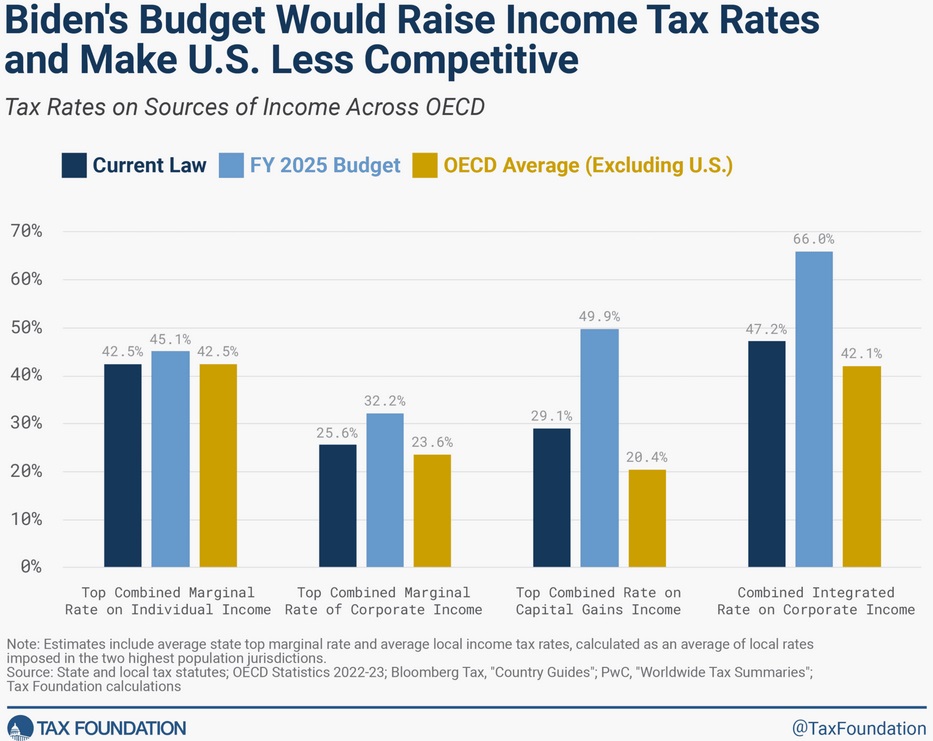
Given my interest in competitiveness, I think this visual from the Tax Foundation is the most important thing to understand. Biden wants tax rates in the United States to go from dark blue to light blue.
What makes this visual so disappointing is when you compare tax rates in the United States to other industrialized nations.
Tax rates in America already are high compared to those other countries, especially when looking at the taxation of saving and investment.
But the most shocking results are when you compare tax rates in other nations to Biden’s proposed tax rates. The United States would be shooting itself in the foot.
Given those terrible policies, this set of numbers from the Tax Foundation is hardly a surprise. Government would get more money and households would lose money.
I’ll close by observing that the Tax Foundation’s model is based on how higher tax rates discourage productive behavior. And there’s lots of academic evidence to support that approach.
As far as I know, though, the Tax Foundation does not quantify or estimate the economic damage from higher spending. So the actual consequences of Biden’s proposed budget surely would be even worse (the case for smaller government is bolstered by research from the Congressional Budget Office, as well as from generally left-leaning international bureaucracies such as the OECD, World Bank, ECB, and IMF).
Today, I’m going to write about a do-it-yourself budget from the American Enterprise Institute. But I’m not going to bother to share my results because I think the model has a fatal flaw.
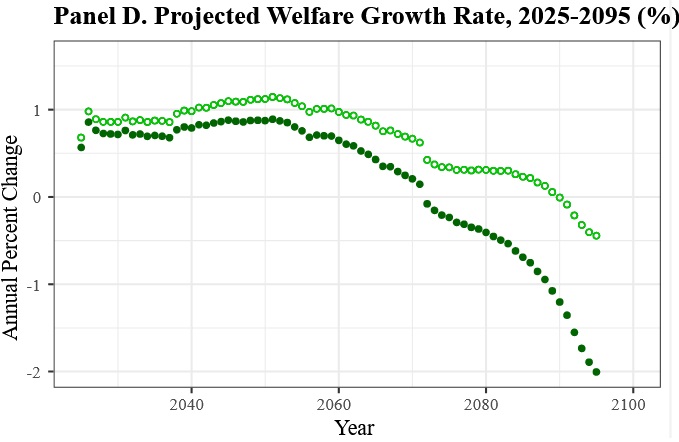
To illustrate, here is the model’s baseline estimate for national well-being (in this case, “welfare” refers to the overall prosperity of the nation rather than redistribution spending). As you can see, the model assumes that national well-being eventually begins to shrink if we leave government policy on autopilot.
Because the burden of government spending is projected to dramatically increase in coming decades, I don’t have any problem with the assumption that living standards will begin to decline.
After all, if America becomes a European-style welfare state, it’s perfectly reasonable to expect European-style economic malaise.
But here’s where things go awry. To show how the model is messed up, I made these two choices.
The biggest-possible increase in income taxes.
The biggest-possible increase in payroll taxes.
I then clicked “run model” and here are the results. In every single year, it shows that national well-being improves with these two big tax increases.
Before explaining how and why this is wrong, here is an explanation of the model’s methodology.
In our October 2023 working paper, we…explain, justify, and show the results of our macroeconomic projection model of the U.S. economy and federal budget. …As a companion to our working paper, we have developed a dashboard which allows users to adjust assumptions and implement their own policies to reduce future levels of debt and improve welfare for generations to come. By adjusting the sliders on the left-hand side of the screen, users can, e.g., increase income taxes, increase levels of investment, reduce Social Security benefits, and change projected health care elasticities. …Users can adjust various assumptions or implement policy changes using the sliders on the left, then click “Run Model” to produce new projections using this new set of assumptions. For example, to reduce deficits, one could increase income and Social Security payroll tax rates by one percentage point each, cut non-health federal spending by ten percent, and increase the average Social Security replacement rate by five percentage points. New projections after making these changes are shown… The solid circles continue to show baseline assumptions while the empty circles represent outcomes under the new set of assumptions.
So why does the modal produce screwy results?
Here’s what you need to know.
…welfare improves as, in our model (based on assumptions made by CBO), deficits crowd out investment, reduce capital, and slow economic growth, so efforts to reduce the deficit will generally improve welfare.
There is nothing wrong with that bit of analysis, but it’s fatally incomplete.
To put it in simple terms, projecting the economy based solely on what happens to deficits and debt is like predicting the outcome of a baseball game by looking at what happened in the 2nd inning. That’s part of the answer, but grossly inadequate.
Which is an analogy I should have used in this video from 2009, which explains that spending is the problem, not red ink.
If you don’t want to spend a few minutes with the video, this short column tells you why fixating solely on deficits leads to absurd results. And this column is a must-read for people who think tax-financed spending somehow is less harmful than debt-financed spending.
Our fourth item is the government version of the Field of Dreams.
Per tradition, I’ve saved the best for last.
I’ve written manyseriouscolumns about the failure and absurdity of anti-money laundering laws. Basically, politicians have created a system where banks and other financial institutions are compelled to spy on customers (supposedly to fight crime, but such policies are utterly ineffective).
Anyhow, the Australian government decided to expand these AML laws and rules by requiring banks to ask customers to justify large bank withdrawals. So this clever fellow recorded some amusing reasons.
For today’s column, let’s look at some additional evidence.
We’ll start with some findings from a 2019 study published by the Australian Bureau of Statistics. The researchers found that failure is a necessary feature of a market economy.
Here are some excerpts from the abstract.
We examine the components of this productivity growth by estimating the contribution of entry, exit, within-firm growth and re-allocation to productivity growth in Australia in the period 2002- 2013. We use an experimental linked dataset of 10 million workers across 1.5 million firms. …We find that firm entry and exit are by far the largest contributors to productivity growth across all industries. In general, firm exit contributes positively to productivity growth whereas firm entry generally contributes negatively. This would suggest that policies which facilitate firm entry and exit are likely to help achieve increased productivity gains. Policies which provide large advantages to incumbent firms are likely to detract from productivity growth.
That’s a recipe for zombie firms and stagnation. This is why it is good news that the vast majority of Fortune 500 companies in the U.S. lost ground over a 60-year period.
Let’s now look at another study, this one published by the National Bureau of Economic Research. James Feigenbaum and Daniel P. Gross looked at how the economy adapted after massive job losses in the telephone industry.
Using panel variation in the local adoption of mechanical switching and population outcomes from complete count census data from 1910 to 1940, we show that dial cutovers presented a large negative shock to local labor demand for young, white, American-born women, with the number of young operators dropping by upwards of 80%—a near-total collapse in entry-level hiring in one of the country’s largest occupations for young women—and accordingly around 2% of jobs for this group being permanently replaced by machines, essentially at the flip of a switch. These 2% of jobs represented entry-level opportunities for several times as many young women, and the fear was that its automation might choke off future generations from the labor force. We find that this shock did not reduce future cohorts’ employment rates. It appears that comparable middle-skill office jobs and some lower-skill service sector jobs absorbed future generations of young workers workers, and did so fairly quickly, with women of only the youngest ages on average ending up in lower-paying occupations than they would have been in otherwise. The adverse consequences of automation were concentrated in incumbent telephone operators, who were subsequently less likely to be working, and conditional on working, more likely to be in lower-paying occupations—but even then, the magnitudes of these impacts were relatively modest.
In other words, “creative” generally outweighs “destruction.” Which was one of Joseph Schumpeter’s main points when he explained the concept last century.
Speaking of which, let’s close by looking at Professor Richard Ebeling’s column about Schumpeter.
Schumpeter…defined “the entrepreneur” as the central and dynamic figure of the market process who introduces transformative innovations that radically change the forms and directions of economic activity. …Looking over the nearly century and a half from the start of the nineteenth century to his own time…, Schumpeter pointed to the dramatic increase in the output of goods and services, including new and better goods that were not available to even the wealthiest of kings and princes in, say, 1790 or 1810. …In doing this, capitalism was also serving as a great “leveler” that was raising the economic well-being of all, while also narrowing the differences in the quality of life between “the rich” and the rest. …The “culture of capitalism,” Schumpeter said, also had eliminated political privileges and favoritism and had increasingly fostered equality before the law for all, including women and religious and ethnic minorities. Capitalism replaced primitive tribal and social collectivism with an ethic and a politics of individualism that established the ideal of individual rights, private property, and human association based on freedom of contract. …Fortunately, even in the face of the regulatory and redistributive state, the market economy has still possessed enough competitive openness and profit-earning opportunity that continuing prosperity has been a reality.
By the way, Schumpeter was actually pessimistic about the survival of capitalism. He feared that it was just a matter of time before supporters of statism would get the upper hand.
For all intents and purposes, he was describing the tension in my 16th Theorem of Government. In other words, will politicians give the economy enough “breathing room” to deliver more prosperity?
Okay, I’ll admit those bullet points are an oversimplification.
But there’s a reason for that.
Our book does show how we got into our current fiscal mess (because of too much spending).
And it shows why things will get worse in the future if we leave government on autopilot (because of too much spending).
Moreover, we have lots of evidence for the right way to avert a fiscal disaster. Richard Rahn wrote about our book in his Washington Times column.
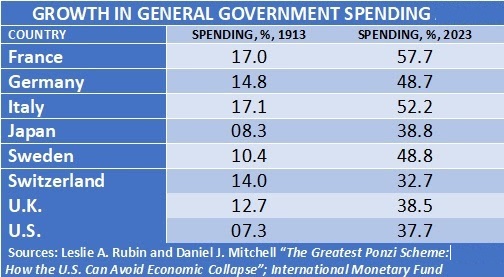
In a new book, “The Greatest Ponzi Scheme: How the U.S. Can Avoid Economic Collapse,” Leslie A. Rubin and Daniel J. Mitchell provide a well-written and informative history of how much of the world and particularly the United States managed to get into the current fiscal mess. …British Prime Minister Margaret Thatcher said it best: “The problem with socialism is that you eventually run out of other people’s money.” Before World War I, government spending in almost every country was a small share of gross domestic product. …In the United States, things began to change in the 1930s with the development of welfare programs… Mr. Rubin and Mr. Mitchell review many of the so-called entitlement programs that are the real budget busters. The payments from these programs consistently grow faster than the economy or tax revenue and now consume the bulk of the federal budget. Anyone who can do basic math can quickly understand the problem. When a country reaches the point where it is borrowing just to pay interest on the debt, game over.
That’s the bad news in the book. And Richard captures some of that bad news with this table showing how the burden of government spending has significantly increased over the past 100-plus years.
But our book also has good news, as Richard explains.
Fortunately, there are a number of success stories that serve as role models of what to do. …Switzerland is perhaps the best model for fiscal responsibility in a highly developed country, in that for the most part the Swiss keep government spending growing no more rapidly than the private sector.
As you might expect, I like his conclusion.
Mr. Rubin and Mr. Mitchell have done a great service in providing a highly understandable book, outlining the disaster about to engulf us if we do not change quickly, but equally important, a road map for getting out. Every policymaker and concerned citizen ought to buy this book and refer to it often — an economic bible of sin and salvation.
I want you to buy the book, but if you are a regular reader of this column, you already know the only practical way of averting a fiscal crisis in the United States. Simply follow the Golden Rule. And, because of its spending cap, Switzerland is a good role model.
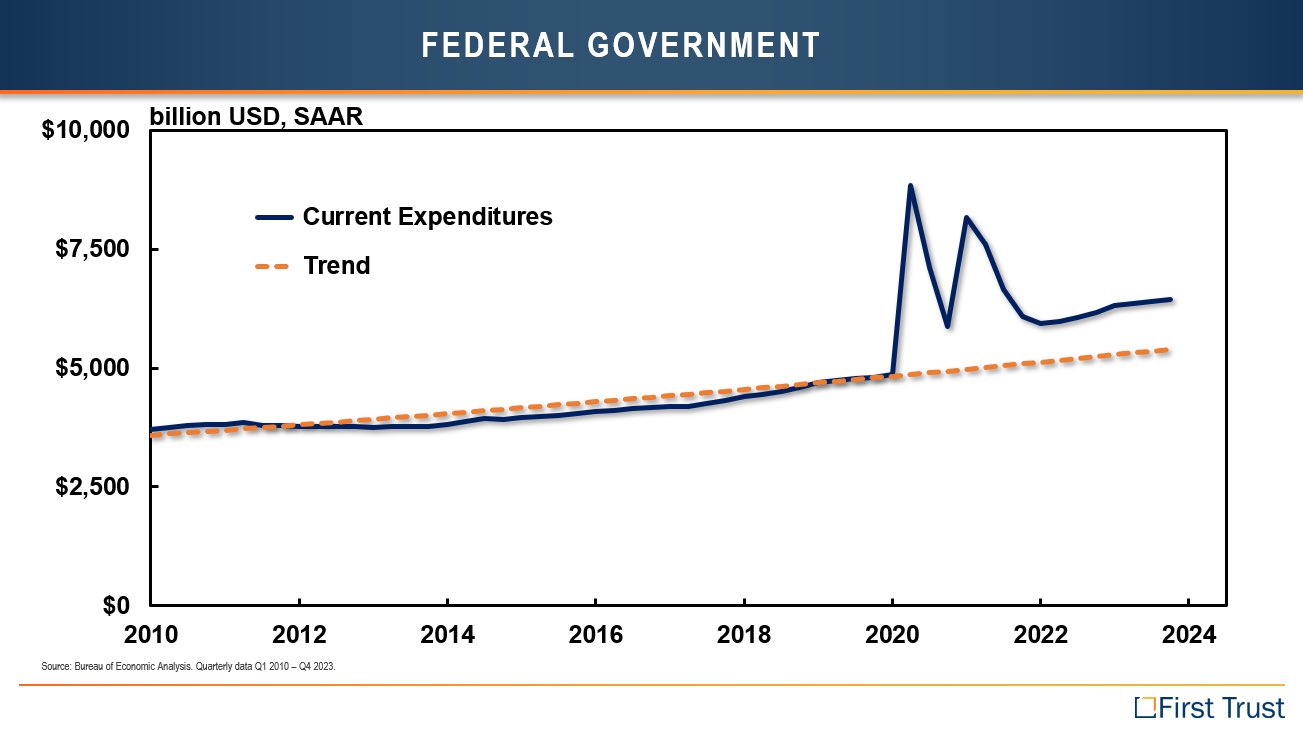
Today, let’s look at how Joe Biden’s new budget will make that bad problem even worse.
I’m going to start with two charts. The first one shows that government spending in recent years has climbed above the trendline (and the trendline showed excessive spending growth even before the fiscal orgy that took place under Trump and Biden).
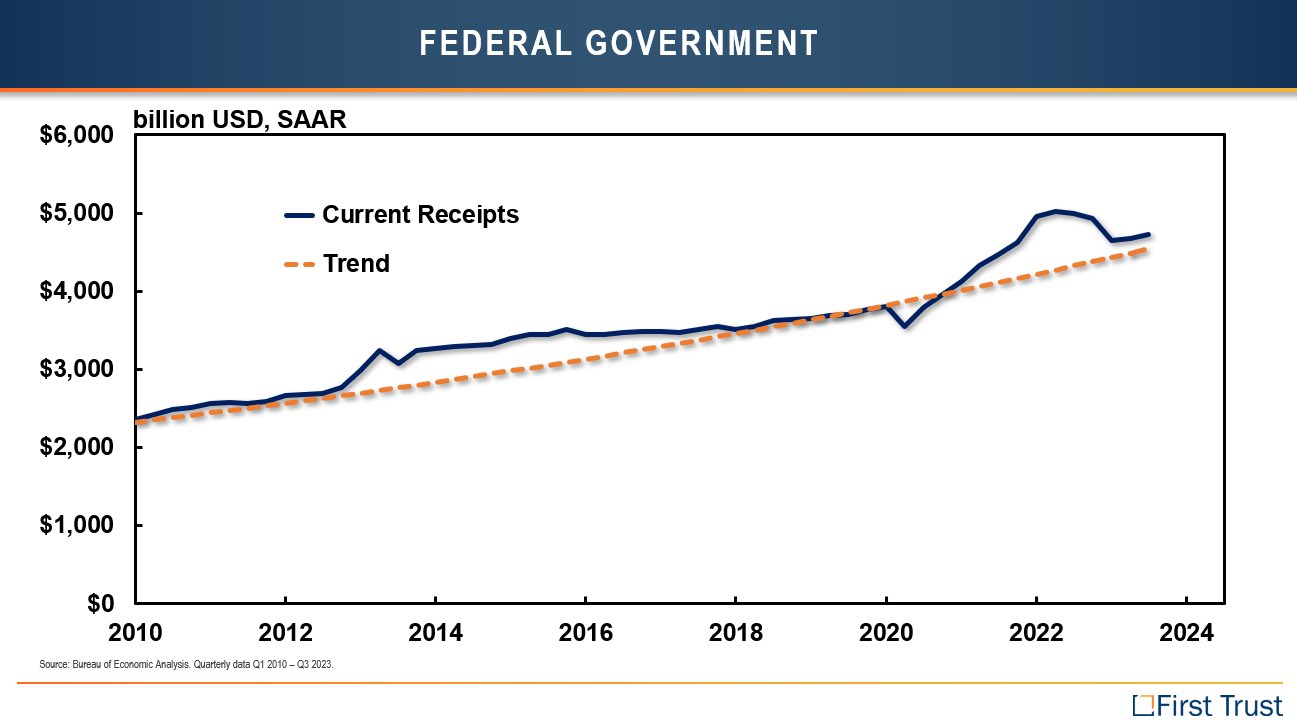
The second chart shows that taxes also are above the trendline.
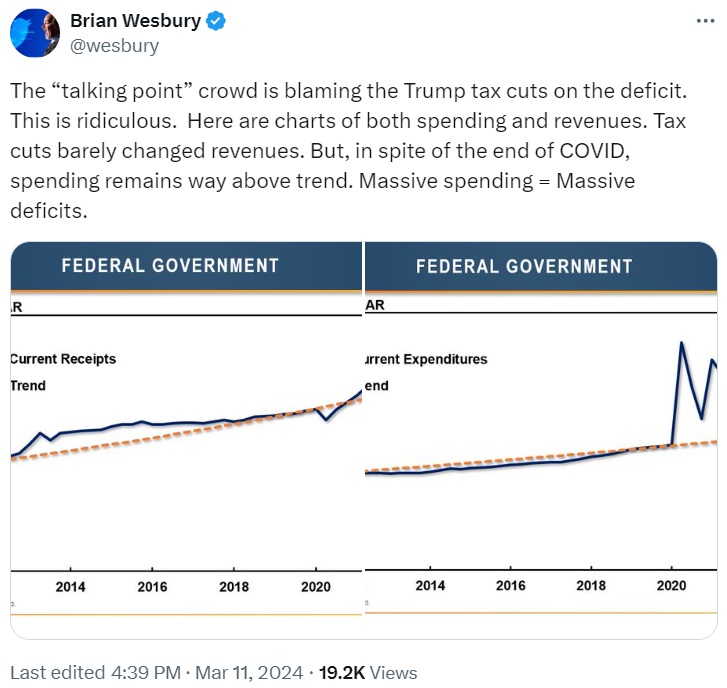
These two charts come from a tweet by Brian Wesbury.
And they basically tell you everything we need to know about our current fiscal mess.
But there’s more bad news to share.
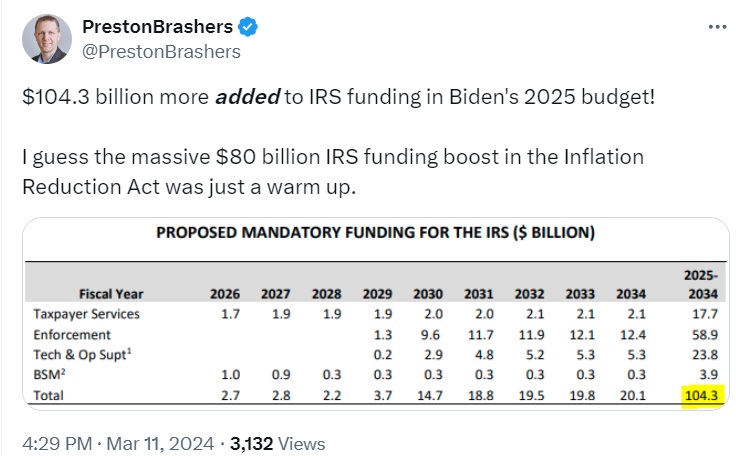
Next, here’s a tweet from Preston Brashers about Biden’s plan to further bloat the IRS budget in order to have more audits of families and small businesses.
Biden’s proposal is based on the notion that a massive expansion of the IRS will magically generate additional tax revenue to finance ever-larger government.
History tells us that this perpetual-motion-machine approach won’t work.
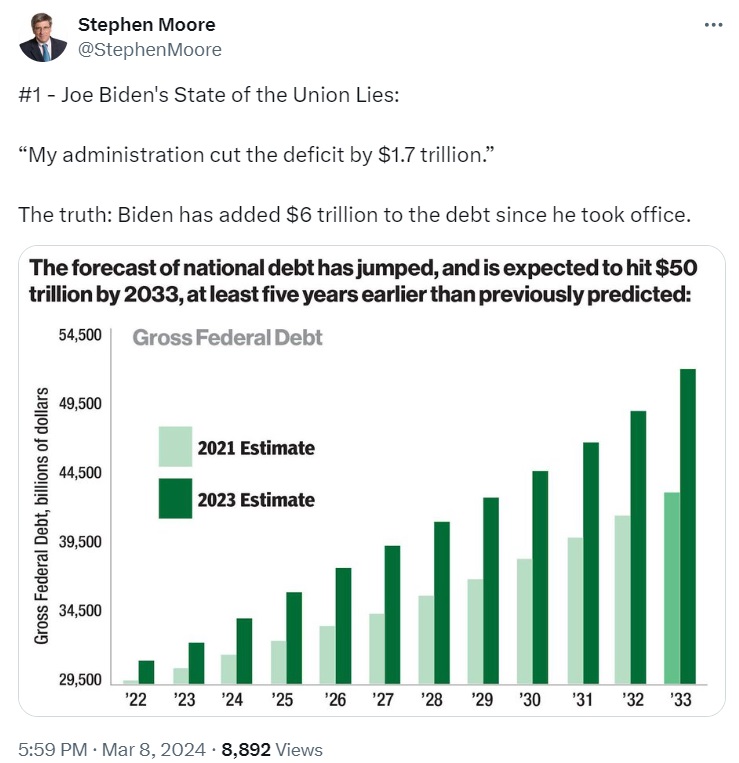
Last but not least, we have this tweet from Steven Moore about Biden’s preposterous claim that he has reduced red ink.
All politicians lie. They are not good people. But Biden is an extreme example.
Here’s what really happened: Yes, the deficit fell in 2022, but only because there was a massive amount of one-time pandemic spending in 2021.
So I finally decided to do something about it. Or, to be more accurate, I said yes when my friend Les Rubin decided we should co-author a book about America’s fiscal crisis.
We didn’t write this book to become rich. If we actually sell enough copies to earn royalties, I’ll be delighted.
Not because of the money, but rather because that will actually show there’s some interest in saving the country from fiscal decay.
To help introduce the book, Les and I just wrote a column for the Foundation for Economic Education. Here are some highlights.
The United States is in fiscal trouble. The burden of government spending has increased by nearly $3 trillion over the past 10 years—nearly doubling in just one decade! And that…is bad news whether the spending is financed by taxes, borrowing, or money printing. To make matters worse, the burden of spending will get even heavier in the coming decades, mostly because politicians have saddled the nation with poorly designed entitlement programs… To raise the alarm, we’ve written a book, The Greatest Ponzi Scheme on Earth, that explains America’s fiscal mess. It explains how we…will suffer an economic crisis if we leave policy on autopilot. That’s the bad news. The good news is that our book shows that the…reasonable solution…is for government spending to grow slower than the economy. …Politicians could still increase spending, but only by modest amounts. Maybe 2 percent annual spending increases rather than the 7+ percent spending increases that we’ve seen over the past 10 years. In our book, we show examples of countries that have long-run spending restraint (super-successful economies such as Switzerland and Singapore). But we also show examples of nations that dug themselves out of fiscal trouble merely by having multi-year periods of spending restraint. And if countries such as New Zealand, Canada, and Sweden can address their fiscal problems, surely we should demand the same from the crowd in Washington.
As you might expect, we also show how countries like Greece got in trouble.
We also describe the entitlement reforms that are needed to save America from that fate.
I’ve never used my daily columns to raise money for my group, the Center for Freedom and Prosperity, but peddling the book is different because it will be a tangible and mutually beneficial exchange. Isn’t the free market wonderful?
This short video from the Fraser Institute is a good tutorial on the topic.
The core message is that entrepreneurs improve our lives by coming up with new ideas, new technologies, and new products.
That’s the good news.
The bad news is that this process unavoidably can have a very negative effect on sectors of the economy that get displaced.
That being said, the bad news for people like blacksmiths and carriage makers hopefully is only temporary since the economy creates other jobs.
This is a point I’ve made when looking at global trade, but the lesson would apply even if the United States was the world’s only nation.
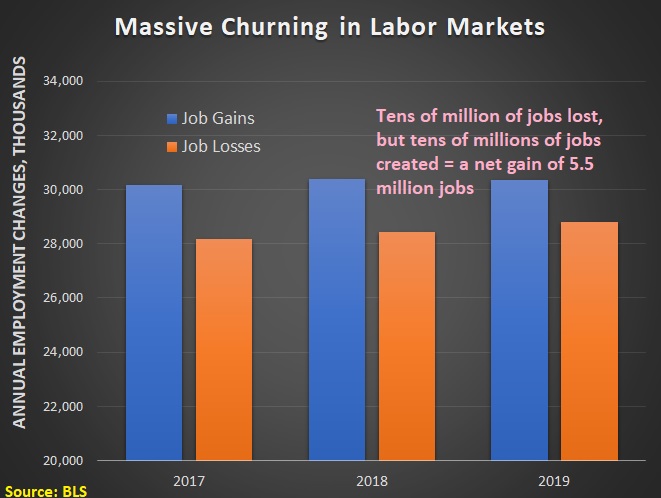
For today’s column, I don’t need to provide any additional analysis. Instead, I’m simply going to share four tweets that illustrate the power of creative destruction.
First, I’ve explained that big companies can get toppled. This tweet shows have fast it can happen.
Mar 1998: "How Yahoo! Won the Search Wars" (Fortune) Sep 1998: Google founded
Feb 2004: Facebook founded Feb 2007: "Will MySpace ever lose its monopoly?" (Guardian)
Jun 2007: iPhone released Nov 2007: "Nokia. One Billion Customers—Can Anyone Catch the Cell Phone King? (Forbes) pic.twitter.com/uGKcovNSvO
The moral of the story is that the rise and fall of different industries, different companies, and different professions can be messy.
But the long-run result is much higher living standards for families. As I explained in this video, even the children and grandchildren of people who lost their jobs because of creative destruction are much better off.
P.S. Understanding creative destruction also helps to explain why industrial policy is so misguided, along with protectionism. Politicians and special interests are motivated by a desire to save jobs in declining sectors. Instead, they should adopt policies that lower barriers to investment and entrepreneurship. That’s the recipe to hasten the creation of new jobs.
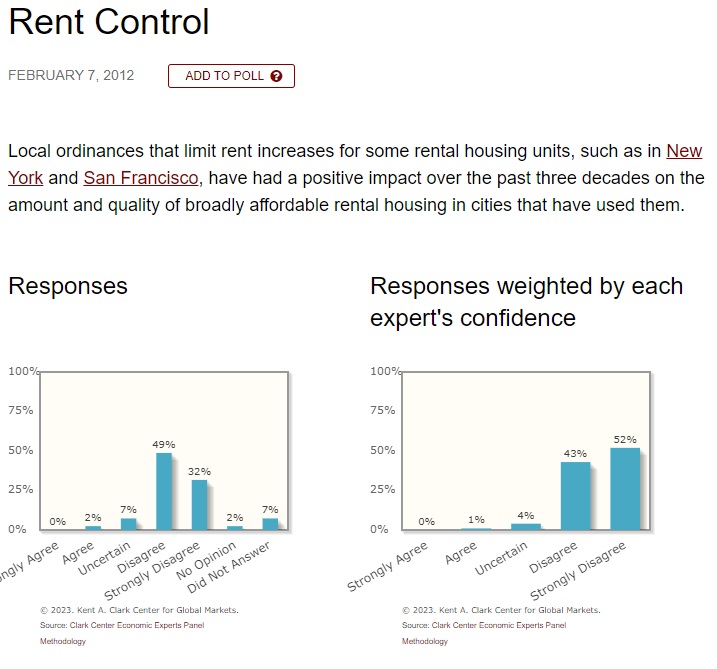
Yet there is near-unanimity in the profession that rent control is a failure. Here’s the data, courtesy of Professor Jeremy Horpedahl.
Yet politicians on the west coast don’t care about economic reality, as explained by David Chen in a report for the New York Times.
…thousands of Washington residents…have converged in recent weeks on Olympia, the state capital, to lobby legislators about one of the most closely watched housing bills in the country: A measure that would cap residential rent increases at 7 percent a year. Deemed a priority by the Democratic leaders who control the State Legislature, the bill has cleared the House of Representatives and is now in the Senate. If it is enacted, Washington would become the third state in the country to adopt statewide rent regulations, after Oregon and California… The state of Washington…would protect tenants throughout the state, including those in towns that may be unable or unwilling to take their own action.
Actually, such legislation would not “protect tenants.”
As always happens with price controls, shortages will appear.
Speaking of politicians who ignore reality, here are some excerpts from a Wall Street Journaleditorial last year.
Democrats in Congress are now pressing the President to impose rent control nationwide…a pretext to nationalize local housing policy. Fifty Democrats in Congress…sent a letter urging Mr. Biden “to pursue all possible strategies to end corporate price gouging in the real estate sector and ensure that renters and people experiencing homelessness across this country are stably housed this winter.” …Democrats want the Federal Housing Finance Agency (FHFA), which supervises government-sponsored enterprises Fannie Mae and Freddie Mac, to establish “anti-price gouging protections” and “just cause eviction standards” in rental properties with government-backed mortgages. These are their euphemisms for rent control and eviction bans.
Let’s close with some evidence from a recent rent-control mistake in Germany. Two German scholars, Pekka Sagner and Michael Voigtländer , investigated the impact of a rent freeze in Berlin.
The Berlin rent freeze was an unprecedented market intervention in the German housing market. We analyse how the rent cap part of the legislation which fixed rents at below market levels affected the supply side in the short term. We find rent decreases accompanied by decreases in supply five times as large. …We make use of a rich dataset of real estate advertisements and employ hedonic difference-in-difference and triple-difference estimation strategies.
Maybe it’s just me, but “decreases in supply five times as large” seems like a bad thing.
It’s almost as if Berlin politicians were a bunch of economic illiterates. Or, they knew the likely result but didn’t care because they were focused on short-term political benefits for themselves.
Since economic principles don’t change when you cross national borders, one might expect to see similar patterns in other countries.
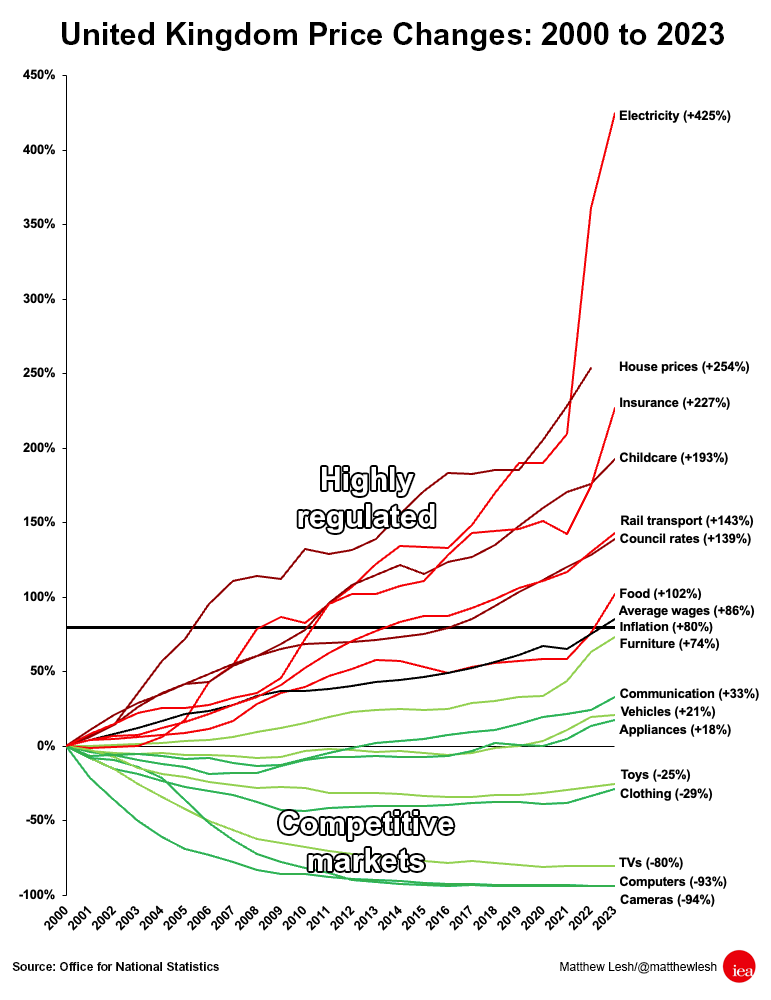
And we do. Here’s a chart from Matthew Lesh of the Institute for Economic Affairs in London. As you can see, overall inflation in the United Kingdom since 2000 has been 80 percent.
But prices have risen much faster in the sectors with lots of government intervention.
And prices have fallen, or risen at a slower-than-average pace, in the sectors where market forces dominate.
Here’s some of what he wrote to accompany the chart.
Prices have risen significantly faster than wages in the United Kingdom over recent years. The result has been a falling quality of life and significant hardship for tens of millions of households. Real household disposable incomes are now expected to be 3.5% lower in 2024-25 than their pre-pandemic levels… A useful starting point is considering which products have, and which have not, risen in price over recent years. …There have also been significant price increases in services and costs the government more directly controls, such as rail transport (+143%) – where the government sets around half the fares and heavily controls the sector – and council rates (+139%). …The products that have gone up most rapidly in cost include electricity (+425%), housing (+254%), and childcare (193%). Notably, these are sectors that have extensive state intervention through regulation and subsidies. …governments can and should change their approach to regulation. Cutting red tape in areas such as housing, energy, and financial services could reduce business costs and increase supply, resulting in lower costs for consumers.
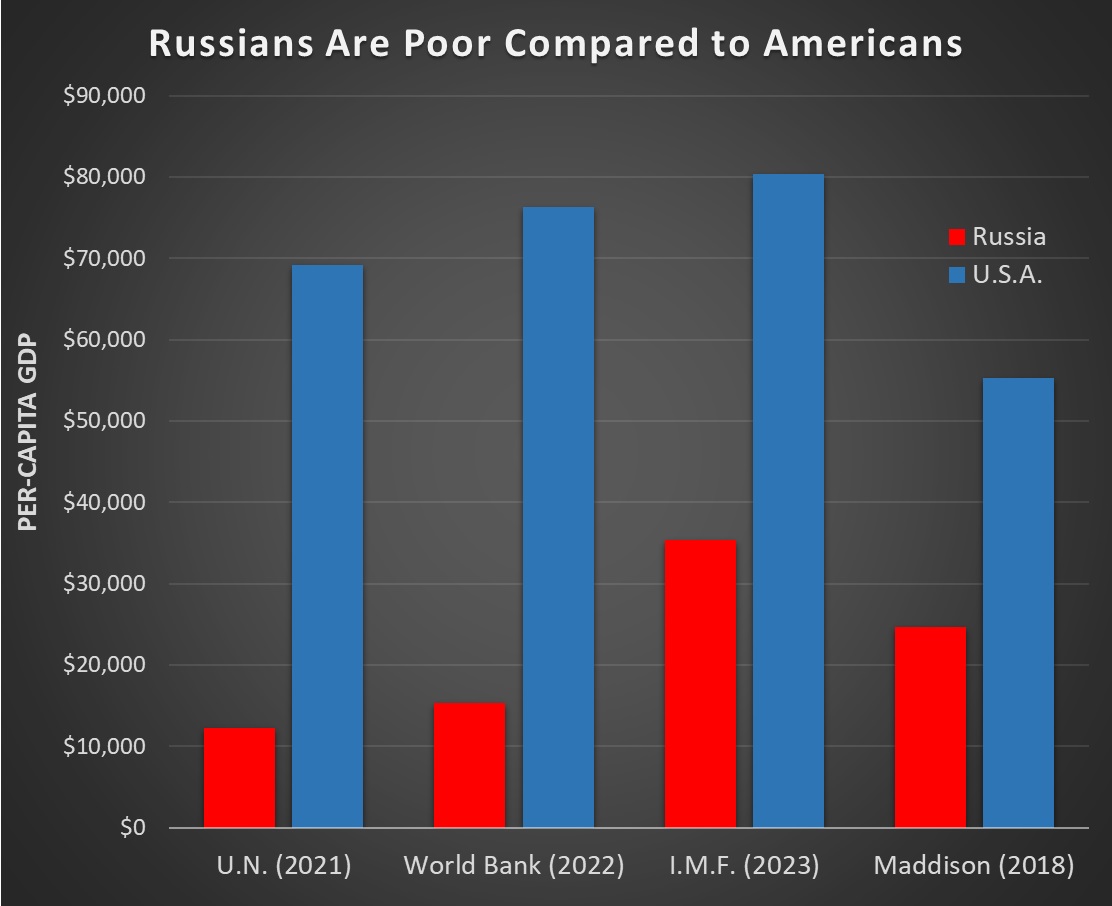
We’ll start with the big-picture comparison based on data from the IMF, Maddison, the UN, and World Bank. As you can see, Americans are far richer than their Russian counterparts.
The IMF and Maddison data are based on purchasing power parity, so they adjust for the fact that some things are less expensive in Russia (and the Maddison data is based on 2011 dollars, so those numbers would look more like the IMF numbers if based on today’s dollars).
The bottom line is that Americans should not envy the Russian economy, regardless of which data source one prefers.
This does not mean, by the way, that the U.S. economy is perfect. Or that America should be immune from criticism. Most of my professional life has been devoted to trying fix bad U.S. policies. Or trying to prevent new mistakes from happening!
But I’m very grateful that I live in a nation where policy is inadequate rather than a country where policy is terrible.
And even though I’m an economist, I’m also very aware that the United States is also much better when comparing basic political and social freedoms.
Is the U.S. perfect in those areas? My Victims-of-Government page confirms that we have some problems. That being said, we are far better than Russia (where 47-year old political dissidents mysteriously die in Siberian prisons).
Before concluding, let’s return to economic comparisons. Here’s a tweet that captures the difference between a rich country and a struggling country.
And I’ll also cite a few sentences from a 2022 column in the Washington Post by AEI’s Nicholas Eberstadt.
Putin is flailing against the history of modern economic development. The wealth of modern nations is overwhelmingly generated by human beings and their capabilities. Natural resources (land, energy and all the rest) have accounted for a shrinking share of global output for the past two centuries, with no end in sight. …for all its vaunted oil and gas riches, Russia’s export earnings last year were actually lower than Belgium’s. Like other Western democracies, Belgium manages to augment and unlock the economic value residing in human beings. Putin’s petro-kleptocracy is woefully inept on both counts. …Since the invasion of Ukraine, some of Russia’s best talent has been voting with its feet, heading abroad any way it can. …the Russian system produces remarkably little private wealth. According to Credit Suisse, total private wealth in Russia in 2020 amounted to $3 trillion: one-ninth of Japan’s, one-sixth of Germany’s, and scarcely more than Sweden’s (a country with a population 14 times smaller).
The bottom line is that Russia is way behind the United States.
Anyone who says otherwise is ignorant or dishonest. Even those who assert equivalence are wildly wrong.
I wrote three columns about occupational licensing in 2017 (here, here, and here), but have since neglected the issue.
It’s time to revisit the issue, and we’ll start with this John Stossel video.
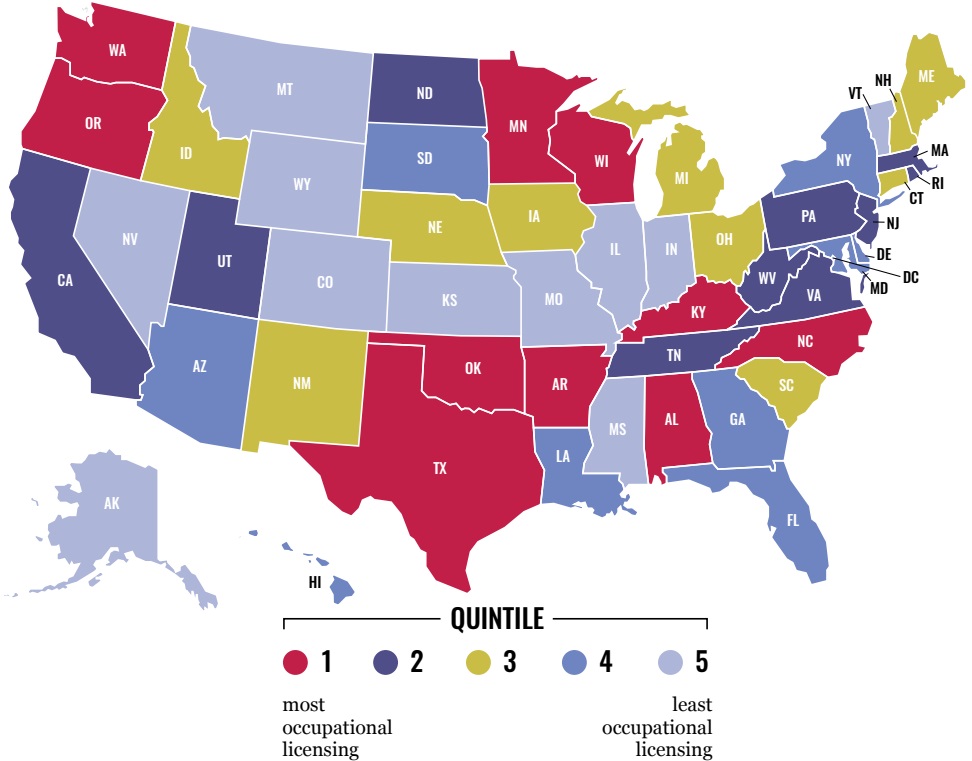
One of the reasons I’m writing about the issue is that the Archbridge Institute issued a report last year that ranked states based on the degree to which they required workers to get permissions slips from government in order to work.
The report was written by Noah Trudeau of Saint Francis University and Edward Timmons of West Virginia University, and it includes a very helpful map. Light blue states are the best and red states are the worst.
Here are some of the findings from their overview.
Occupational licensing affects more than 20 percent of workers in the United States. The extent of occupational licensing greatly differs across states. From both a research and public policy standpoint, it is important to have a comprehensive measure of occupational licensure across states and occupations. The purpose of the State Occupational Licensing Index (SOLI) is to help fill in this gap. The report contains four main sections: an introduction to the index, an overview of our methodology, a comparison to other database rankings, and state profiles for all 50 US states plus DC. …In 2023, the state with the highest occupational licensing burden is Arkansas (#1), followed by Texas (#2), Alabama (#3), Oklahoma (#4), and Washington (#5); the state with the lowest occupational licensing burden is Kansas (#51), preceded by Missouri (#50), Wyoming (#49), Indiana (#48), and Colorado (#47).
Congratulations to Kansas for having the most laissez-faire approach. Arkansas, by contrast, deserves scorn.
Why scorn for Arkansas? Let’s look at some additional analysis.
In 2018, Morris Kleiner and Evgeny Vorotnikov authored a study for the Institute for Justice about occupational licensing. Here are some of their results.
…licensing is frequently wasteful. In preventing people from working in the occupations for which they are best suited, licensing misallocates people’s human capital. In forcing people to fulfill burdensome licensing requirements that do not raise quality, licensing misallocates people’s human capital, money and time. And with its promise of economic returns over and above what can be had absent licensing, licensing encourages occupational practitioners and their occupational associations to invest resources in rent-seeking instead of more productive activity. Taking these misallocated resources into account, we find potential costs to the economy that far exceed those from deadweight losses…we find licensing costs the American economy $183.9 billion in misallocated resources… Assuming the 15 percent national returns, we find licensing costs the American economy $197.3 billion in misallocated resources.
That’s the economic cost to the country.
But don’t forget that hundreds of thousands of Americans lose employment opportunities because of their restrictive regulations.
Let’s close with a bit of good news. Veronique de Rugy wrote a few years ago that there are reform efforts.
The beauty of American federalism is that it allows states to try out different policies and see what works well and what does not. The state of Arizona is putting this flexibility to good use. After implementing a moratorium on occupational-licensing requirements in 2015, the state passed legislation to recognize occupational licenses from other states last year. Going against special-interest groups in various industries whose members would prefer to face as little competition as possible, Arizona is saying that it is open for all business and welcomes competition. As a result, Arizona is effectively launching a healthy competition for workers among the states themselves. …Faced in part with this competition from Arizona, other states are finally getting serious about reforming their own occupational-licensing requirements. …Shoshana Weissmann and Jarrett Dieterle write that many other states are following in Arizona’s footsteps, as evidenced by the fact that in 2020 alone “universal recognition bills are being pursued in Virginia, West Virginia, California, Ohio, Missouri, Georgia, New Hampshire, Indiana, and New Jersey.” …Let’s hope that all the states will follow Arizona’s lead and catch the reform bug so they, too, will free their workers, consumers, and economies from ridiculous licensing requirements.
And other states are catching up, as Veronique hoped.
Marc Joffe has an article about positive developments in Ohio and Nevada.
And here are some excerpts from a Forbes column by Patrick Gleason.
…there is another policy trend emerging that, like income tax relief and greater educational choice, is making states more attractive to workers and employers. That trend is the push by policymakers to remove or mitigate the barriers to employment that state occupational licensing requirements have become. …Universal License Recognition (ULR)…Nearly half of the states now have a ULR law. But four years ago, zero did, underscoring how quickly the ULR movement has grown. Former Governor Doug Ducey (R) made Arizona the first state to enact ULR back in 2019, with positive results observable in the subsequent years. …by also making occupational licensing requirements less taxing for new residents to comply with, both in terms of time and money, reform-minded governors and state lawmakers have honed in on a new way, like with rate-reducing tax reform, to make their states more attractive places to live, work, do business, and support a family.
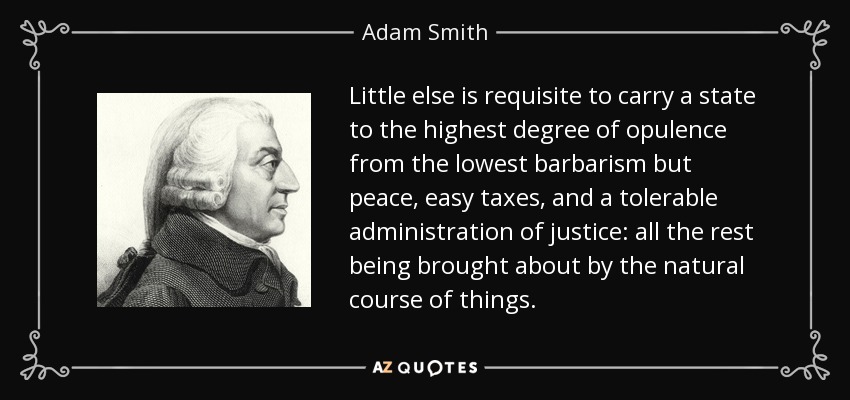
The recipe for prosperity is actually very simple, as Adam Smith wrote centuries ago.
Sadly, most governments don’t follow that recipe, largely because politicians have the wrong incentives. They lose power and control if a nation has free markets and limited government.
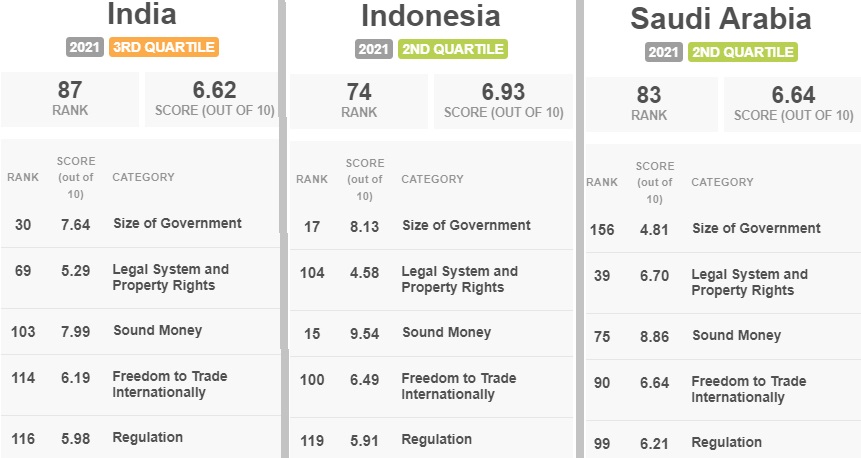
Given the importance of this issue, I was very interested to see that the U.K.-based Economist had an article about plans for faster growth in India, Indonesia, and Saudi Arabia.
The good news is that these nations recognize that it is vital to be part of the global economy. The bad news is that they foolishly think protectionism and industrial policy will produce good results.
…many developing countries’ ideas for growth are staggeringly ambitious. India and Indonesia hope to become high-income countries within 25 years. …Refreshingly, such plans are more outward-looking than many development strategies of old. …That is a welcome shift. …serving foreign markets plays a vital role in development. It keeps firms honest, by forcing them to compete in markets that their governments do not control. …Nonetheless, today’s development strategies also hold dangers. In many countries governments are running the risk of warping the economy in the name of nurturing it. Saudi Arabia’s onslaught of industrial policy, mainly disbursed as handouts from the Public Investment Fund, exceeds the spending even of America’s Inflation Reduction Act. …India is seeking to fence off its high-tech manufacturers behind tariffs and subsidies. Indonesia’s all-in bet on nickel leaves it perilously exposed… The rich world’s new-found zeal for protectionism may make it tempting for poorer countries to follow suit.
It is possible that India, Indonesia, and Saudi Arabia can compensate for bad trade policy and bad industrial policy by having very good policies in other areas?
Maybe, but don’t hold your breath. According to Economic Freedom of the World, all three nations have very mediocre scores for economic liberty. Both overall and in most of the five categories.
The bottom line is that these nations need growth. So it’s good that politicians say they want to make that happen.
But none of those countries will become another Singapore or (pre-China-takeover) Hong Kong unless there are radical reductions in the size and scope of government.
The first indication of bias is that every answer was the one that made Biden look good (or less bad).
Sort of like a quiz asking if communists killed 1 billion people, 500 million people, or 100 million. The fact that the right answer is that they “only” killed 100 million is hardly a ringing endorsement of Marx’s evil ideology.
But another problem is that some of the questions also were steroid-fueled examples of grading on a curve. For instance, based on Question #1, we’re supposed to be impressed that the United States has grown faster than Europe’s decrepit welfare states.
For what it’s worth, growing faster than France, Italy, and Greece is not exactly something to celebrate, as you might imagine.
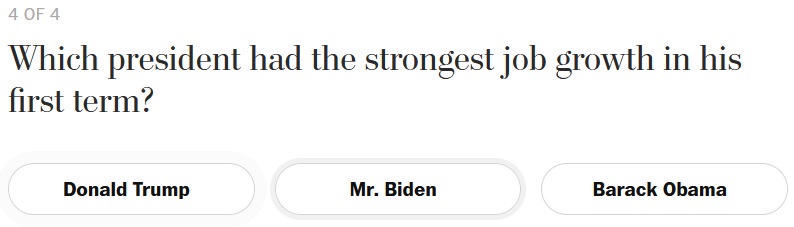
Question #4 also is designed to make Biden look good by comparing job creation during his tenure to what happened under Trump and Obama.
Yet beating Obama is hardly a major achievement, and the Trump numbers are very distorted because Trump and Fauci shut down the economy during the pandemic.
Suffice to say, Biden would not look good if his job numbers were compared were compared to market-friendly presidents like Ronald Reagan and Bill Clinton.
There were two other questions, which also were biased but not to the absurd level as the ones described above.
Question #2 implies that Biden has done a good job because gas prices have only increased by 75 cents a gallon rather than going up by $1 or $2. Sort of like saying a diet is successful if you’re gaining two pounds a week rather than five pounds.
Question #3 implies that Biden has done a good job because wages have almost risen as fast as inflation. Needless to say, the fact that there as been zero inflation-adjusted wage growth is actually a damning indictment of Bidenomics.
Here’s how the Post described the quiz.
The past few years have been tumultuous, with a deadly pandemic, a recession, an inflation spike and overseas wars. Perhaps unsurprisingly, Americans give President Biden low marks on the economy. How bad are things? This quiz will help you calibrate your level of concern, and it will show you how your knowledge of economic reality stacks up against other Americans we asked and other Post readers.
The Post obviously wants readers to conclude that Biden deserves good marks for the economy. The fact that the paper had to engage in contortions tells you what you really need to know.
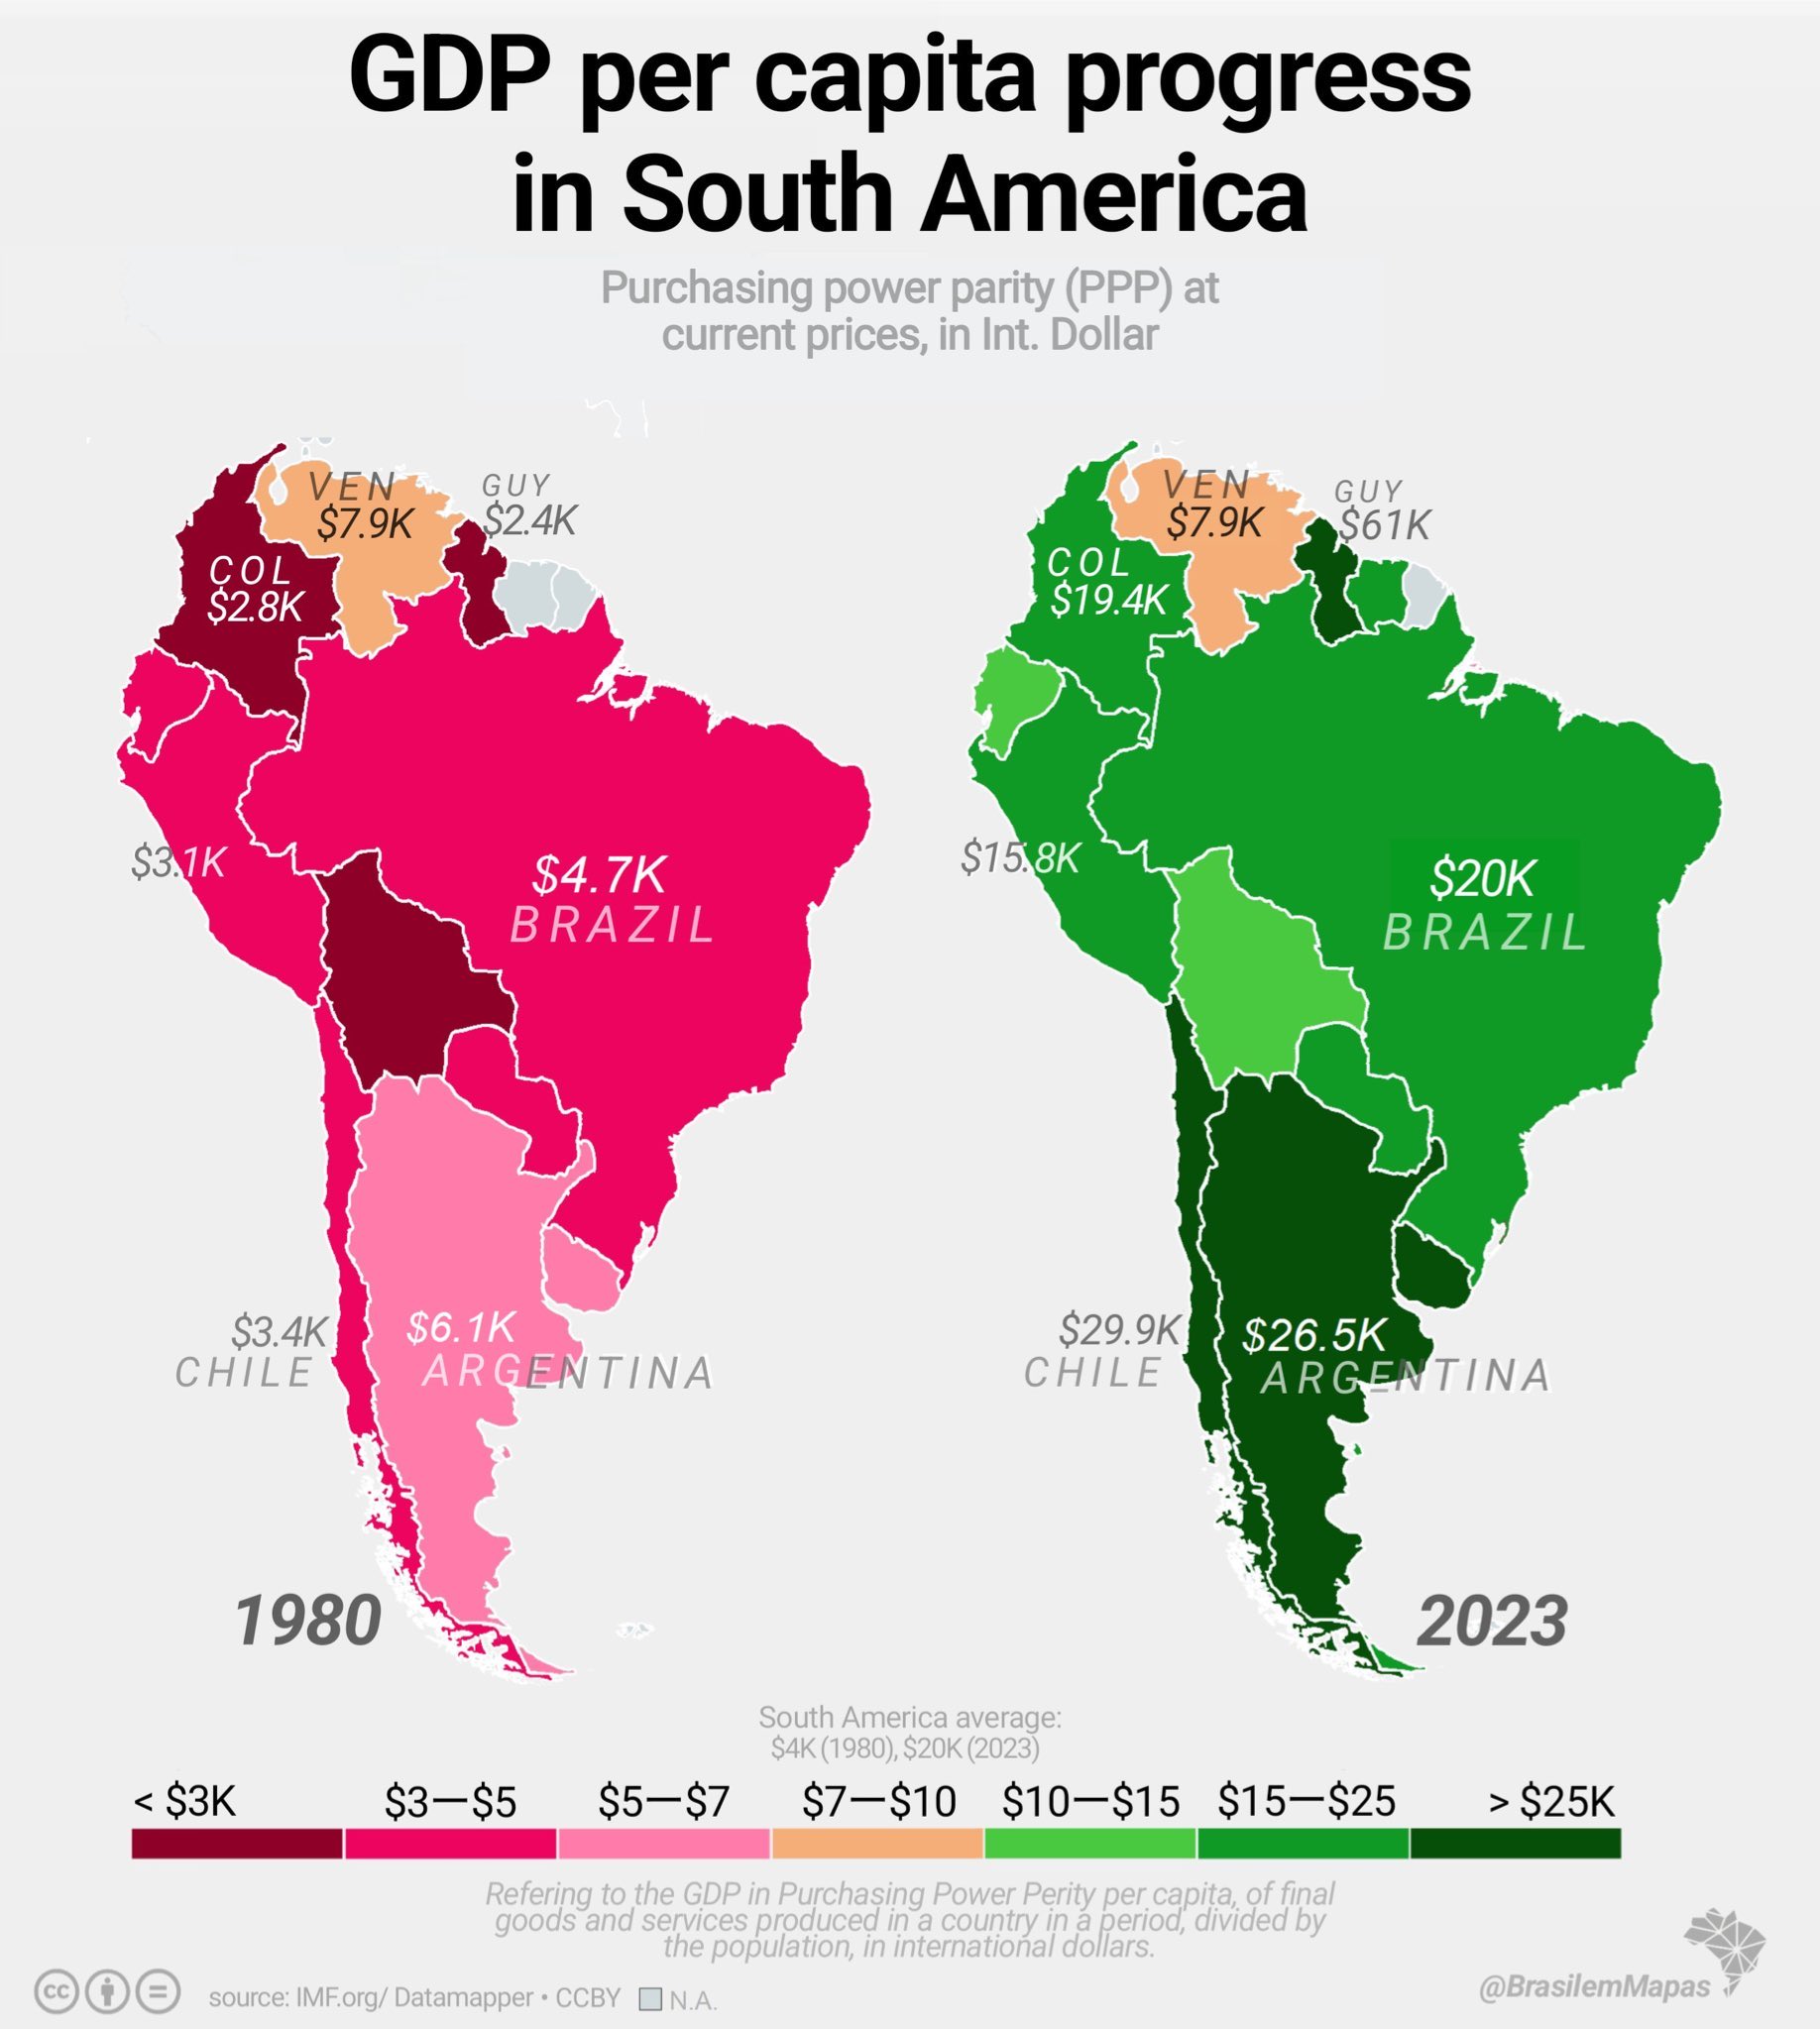
Today, let’s compare and contrast what has happened to these two countries.
Here are two maps of South America showing per-capita economic output. Amazingly, Venezuela was more than twice as rich as Chile in 1980 but now Chile is more than three times as rich as Venezuela.
At this point, I normally would pontificate about the meaning of these two maps.
But there’s no need for me to write anything because the person who shared them on Twitter (X) nailed the obvious takeaway.
Game, set, and match. Economic liberty trounces statism.
But before looking at Kenyan tax policy, let’s first look at some IMF data on the rapidly growing burden of government spending in that East African nation.
That’s a very depressing chart, showing about 10 times as much spending today compared to 20 years ago. But keep in mind that there’s been inflation.
If you look instead at spending as a share of economic output, the government budget is now consuming about 22.5 percent of GDP compared to 15.5 percent of GDP two decades ago.
A very troubling development, though not as bad as implied by the chart.
As is usually the case, bad spending policy has led to bad tax policy. Kenyan politicians have been trying to squeeze more money out of the private sector.
However, as reported by Victor Amadala for the Star, higher taxes are backfiring.
Kenyans…talked to the Star on measures they take to survive in a tough economic environment characterized by the high cost of goods and services due to high taxes… Last year, the government introduced several tax measures in the Finance Act, 2023 that added pressure on taxpayers, pushing up the cost of living. It, for instance, doubled Value Added Tax to 16 percent on fuel… Others are the introduction of a housing levy and raised deductions on national health coverage and social protection. …An analysis of official data by both the Kenya National Bureau of Statistics and the Energy and Petroleum Regulatory Authority (EPRA) shows kerosene consumption dropped by almost half, three months after VAT on fuel doubled in July last year. Only 15.3 million litres of kerosene were sold in the review period compared to 28.8 million litres same period in 2022, the lowest in past five years. …The state is on the receiving end as consumers become creative to escape high taxes. The latest report by the Parliamentary Budget Office (BPO) shows Kenya Revenue Authority (KRA) missed the tax revenue collection target for quarter one of the current financial year by Sh72.5 billion. …”You cannot defy the Laffer Curve theory and survive. Tax measures must be of mutual benefit between the public and the state. This is just the tip of the iceberg, winter is coming,” an economist Shem Mutonji opines. …This sentiment is echoed by his colleague, Joe Ngatia who says you cannot overmilk a cow to prosperity for “It will throw a hoaf in desperation.”
Sounds like we need Shem Mutonji and Joe Ngatia working for the U.S. Treasury. Maybe they could convince Joe Biden that overtaxing the American economy is not a good idea.
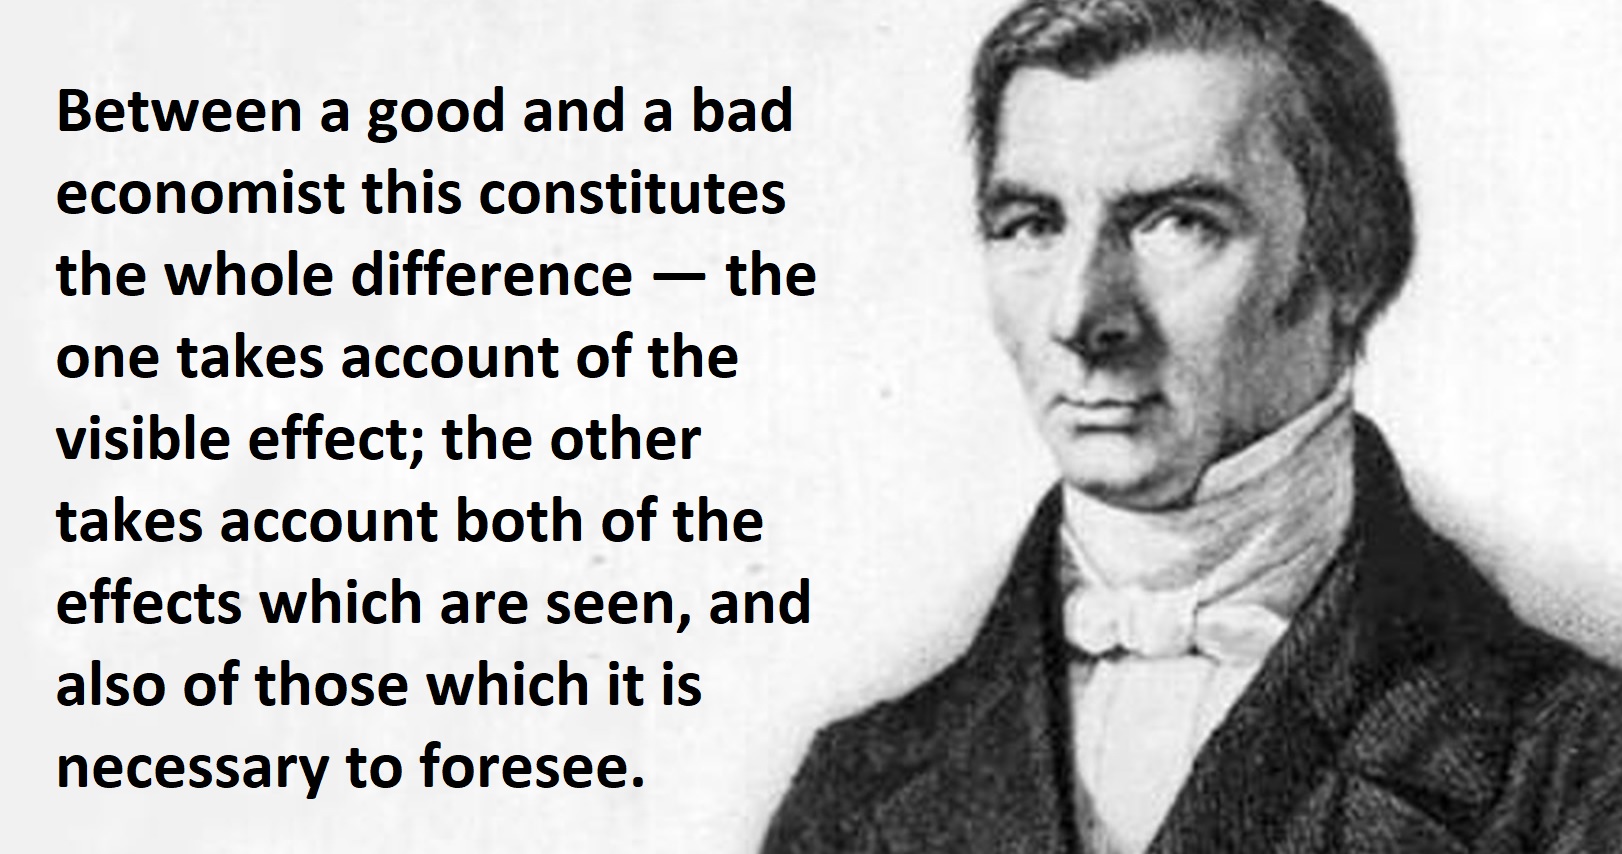
The great French economist from the 1800s, Frederic Bastiat, famously explained that good economists are aware that government policies have indirect effects (the “unseen”).
Bad economists, by contrast, only consider direct effects (the “seen”).
In modern terms, sensible economists realize that government policies often have indirect effects. These are sometimes called unintended consequences.
Here are a few examples of interventions that have backfired, often hurting intended beneficiaries. Here are a few examples:
By the way, I began every example with “(supposedly)” because our friends on the left tend to have two reasons for pursuing bad policy.
Reason #1, depicted by the cartoon, is a naive do-gooder mentality. They see something that they think is unfair and they reflexively want the government to address the alleged problem. And since they don’t have any (good) economic training, they don’t consider the possibility that their preferred policies will make things worse.
Reason #2 is “public choice,” which is a term that describes how politician, bureaucrats, and voters put self interest above the national interest. Instead of being naive do-gooders, these are people who probably recognize that certain policies will backfire, but they simply don’t care because a policy has certain advantages, such as political popularity.
I didn’t intend to write such a lengthy introduction to today’s column, but you’ll understand my motivation when you read these excerpts from a Washington Poststory by Tony Romm.
The government (supposedly) wants to help bank consumers by limiting overdraft fees.
The U.S. government on Wednesday proposed to limit bank overdraft fees, which companies can charge customers who spend more money than they have available in their accounts… The new draft rules, unveiled by the Consumer Financial Protection Bureau, could cap some of the charges as low as $3… Generally, overdraft payment programs function as a kind of loan: If a customer spends more money than they have, they can elect for the bank to process the transaction anyway. If they do, consumers must pay back the remainder they owe, plus a fee, which averages about $26 per overage nationally… Under the agency’s new draft proposal, banks would be subject to tough credit card-like regulations on their overdraft programs, unless they agree to lower fees on customers.
Reading this story, I don’t doubt that banks want to squeeze as much out of customers as possible (and the same is true for grocery stores, barber shops, and every other kind of business).
But there’s something else I don’t doubt, which is that this policy will backfire in some unintended way.
Why do I think that?
For the simple reason that we’ve seen this happen over and over again. When governments impose costs on the private sector, something bad happens. With lower-income people generally losing the most.
Here are just three examples from the financial services industry.
Their Prosperity Index, for instance, uses some common-sense variables such as per-capita economic output, but it also is based in part on mis-measured variables such as years of education rather than actual education achievement.
Worst of all, there is an inequality variable. And to give you an idea of why that’s methodological garbage, the U.S. score would increase if all rich Americans were exiled even though that would mean a big drop in per-capita GDP.
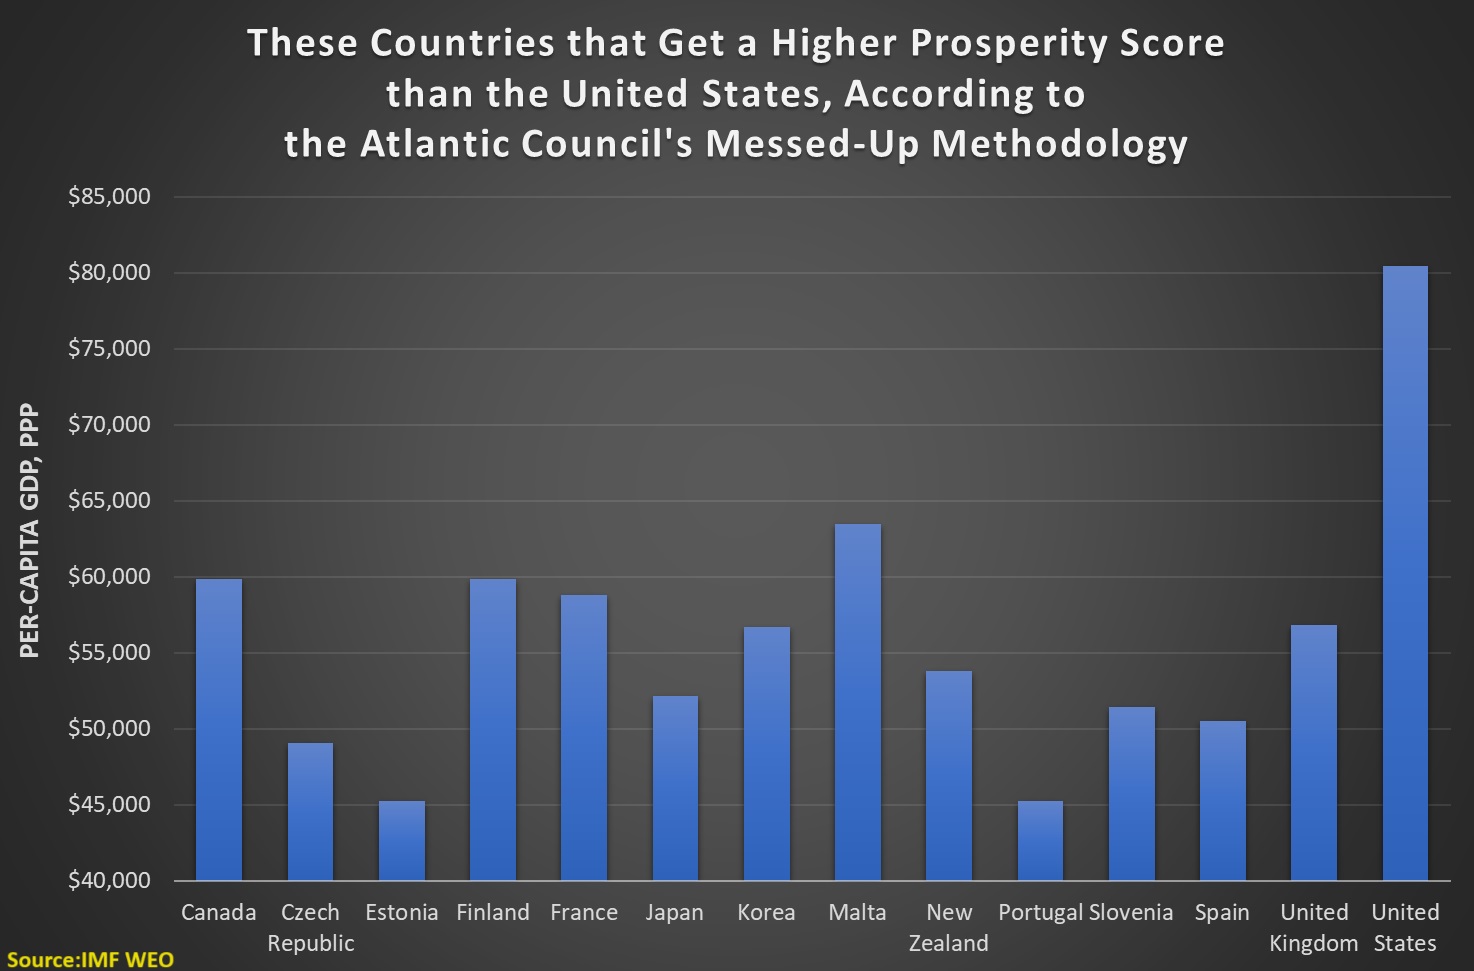
You may think I’m being pedantic or ideological, but here’s some real-world evidence to show you why the Atlantic Council’s analysis is laughably misguided.
This chart shows IMF data on per-capita GDP. You can see the United States on the right, way ahead of the other nations with more than $80,000 of economic output per person.
What do all the other countries have in common, besides having much-lower levels of per-capita GDP? They all score higher than the United States in the Atlantic Council’s Prosperity Index.
Reminds me of the dodgy analysis from the OECD that asserted that poverty was higher in the United States than in nations such as Portugal, Greece, Turkey, Hungary, Mexico, and Poland.
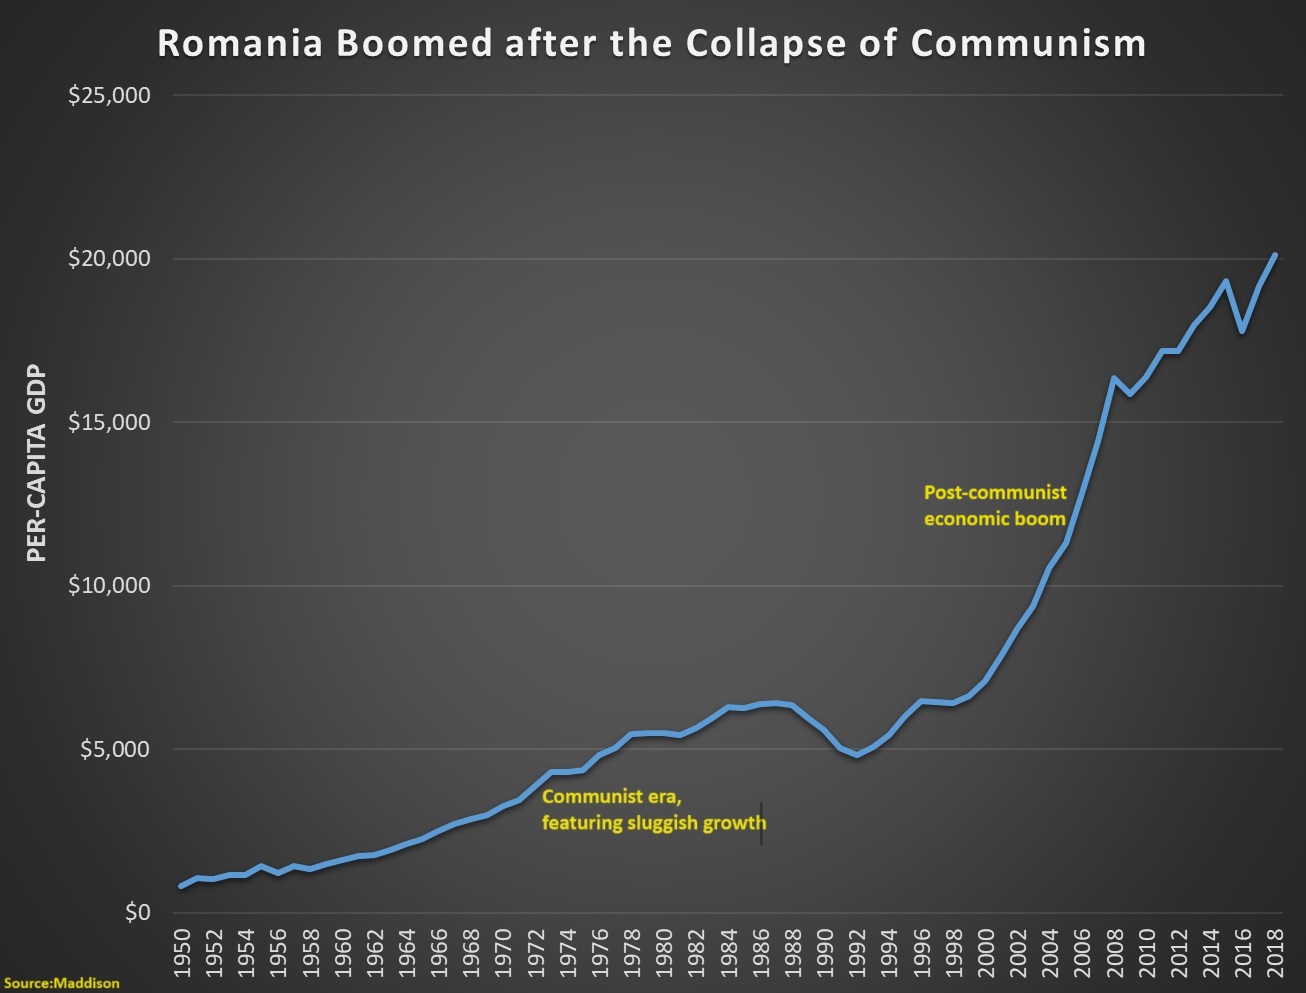
P.S. One other thing I would correct in the video was the discussion of Romania. Yes, Romania is now much richer today than it was in 1950.
But simply showing the difference between living standards in 1950 and today obscures the very important fact that the vast bulk of the improvement came after Romania escaped communist slavery.
Some tax cuts (lower marginal tax rates on high earners, lower capital gains tax rates, lower corporate tax rates, etc) can be very powerful because affected taxpayers have a lot of control over the timing, level, and composition of their income. So if their tax rates change, they have the incentive and ability to increase their economic activity.
Other tax cuts (child credits, lower sales taxes, etc) may not have much economic impact because there is no significant change in incentives to work, save, invest, or be entrepreneurial. Or maybe taxpayers don’t simply don’t have much flexibility to respond. For instance, I’m a regular wage earner so I don’t have much ability or incentive to change my economic activity if my tax rate changes.
Understanding the economics of taxation is important because major parts of the Trump tax cuts will expire at the end of next year and it is very likely that politicians in Washington soon will decide that only some parts are worth keeping.
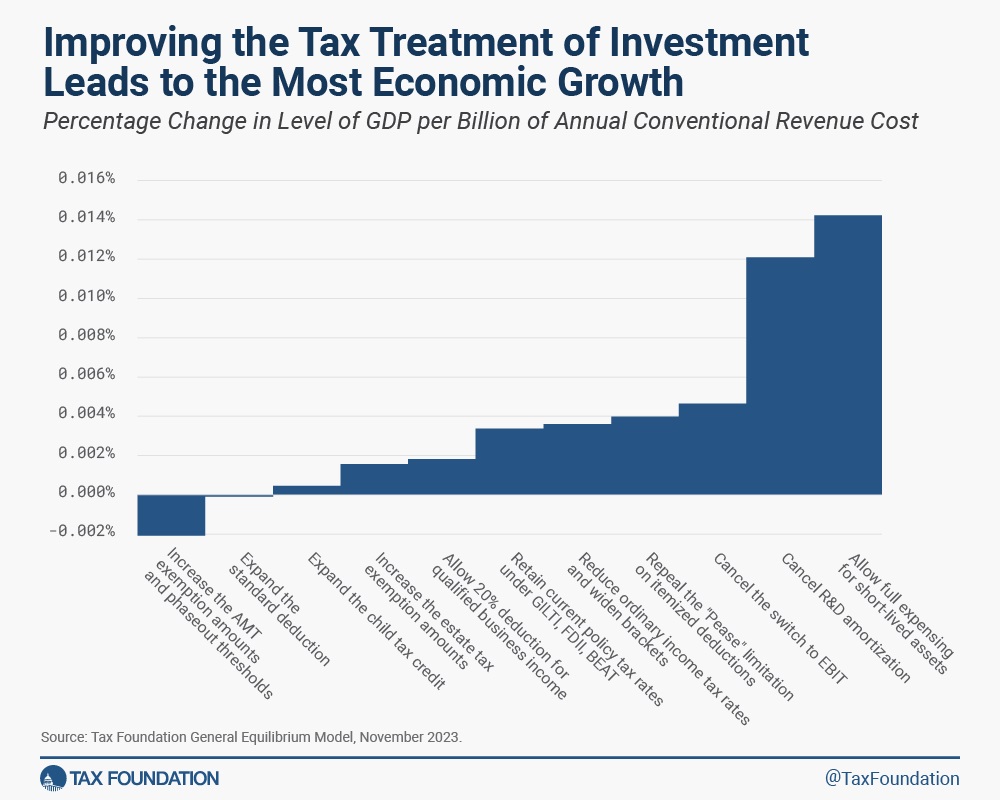
But which of the expiring tax cuts should be preserved? Here’s a chart showing how much “bang for the buck” the economy gets from different parts of the Trump tax cuts.
The chart comes from some new research by Erica York of the Tax Foundation. Here’s some of what she wrote.
…most of the 2017 tax reform law will expire after the end of next year. If lawmakers allow full expiration to occur, most Americans will see their personal tax bills rise and incentives for working and investing worsen. Extending the entire tax reform, however, would come with a $3.7 trillion price tag at a time when the country’s fiscal outlook is already bleak. Lawmakers should…prioritize policies that best boost work and investment incentives in a fiscally responsible manner. …The 11 tax cuts vary widely in how they would affect people’s decisions to work and invest. Some tax cuts create a larger economic boost than others. One indicator is to compare the estimated change in long-run GDP to the estimated change in annual tax revenue in the final year of the budget window. Using the last year of revenue is a proxy for the ongoing, long-run cost of a policy change. The most powerful provision under that metric is full expensing for business investment in equipment, followed by expensing for research and development costs. At the other end, some tax cuts counterintuitively reduce economic output because of their interactive effects with marginal tax rates. Other tax cuts have middling effects, improving incentives to work or invest but not as powerfully as full expensing.
None of this means that you have to agree with the exact details of the Tax Foundation’s model, or that economic bang for the buck should be the only consideration when deciding tax policy.
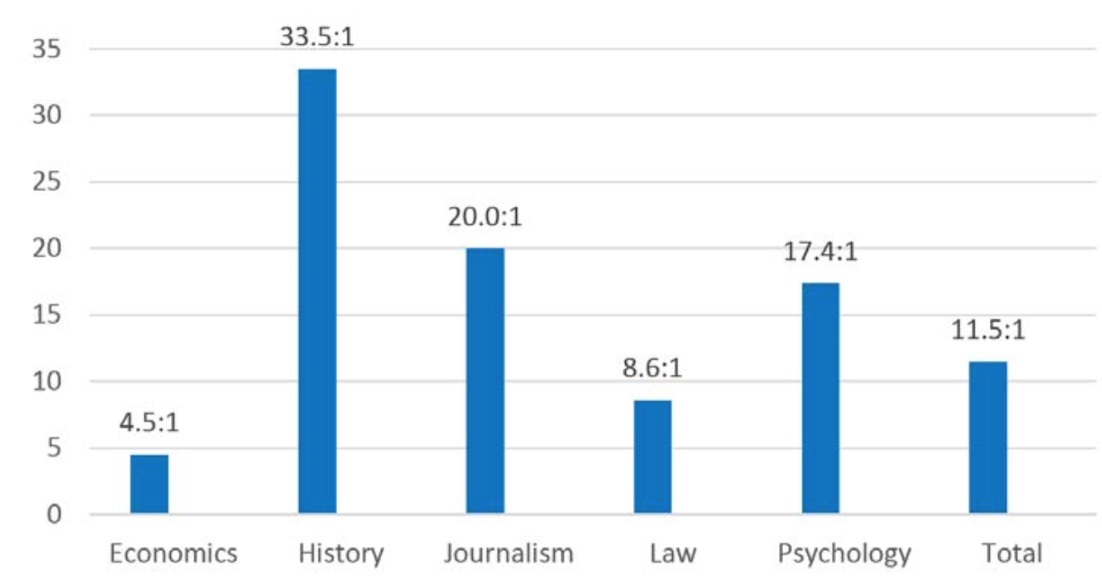
Let’s see why that makes a difference. Two economists (Jeremy Horpedahl and Phillip Magness) and a historian (Marcus Witcher) examined how college textbooks analyze and explain the Great Depression.
In their article, published by the Journal of Economics and Finance Education, they found that significant differences between economics textbooks and history textbooks.
The Depression is usually covered in two college-level courses: introductory economics…and US history survey classes. But the Depression is treated very differently in these two courses. According to the most recently available data, both courses rank among the top ten college courses taken in the United States, with around 40 percent of undergraduate students taking them at some point. For many students, perception of the Great Depression’s causes inform their views on business cycle events in the present. If the Depression is understood to illustrate a failure of free-market capitalism, this belief may shape a student’s views about the proper role of government in general economic policy decisions in addition to business cycle events. The market-failure view is common in college-level history textbooks. If instead the Great Depression is understood as a failure of government institutions to properly address a normal business cycle, the policy implications are much different. The government-failure interpretation of the Depression is much more common among economic historians.
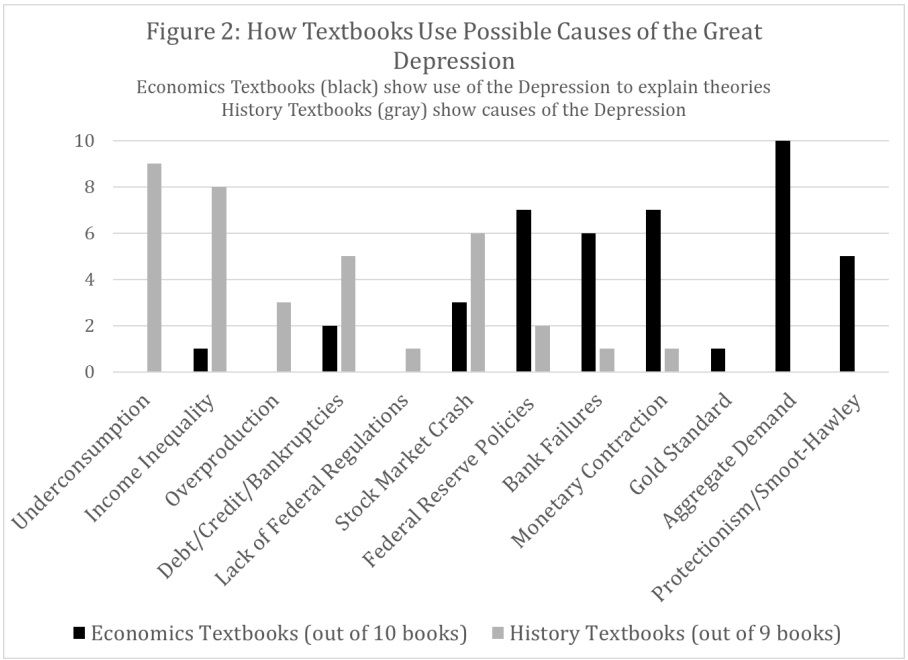
But let’s keep the focus on the article. The authors included this chart showing the causes of the Great Depression, as identified by historians and economists.
Here are a few of my observations.
I would have used some sort of term like “Keynesian theory” for both “underconsumption” and “aggregate demand,” so I don’t think economics and history textbooks are significantly different in that regard.
P.S. A big takeaway from today’s column is that college history textbooks leave something to be desired, but I’m sure they can’t be nearly as awful as Howard Zinn’s A People’s History of the United States, a tedious left-wing tract that is commonly used to brainwash high school students.
Javier Milei appears to be fully aware of what is needed to rejuvenate his nation, and is also being very honest about what will be required. But also very optimistic about the benefits.
During his inaugural address, he bluntly told the country that, “We are going to take all the necessary decisions to fix the problem left by 100 years of waste by the political class, even if it is hard in the beginning. We know that in the short term, the situation will worsen, but then we will see the fruits of our efforts.”
But does it apply in a nation – like Argentina – that needs “shock therapy“?
Critics call this approach “disaster capitalism” and they think it is a terrible outcome.
In an article published last month, the U.K.-based Economist calls it “Daredevil Economics” and presents evidence that it produces good outcomes. Here are some excerpts, starting with the observation that there was a lot of pro-growth reform in the last 1900s..
We analysed data from the Fraser Institute, a free-market think-tank, which measures “economic freedom” on a ten-point scale. We considered cases where a country improves by 1.5 points or more—a quarter of the gap between Switzerland and Venezuela—within a decade, indicating that bold, liberalising reforms have been undertaken. In the 1980s and 1990s such “daredevil economics” was common… Politicians changed foreign-trade rules, fortified central banks, cut budget deficits and sold state-owned firms.
Daredevil economics has declined in popularity… Books such as Joseph Stiglitz’s “Globalisation and its Discontents”, published in 2002, and Naomi Klein’s “The Shock Doctrine”, in 2007, fomented opposition to the free-market “Washington consensus”.
This anti-market evolution is very unfortunate. At least if you care about people having better lives.
The article cites academic research showing that bold reforms produce good results, even if there is short-run pain.
…the view that daredevil economics failed does not stand up to scrutiny, even if projects often produced short-term pain. …a growing body of research suggests that daredevil economics has largely achieved its aims. A paper by Antoni Estevadeordal of the Georgetown Americas Institute and Alan Taylor of the University of California, Davis studies the effect of liberalising tariffs on imported capital and intermediate goods from the 1970s to the 2000s, finding that the policy raises gdp growth by about one percentage point. …a paper published in 2021 by Anusha Chari of the University of North Carolina, Chapel Hill and Peter Blair Henry and Hector Reyes of Stanford University finds positive impacts from a wide variety of reforms in emerging markets, from stabilising high inflation to opening capital markets. …Daredevil economics may be disruptive, but it pays off.
The article also cites research from two European Central Bank economists, which I wrote about back in 2018.
Their findings are very much in line with what President Milei said in his inaugural address.
Our main findings are as follows: on average, reforms had a negative but statistically insignificant impact in the short term. This slowdown seems to be connected to the economic cycle, and the tendency to implement reforms during a downturn, rather than an effect of reforms per se. Reforming countries however experienced a growth acceleration in the medium-term. As a result, ten years after the reform wave started, GDP per capita was roughly 6 percentage points higher than the synthetic counterfactual scenario.
I’ll close by observing that there is research showing that politicians who enact pro-market reforms are rewarded during elections.
It will be very interesting to see if President Milei can a) implement his reforms, and b) reap the rewards when the economy adjusts and grows faster. If so, that will confirm the third sentence of the Fourth Theorem of Government.
REMARKABLE! In his first act, newly sworn President of Argentina, Javier Milei, signs an executive order reducing the Argentine government from 21 Departments to 9. A major reduction of bureaucracy and overhead. Impressive. pic.twitter.com/F08Z0E0Feu
P.P.S. On the other side of the Andes from Argentina, Chile already has shown that shock therapy produces great results. But there weren’t elections when those reforms happened. If market reforms are successfully implemented in Argentina, following a democratic election, that will be even more impressive.
Even though I added to the collection of economics humor just last month (as well as in August and March), I have more items that are worth sharing.
I’ve written serious critiques of Biden’s fiscal plan – both the original version (which fortunately did not get approved) and the watered-down version (which sadly did get enacted) – but today’s first bit of satire is a much more succinct depiction of why it was a bad proposal.
If you want more infrastructure-themed humor, click here.
Per tradition, I’ve saved the best for last, though this one only makes sense when you understand that “neoliberal” is a term for classical liberalism (i.e., libertarianism), especially outside the United States.
If you want more economics-themed humor, click here, here, here, here, and here.
 Over the past eight years, government spending has grown much faster than the private sector, thus violating the Golden Rule of fiscal policy.
In a reversal of fortunes, the laggards have become leaders. Greece, Spain and Portugal grew in 2023 more than twice as fast as the eurozone average. Italy was not far behind. …southern European countries made crucial changes that have attracted investors, revived growth and…reversed record-high unemployment. Governments cut red tape and corporate taxes to stimulate business and pushed through changes to their once-rigid labor markets, including making it easier for employers to hire and fire workers.