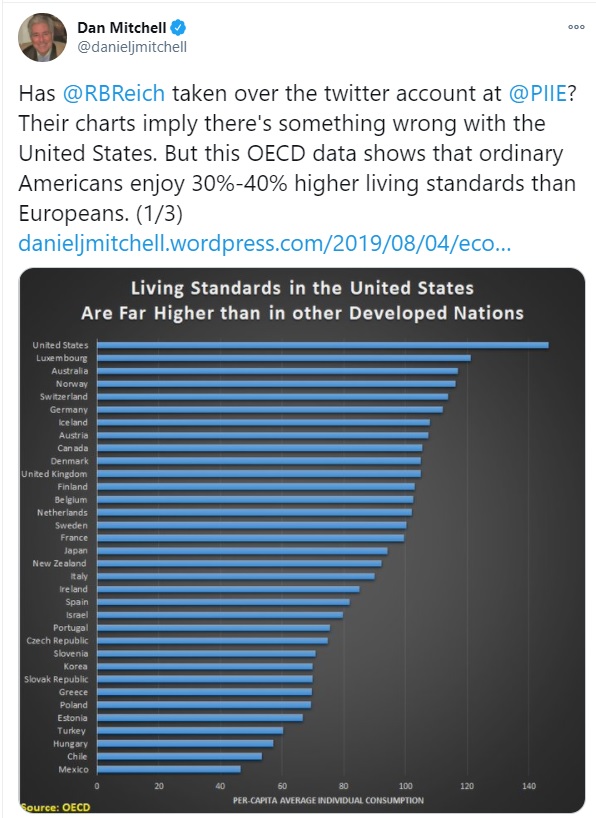
To show that living standards are much higher in the United States than they are in Europe, I periodically share OECD data on average individual consumption (2012, 2014, 2017, 2019, and 2022).
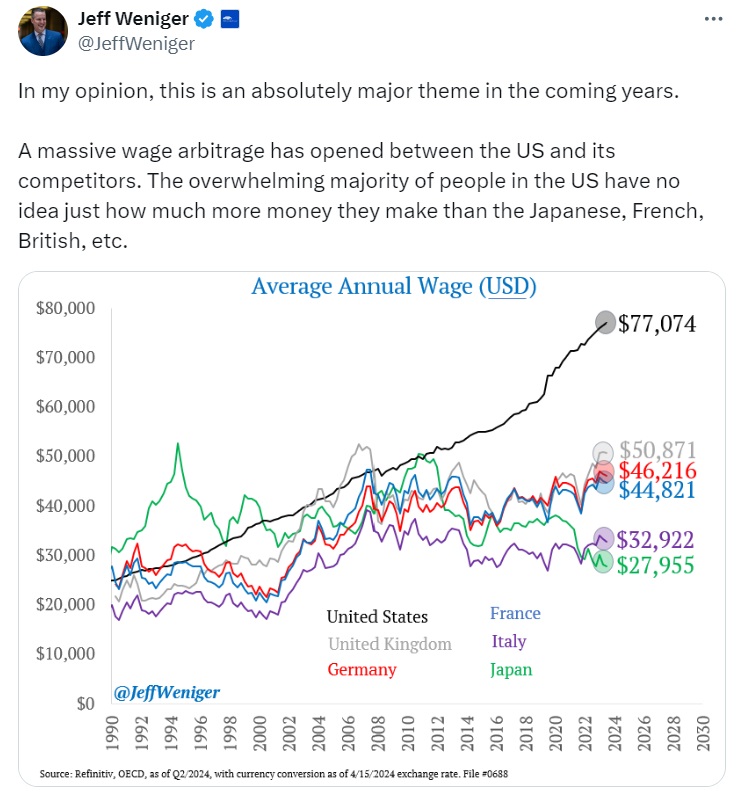
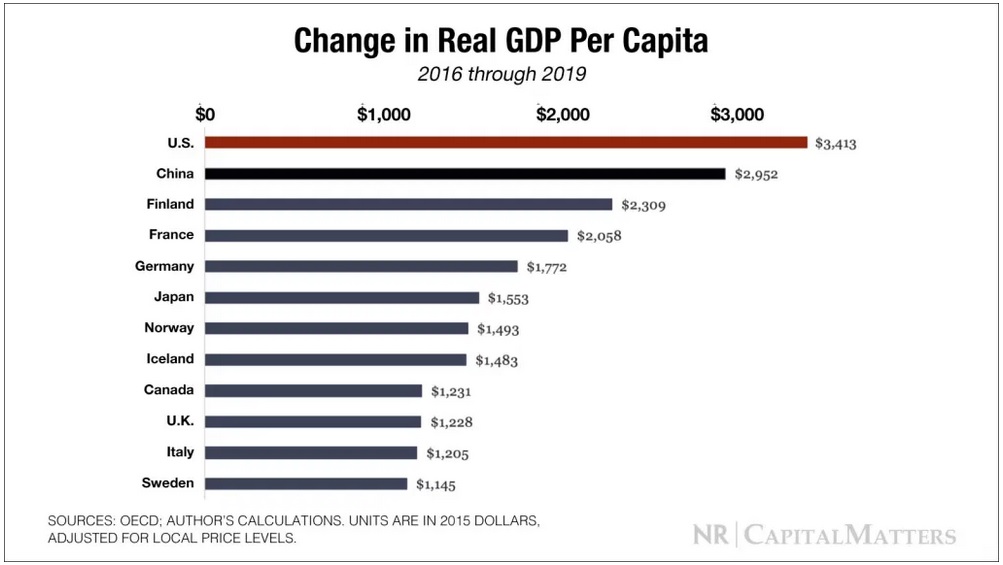
Today, let’s look at another example, courtesy of a tweet by Jeff Weniger.
For what it’s worth, I think the chart overstates the American advantage (unless I’m misreading, I don’t think the numbers are adjusted for purchasing power parity).
That being said, the trend lines are very consistent with other data showing faster growth in the United States.
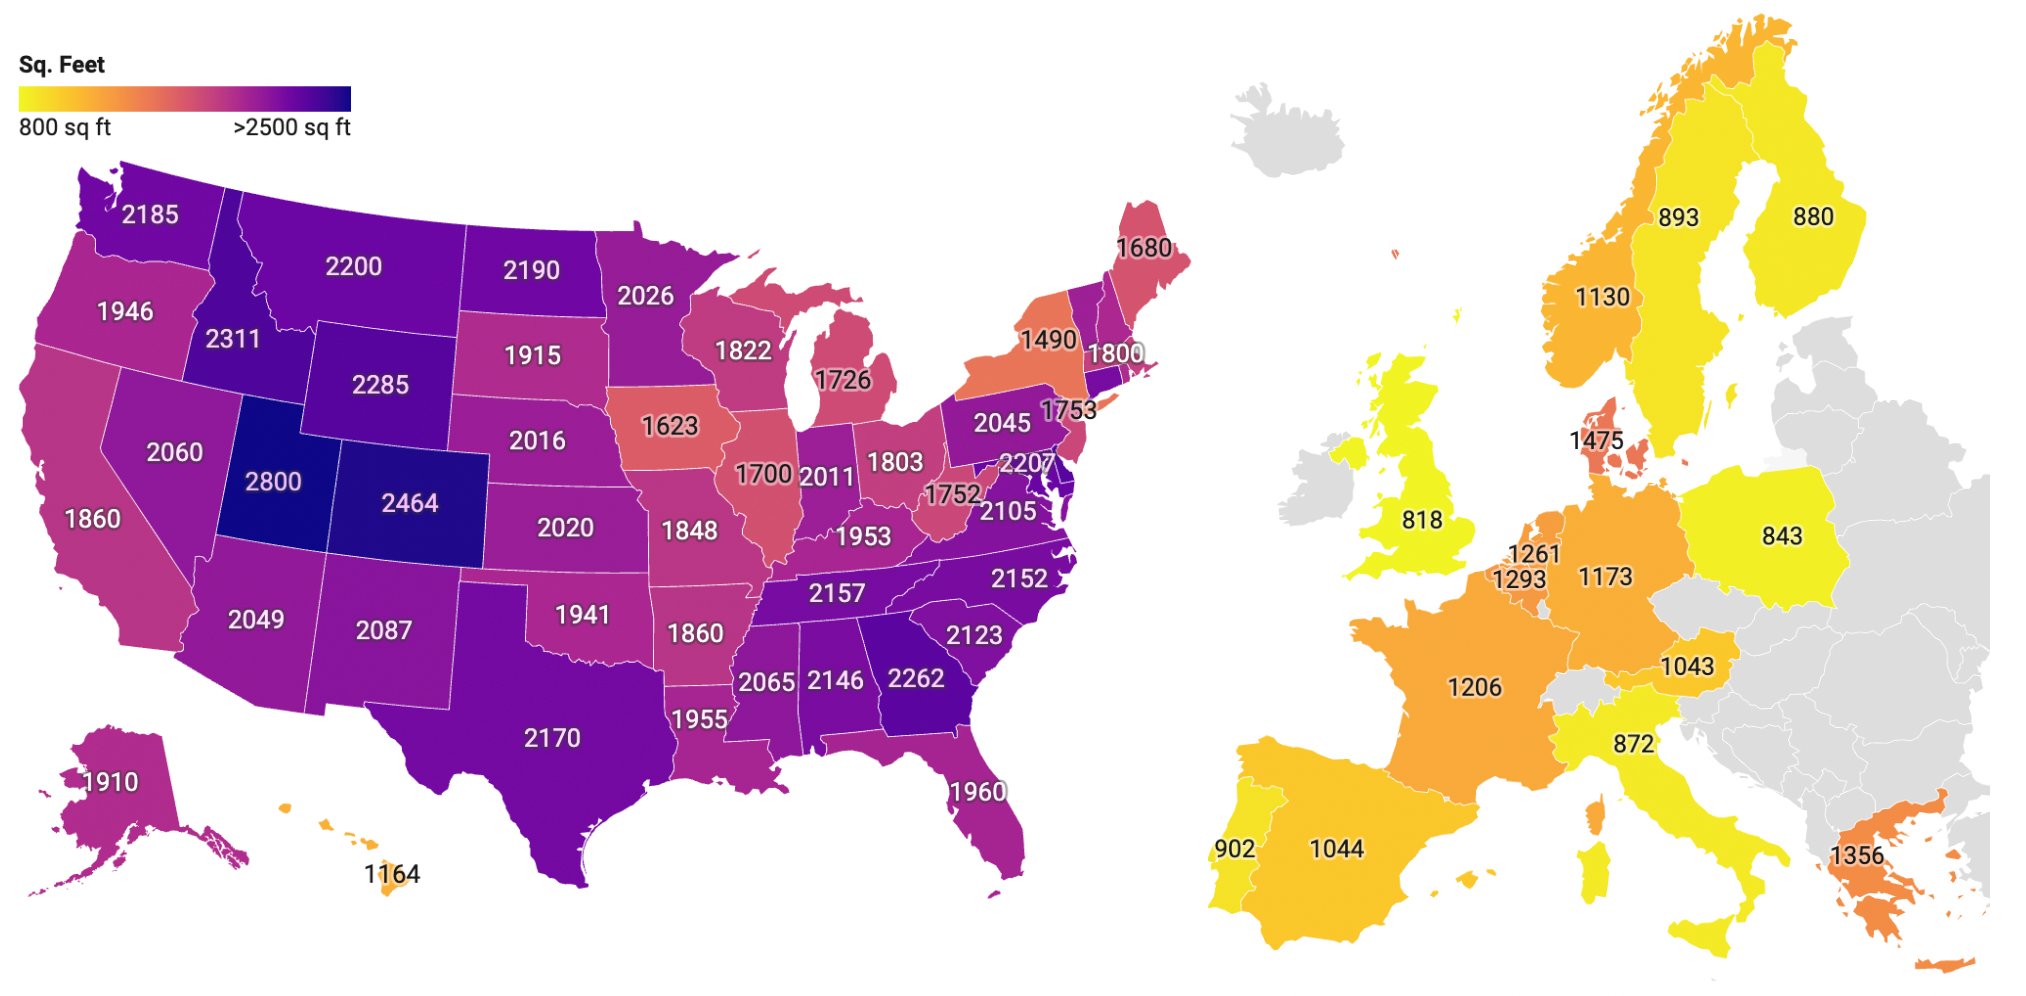
To wrap up, let’s look at a specific example of how Americans enjoy higher levels of consumption.
In this case, for housing. Here’s a map of square feet per dwelling that was shared by Prof. Garett Jones of George Mason University.
A dramatic difference, to put it mildly.
When I share this type of data with some of my left-leaning friends, they sometimes tell me that Europeans simply choose to work less and consume less because they value a better quality of life.
To illustrate the importance of higher growth rates, I sometimes inform audiences that the United States today would be as poor as Mexico if the American economy had grown 1-percentage point slower over the past 130 years.
Needless to say, I then point out that we avoided that fate because we were fortunate enough to have decent economic policy.
But I also ask people to imagine how much richer we could be if we had great economic policy (sort of like Hong Kong before China’s crackdown) rather than decent economic policy.
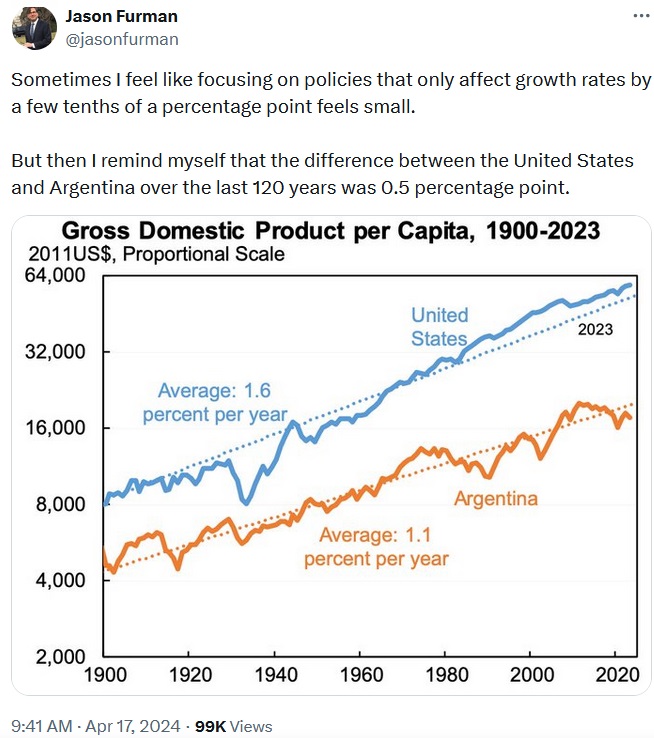
I now have a new example to share. Here’s a fascinating tweet from Jason Furman, who was Chairman of President Obama’s Council of Economic Advisers.
As you can see, it does not seem like there has been a huge difference in per-capita economic growth between the United States and Argentina. But it turns out that 0.5 percentage points actually is enormous when looking at 100-plus years of data.
If you want even more evidence about why 0.5 percentage points of growth is important, the Economistreported a few years ago that Argentina was the world’s worst-performing economy over the past century.
Yesterday’s column, based on Freedom in the 50 States, applauded New Hampshire for being the most libertarian state and the most market-oriented state.
Today, let’s look at the Economic Freedom of North America, published by the Fraser Institute, which also measures and ranks economic freedom for Canadian provinces and Mexican states.
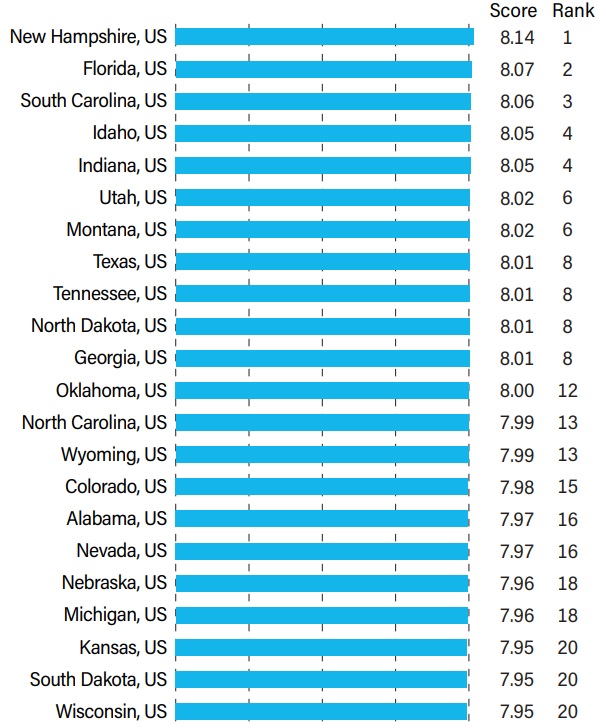
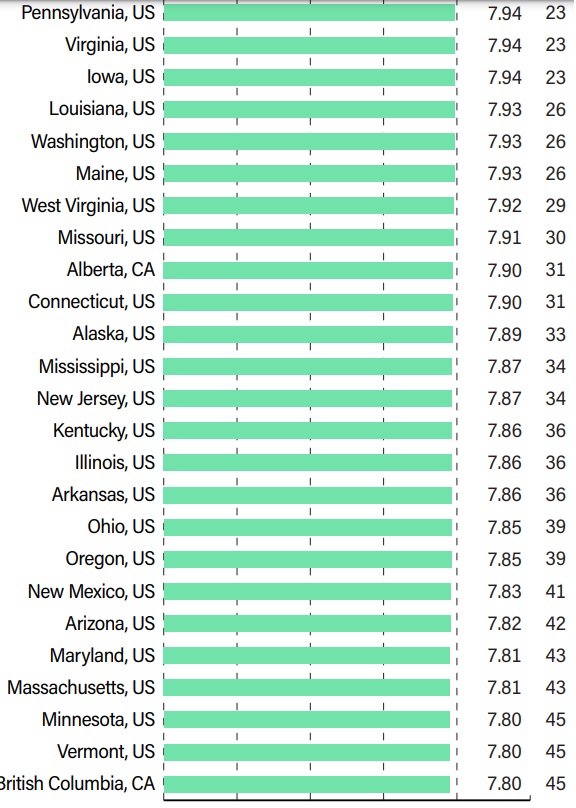
Lo and behold, the most laissez-faire jurisdiction in North America is still New Hampshire. Here are the jurisdictions (all from the USA) in the top quartile.
Here’s some analysis from the report.
The top jurisdiction in the all-government index of Economic Freedom of North America 2023 is New Hampshire at 8.14, followed by Florida (8.07), South Carolina (8.06), and then Idaho and Indiana, tied for fourth (8.05). Alberta is the highest-ranking Canadian province, tied for 31st place with a score of 7.90. The next highest Canadian province is British Columbia in 45th at 7.80. Alberta had spent seven years at the top of the index but fell out of the top spot in the 2018 report (reflecting 2016 data) and has fallen further to outside the top 20 since then. For the first time, we have made a preliminary attempt to include the US territory of Puerto Rico in the US all-government index. Puerto Rico ranks 61st at 6.65, 0.82 below the lowest-ranked Canadian province and only 0.08 above the highest-ranked Mexican state. The highest-ranked of the 32 Mexican states are Baja California and Chihuahua with 6.62, followed by Nayarit (6.57), Baja California (6.56), Yucatan (6.53), and Tlaxcala (6.52). They are nearly a full point behind those ranking lowest in Canada and the United States. The lowest-ranked Mexican state is Ciudad de México at 5.55, followed by Colima at 5.88, and Campeche at 6.02.
Here are the jurisdictions in the second quartile.
You’ll notice that Alberta is the highest-ranked Canadian province, ranking between Missouri and Connecticut.
British Columbia has squeaks into the second quartile.
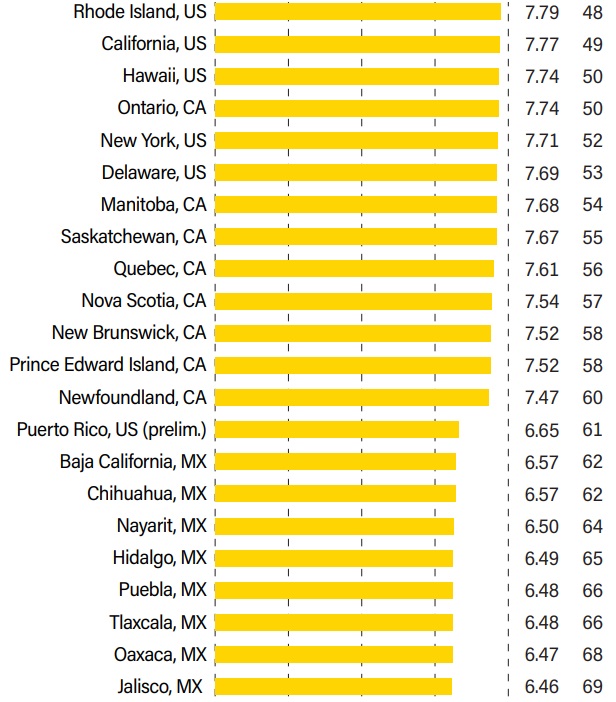
Here’s some more analysis from the report.
Seven of the Canadian provinces are ranked behind all 50 US states. Newfoundland & Labrador is 60th with a score of 7.47, just behind Prince Edward Island and New Brunswick (7.52), and Nova Scotia (7.54). The lowest ranked of the United States are Delaware (53rd, 7.69), New York (52nd, 7.71), and Hawaii (tied for 50th, 7.74). Historically, average economic freedom in all three countries peaked in 2004 at 7.75 then fell steadily to 7.27 in 2011. Canadian provinces saw the smallest decline, only 0.24, whereas the decline in the United States was 0.45 and, in Mexico, 0.59. Average economic freedom in North America had risen slowly to 7.46 by 2017 but still remained below that 2004 peak. (Canada was an outlier in that period, seeing a steady decline since 2014.) Since 2017, average economic freedom has fallen further to 7.32. The vast majority of that decline occurred in 2020, which reflects the government response to the COVID-19 pandemic.
Here’s the third quartile, showing the worst American states (sarcastic congratulations to Delaware, with New York, Hawaii, and California also receiving dismal scores).
I won’t bother sharing the last quartile since it is noting but Mexican states.
Economic policy in North America is determined by a combination of national policies and sub-national policies, so EFNA also crunches the numbers so you can see how sub-national governments perform on the policies they control.
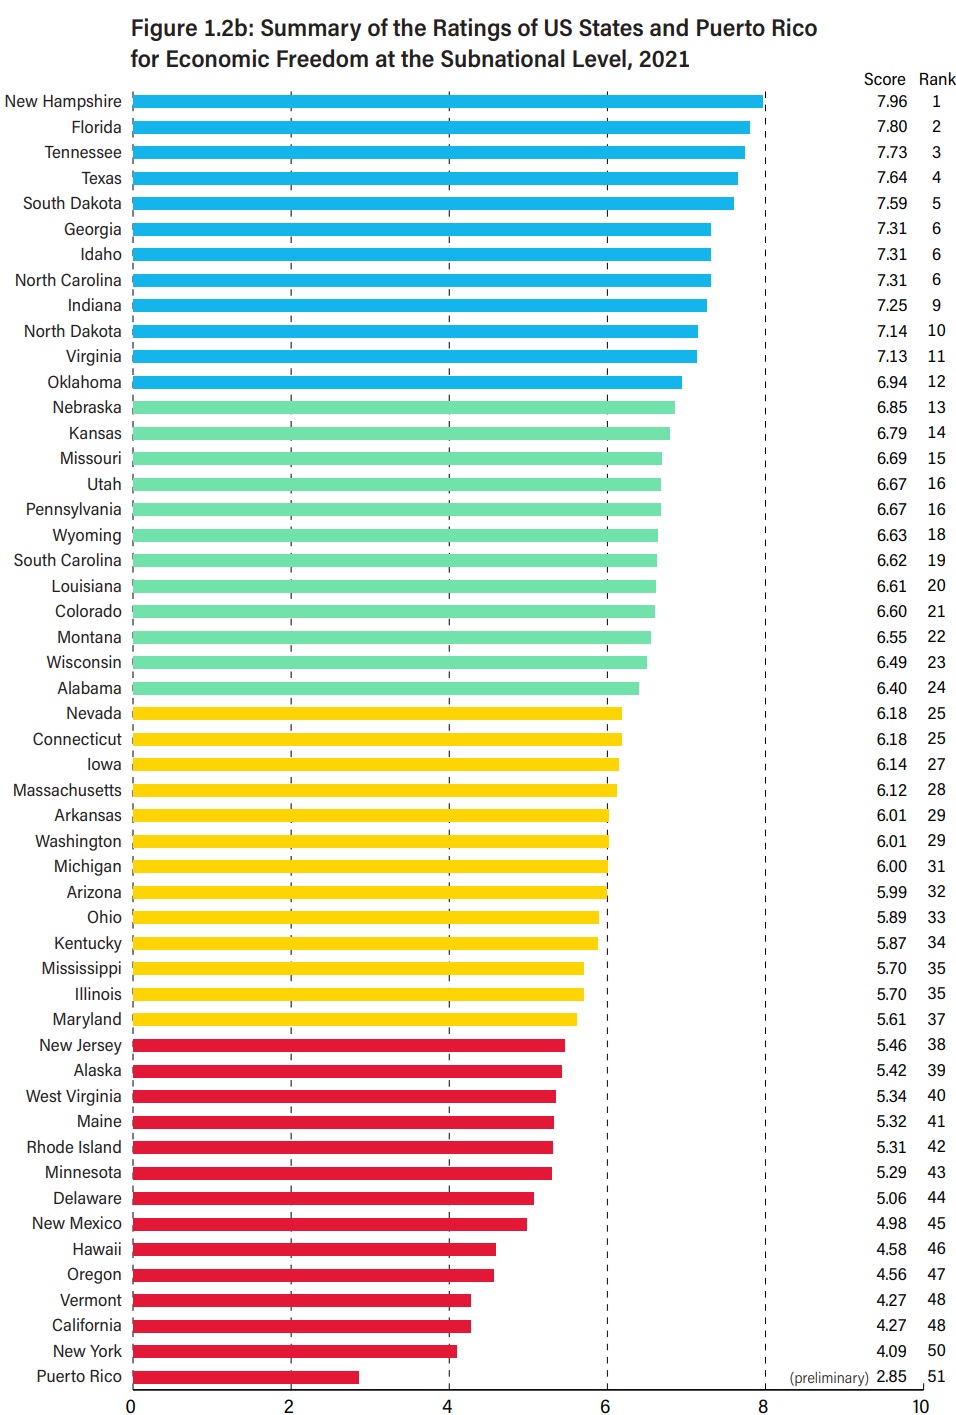
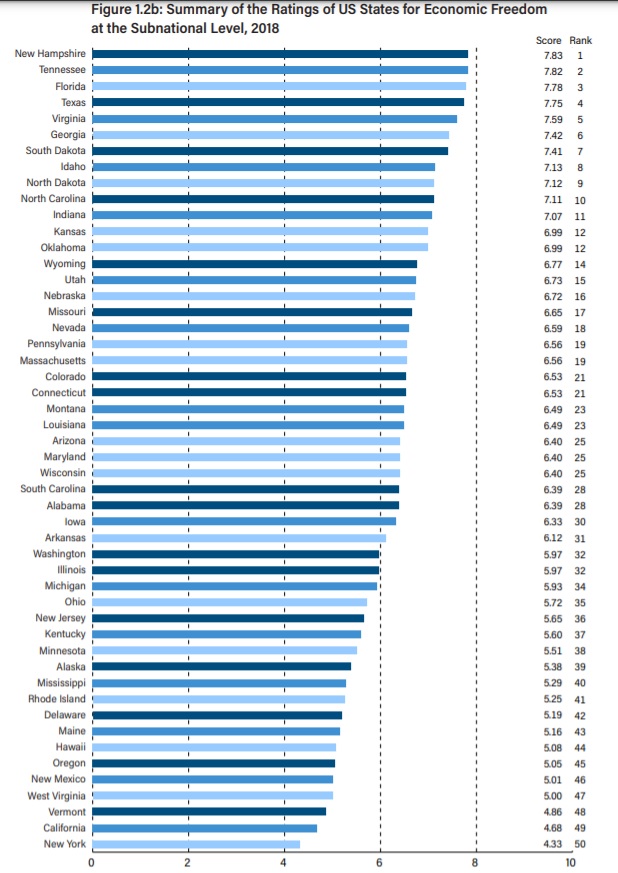
For comparisons of jurisdictions within the same country, the subnational indices are most appropriate. Figures 1.2a, 12b, and 1.2c show the subnational indices for Canada, the United States, and Mexico. Because much of the new government spending in response to the COVID-19 pandemic was done at the federal level, we did not see a decline in the subnational averages for Canada and the United States… Figure 1.2b (p. 8) shows the subnational scores for the US states. New Hampshire (7.96) returned to the top spot. Florida fell to second with 7.80, followed by Tennessee (7.73), Texas (7.64), and South Dakota (7.59).2 The least-free state was again New York with 4.09, well behind California and Vermont (4.27), Oregon (4.56), Hawaii (4.58), and New Mexico (4.98).
Since nearly 80 percent of readers are American, I’ll share the data for the United States.
New Hampshire and Florida claim that top-two spots, but there are somewhat significant differences for other states (South Carolina, for instance, falls from #3 to #19).
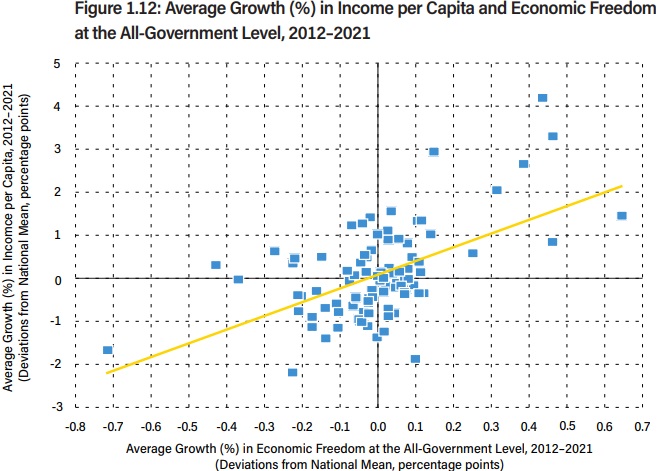
Let’s close by looking at one final visual from the study.
All of the above images merely show rankings for economic liberty.
Our last image shows that economic liberty has very significant correlation with growth in per-capita income.
In economics, convergence theory is the common-sense observation that poor countries – in general – should grow faster than rich countries.
But a general principle sometimes has exceptions, and that’s why I put together my anti-convergence club. If you look at members of that club, you’ll notice that when rich countries grow faster than poor countries, the common theme is that the rich nation is much more market-oriented than the poor country.
One example I cite (over and over and over again) is that the United States is richer than the average of countries in the European Union – yet the US routinely enjoys faster growth.
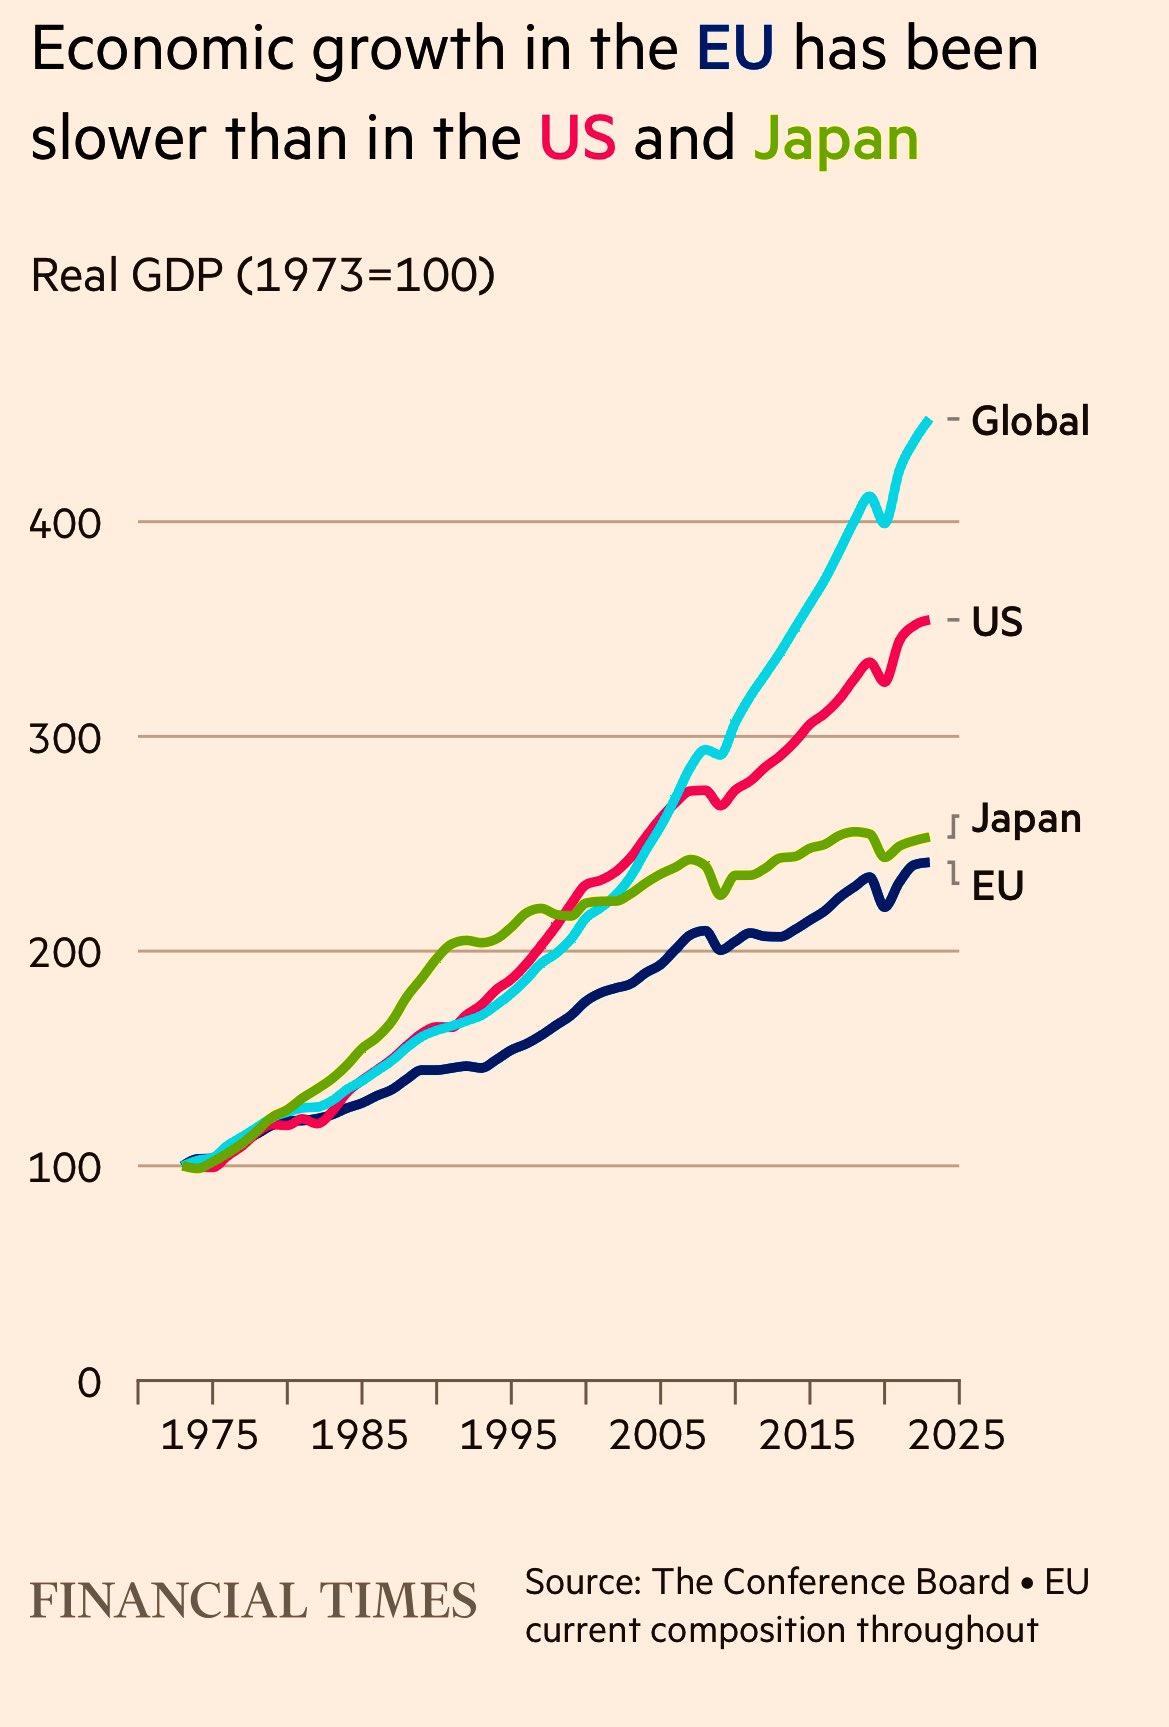
Today, we’ll add to our body of evidence. Let’s look at some charts put together by the UK-based Financial Times, which were recently shared on X.
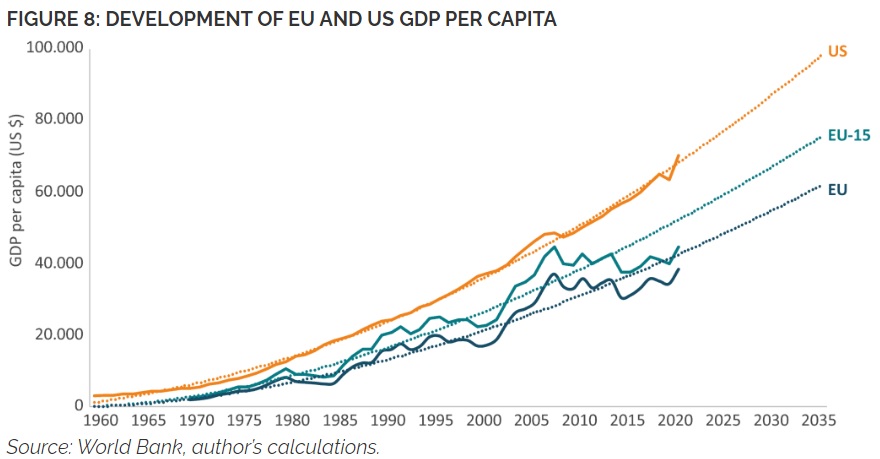
First, we have a chart showing that economic output has expanded faster in the US than the EU since the mid-1970s.
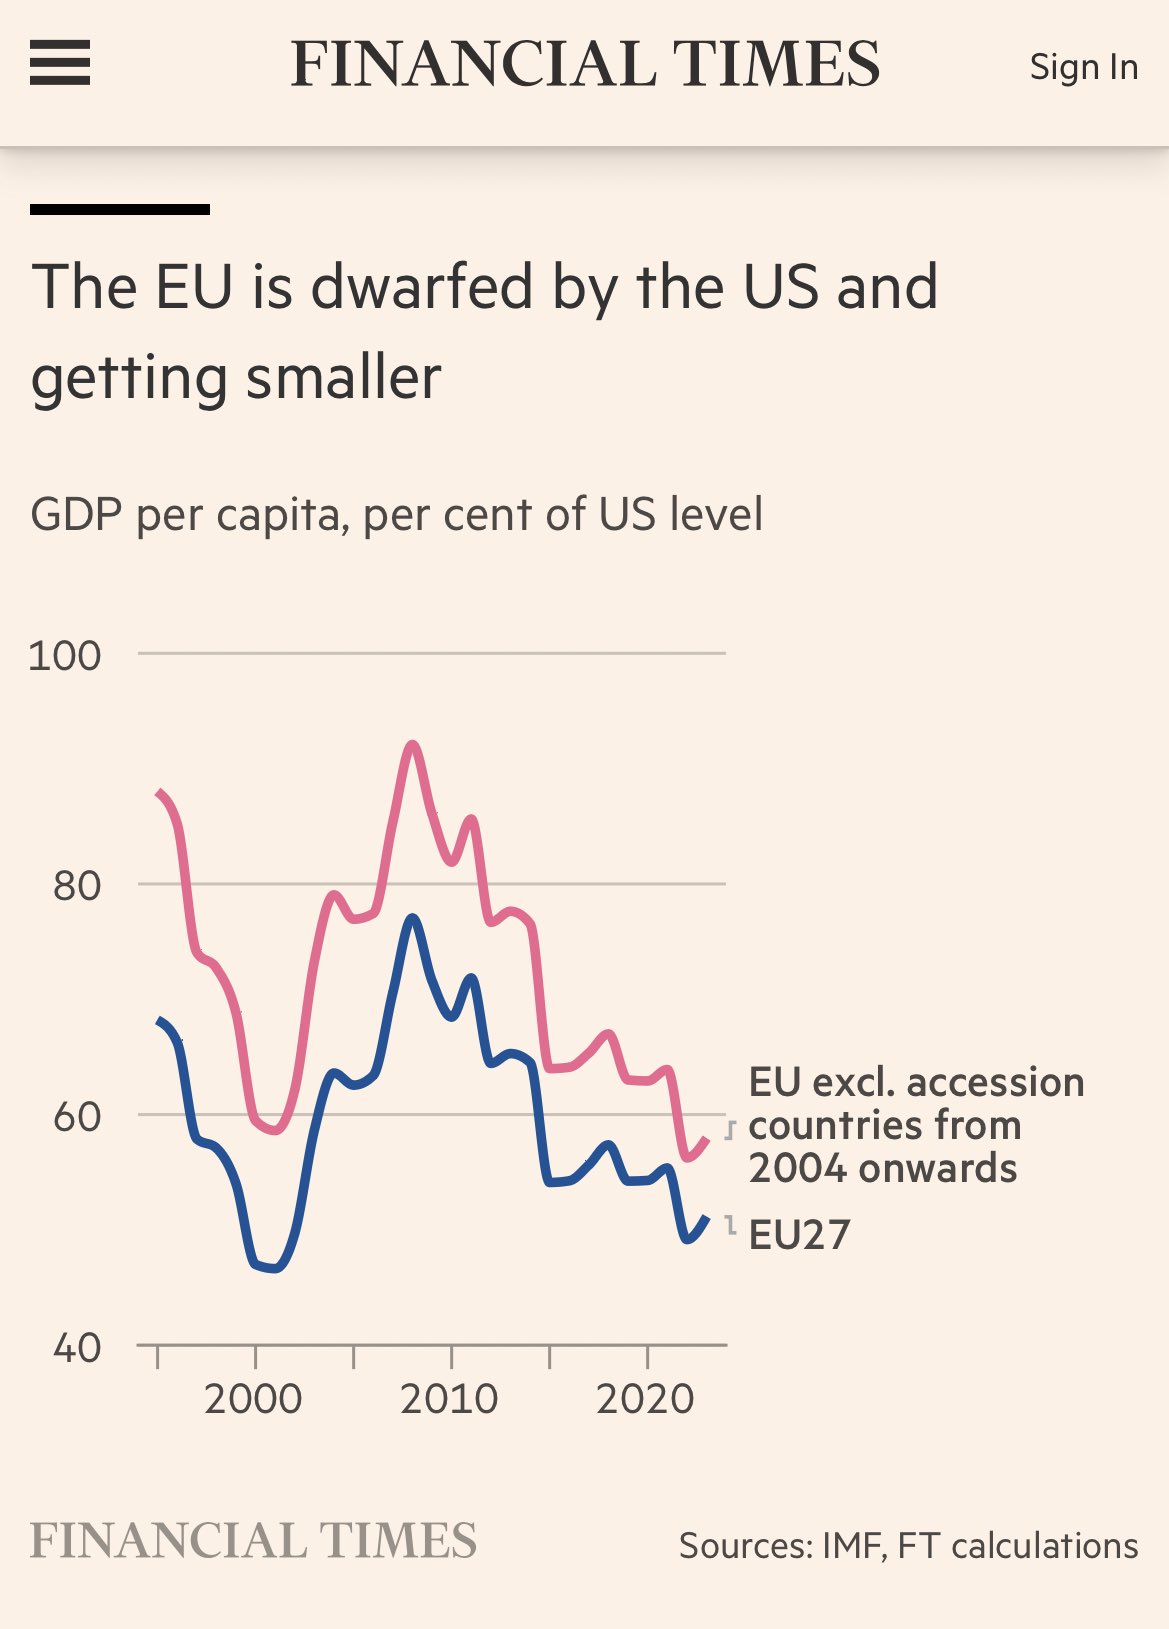
It’s per-capita GDP that really matters, and our second chart shows that the United States does much better on that measure – and that the gap is getting bigger, whether looking at all EU nations or just the ones in Western Europe.
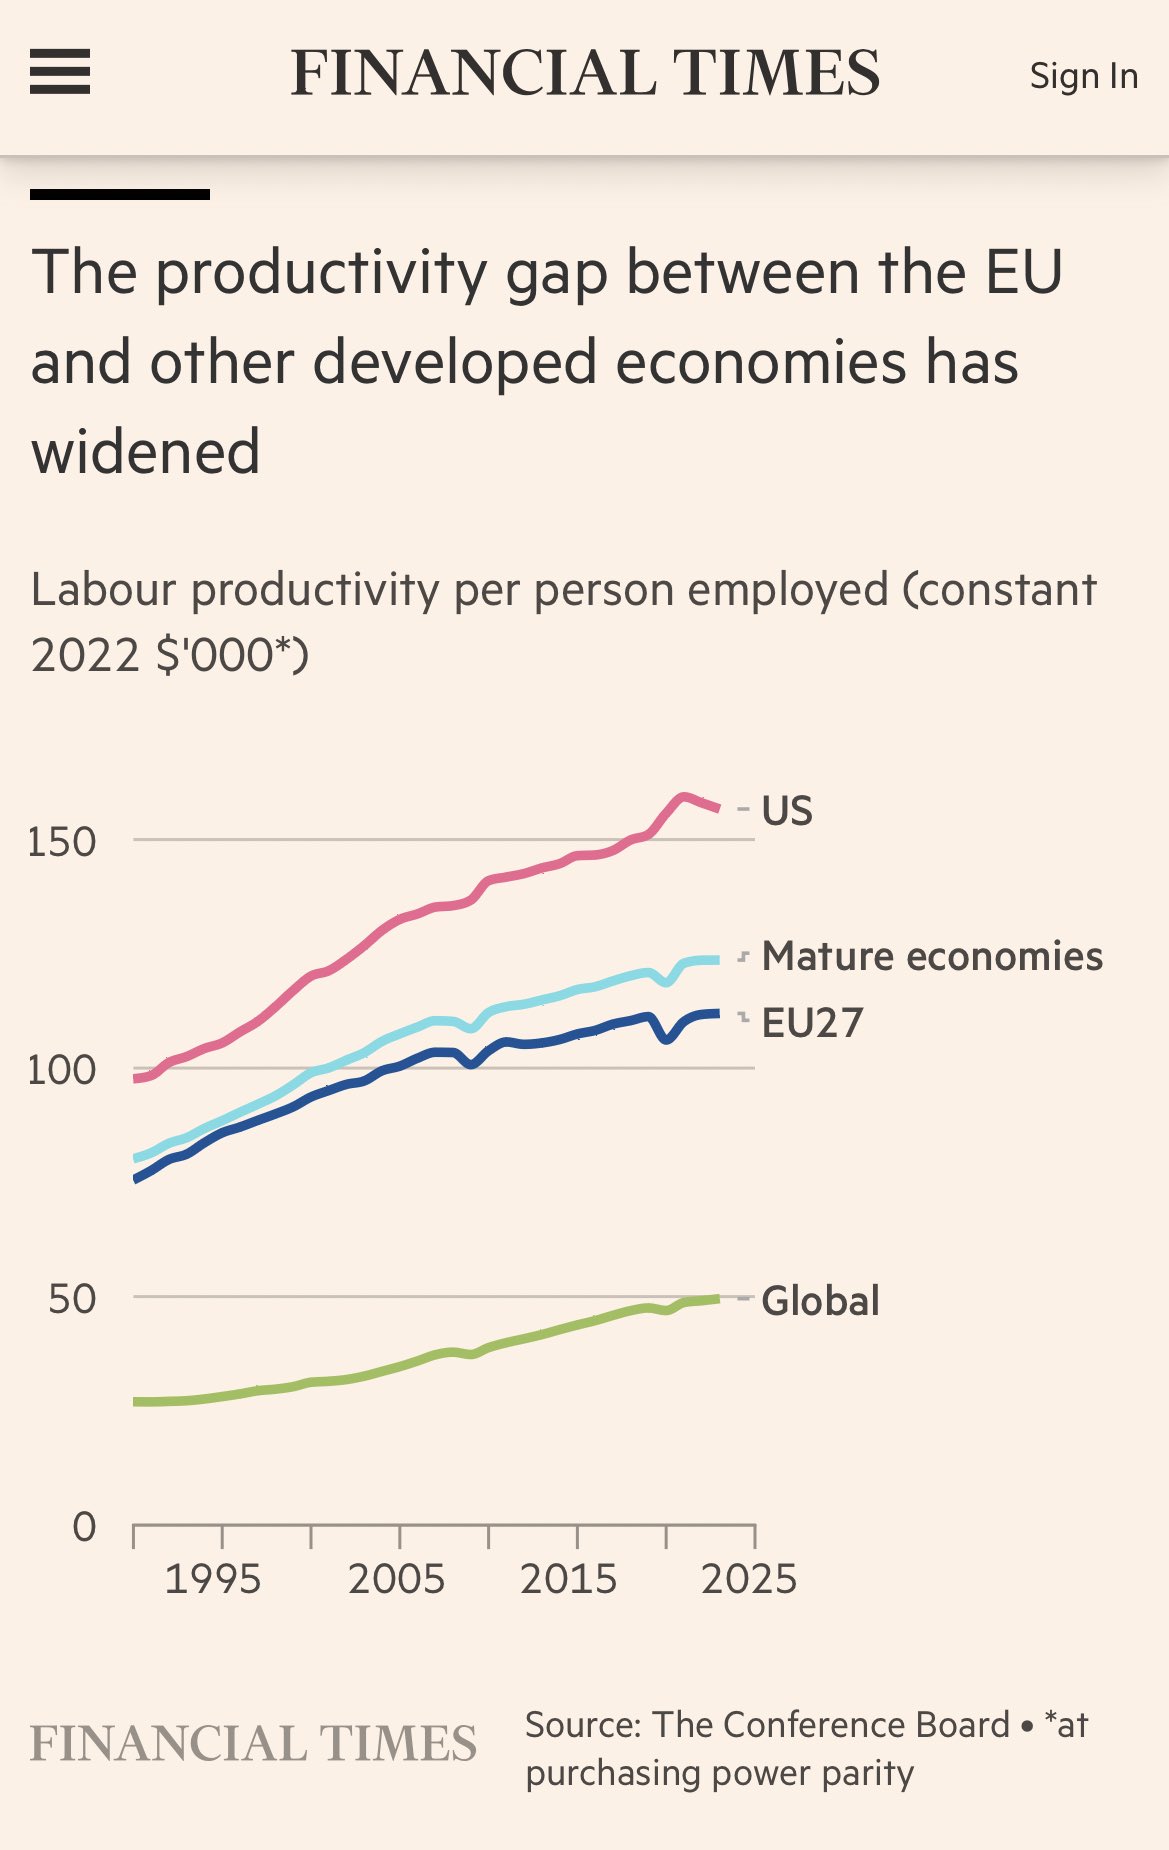
What drives prosperity is productivity, and that’s another area where the United States is diverging from European Union countries.
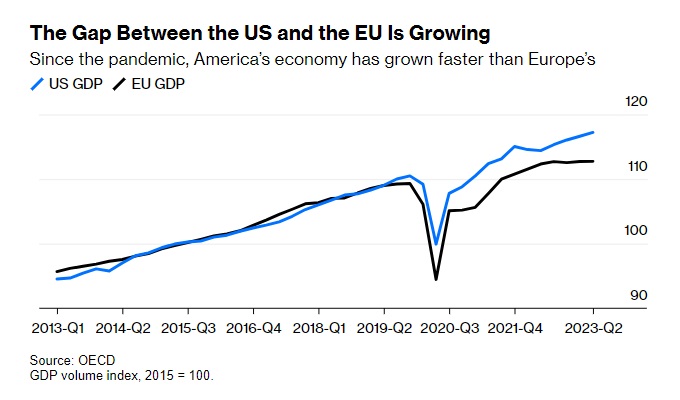
Here’s another chart that was shared on X. It shows the past 10 years.
The main takeaway is that the US has enjoyed a much stronger rebound from the pandemic.
The above chart came from a column by Professor Tyler Cowen, which was published by Bloomberg.
Here are some of his observations.
…an uncomfortable truth: The gap between the United States and the European Union is growing. …The difference between the two continents’ economies is stark. In 2013, in dollar value, the EU economy was 91% of the size of the US economy. Now that figure is about 65%. In per capita terms, US GDP now is more than twice that of the EU. …In other words: Much of Europe remains a very nice place to live. But Europe as a whole is losing influence. …a Europe striving to regain its place atop the global economy is a welcome development not just for Europeans but for small-d democrats everywhere. If only it would go about the task with a greater sense of urgency.
Tyler’s column is not solely about economics. He wants a stronger European Union because that region – to its credit – is strong on the rule of law and Western Civilization is a good thing.
But focusing on economics, I can’t resist a final comment about Tyler’s point about the EU having more urgency.
To be more specific, politicians last century created welfare states and social-insurance systems that take money from workers in order to provide pensions and health care to old people.
Those decisions were misguided (compared to market-based approaches), but the math sort of worked. After all, everyone assumed there would be population growth, meaning there would always be enough future workers to support future retirees.
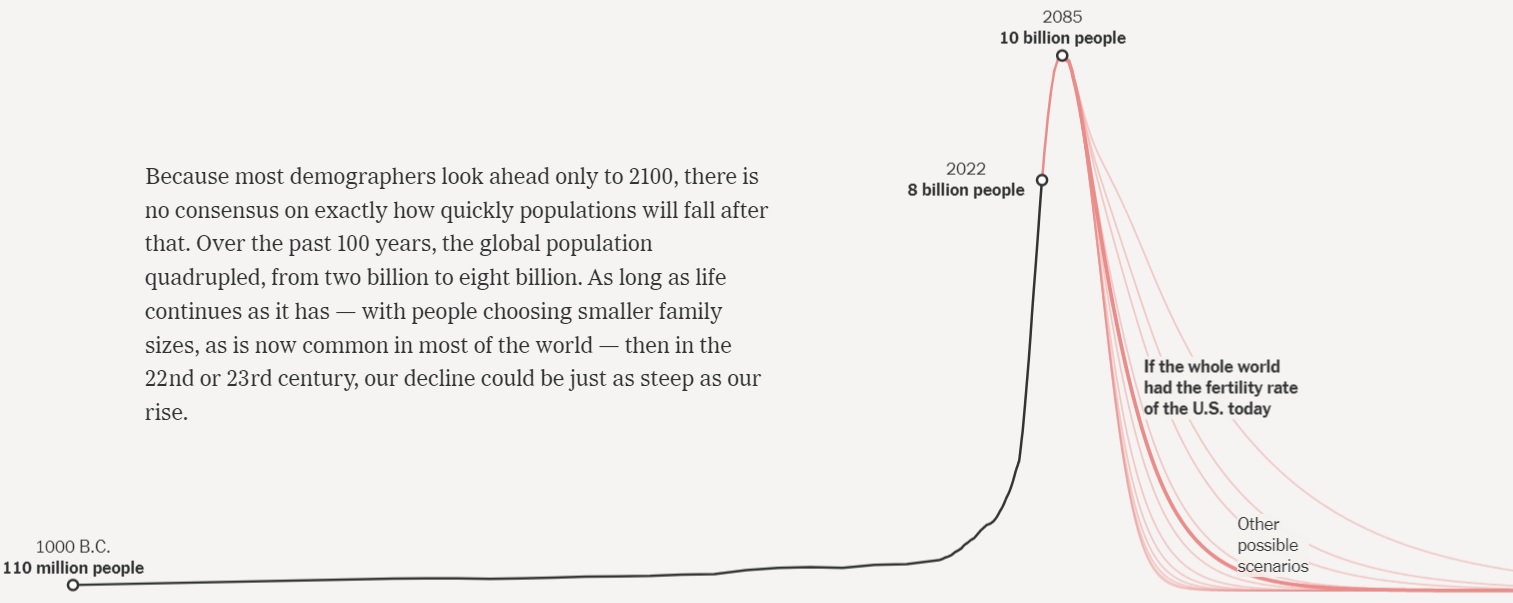
Let’s look at some data from a column in the New York Times by Dean Spears, who teaches at the University of Texas.
We’ll start with this chart showing that the world’s population will peak in 2085 and then dramatically decline.
Why will the world’s population shrink?
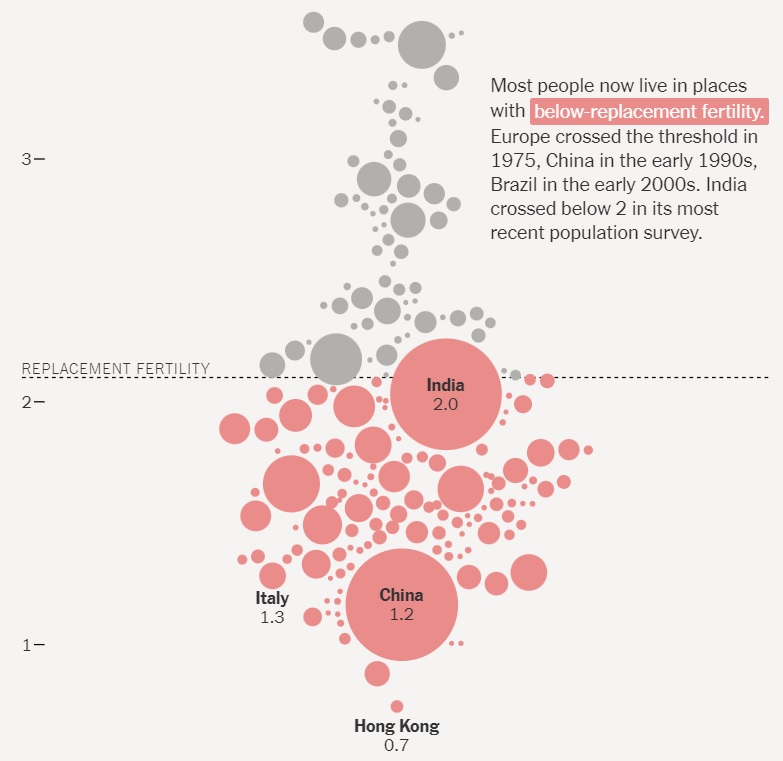
Because birthrates have plummeted. Many nations already have reached “below-replacement fertility” and others will reach that level in the near future.
There’s nothing wrong with lower levels of fertility, of course. Families should be as big or small as people want them to be.
But lower levels of fertility have a profound impact on social-insurance systems, as explained in Part I and Part II.
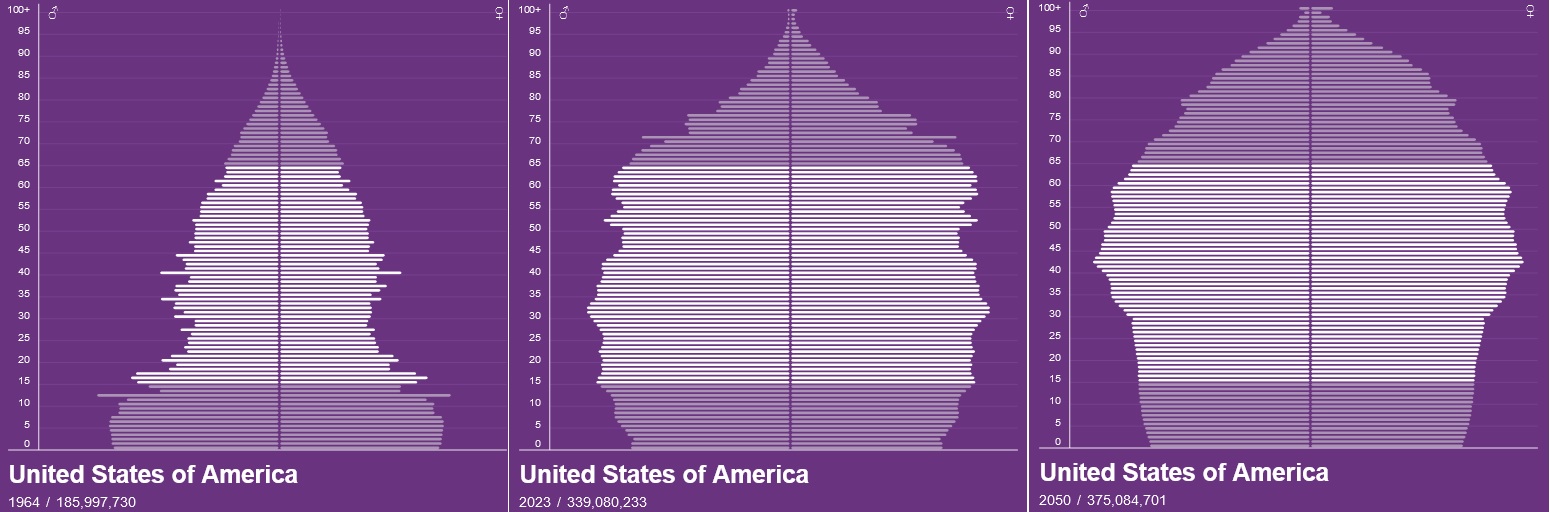
Let’s go to the Population Pyramid website and examine two countries.
We’ll start with the United States, since nearly 80 percent of my readers are American. As you can see, the USA had a population pyramid back in 1964, meaning plenty of working-age people and not that many old people to subsidize.
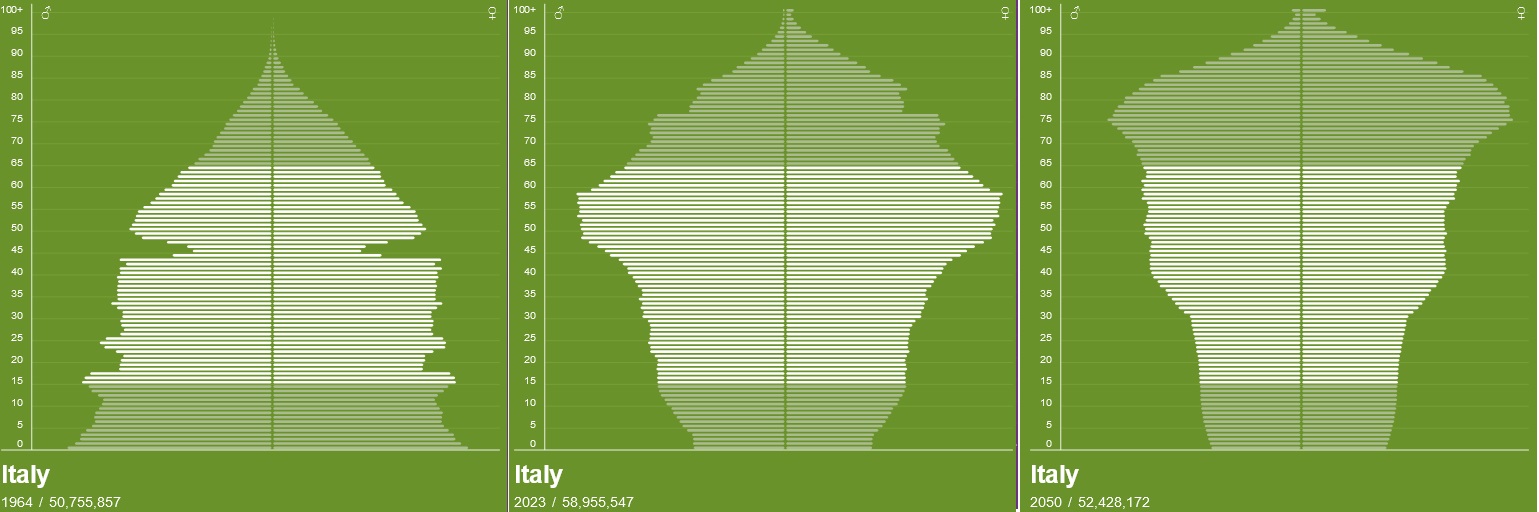
Let’s also take a look at Italy, since it is often viewed as a nation facing big demographic challenges.
The most shocking takeaway is that the population pyramid from 1964 is morphing into an upside-down pyramid.
So what can politicians do in response? There are three options.
They can try to cajole or bribe people to have more kids (i.e., more future taxpayers), but those policies don’t seem to be very effective – even in place such as Hungary.
They can impose massive tax increases on lower-income and middle-class households, which is the approach that is implicitly embraced by Trump and Biden.
In Part I of this series, we learned from a report in the Wall Street Journal that the combined economies of the European Union have grown by only 6 percent over the past 15 years compared to 82 percent growth in the United States.
For Part II, let’s look at a remarkable new study by the Brussels-based European Centre for International Political Economy.
We’ll start with this chart, which shows that the U.S. is much richer. But what’s especially noteworthy is that the gap between the U.S. and E.U. keeps widening even though convergence theory says poorer nations should grow faster than richer nations.
Given the E.U.’s dismal performance over the past 15 years, it seems like the “anti-convergence” is becoming even more pronounced.
Here is some of the analysis from the report, authored by Fredrik Erixon, Oscar Guinea, and Oscar du Roy. They start by emphasizing the importance of long-run growth.
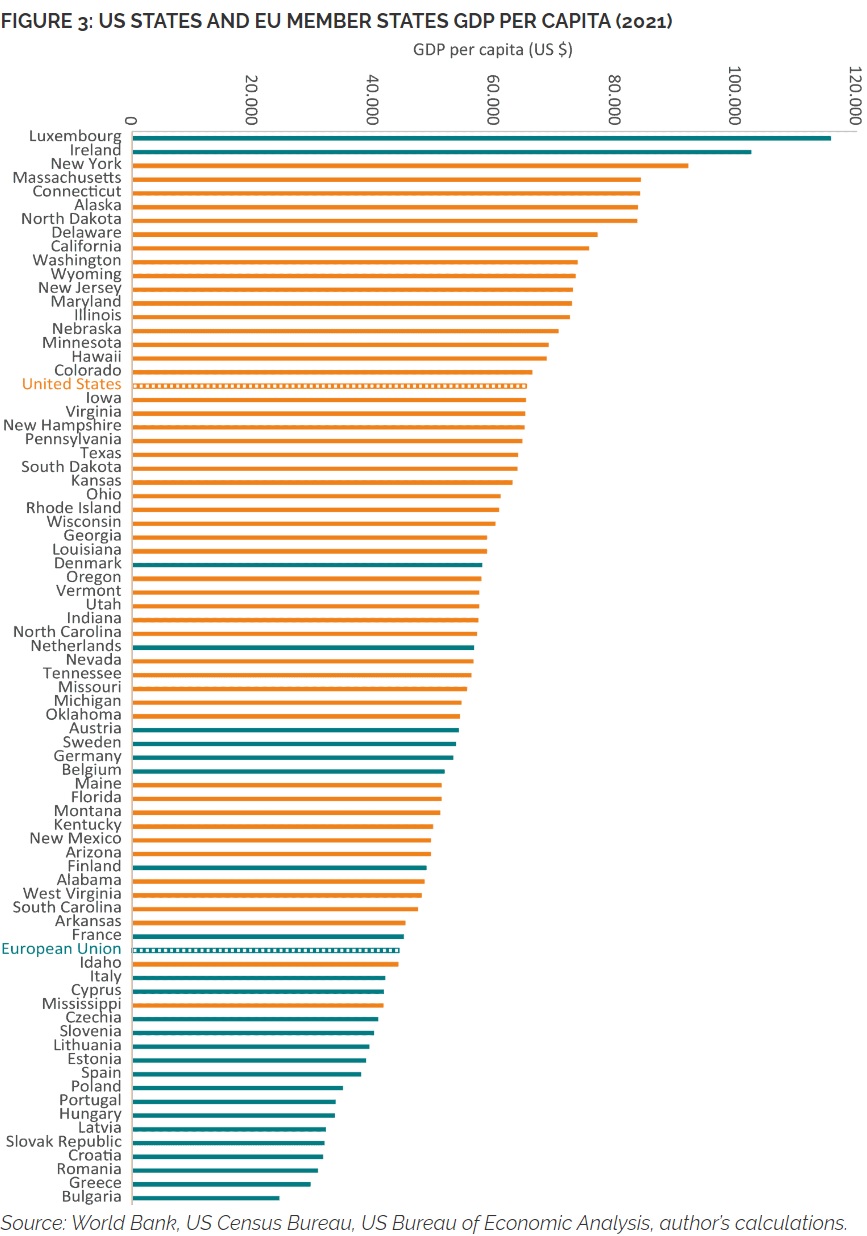
…it is the long-term trend that matters. An economy that grows at 3 percent per year will double in 24 years but an economy that grows at 1 percent per year will double only in 48 years. …If European countries were states in the United States, many of them would belong to the group of poorest… The result of this economic divergence between EU member states and US states is a growing wedge of GDP per capita between the EU and the US, which in 2021 was as large as 82 percent. If the trend continues, the prosperity gap between the average European and American in 2035 will be as big as between the average European and Indian today. …Economic growth in the Euro Area, a region that is comparable with the US, has been deeply disappointing: the region has been falling behind the US since the 1980s… At the current growth rates, it will take 20 years for output per person to double in the US, while in the EU it would take 43 years! …only two EU member states, Luxembourg and Ireland, have a GDP per capita higher than the US average.
One of the most interesting things about the report is the comparison of E.U. nations to American states.
As you can see, almost all American states rank about almost all European nations.
By the way, the above ranking is based on GDP per capita and the report notes that this approach overstates the prosperity of Luxembourg and Ireland.
…their GDP per capita overestimates their level of prosperity. In Ireland, GDP is boosted by large foreign pharmaceutical and IT multinationals based in the country which, while producing goods and services in Ireland, record a significant proportion of their global profits within Ireland. The Central Bank of Ireland estimated that Ireland should instead rank between the 8th and 12th position in the EU if the relevant parts of per capita income are considered. For Luxembourg the story is slightly different. High GDP per capita is mainly due to the cross-border flows of workers in total employment, as they contribute to overall GDP but are not residents of the country.
There is a recipe for achieving growth and prosperity and I used a grade-point-average analogy earlier this year to explain why it is important to get all the ingredients correct.
But I also groused that the United States had fallen to #25 in the rankings.
And I noted that score put America “lower than many European welfare states” because those nations “have higher fiscal burdens, but are more market-oriented in areas like trade and regulation.”
Here’s the proof.
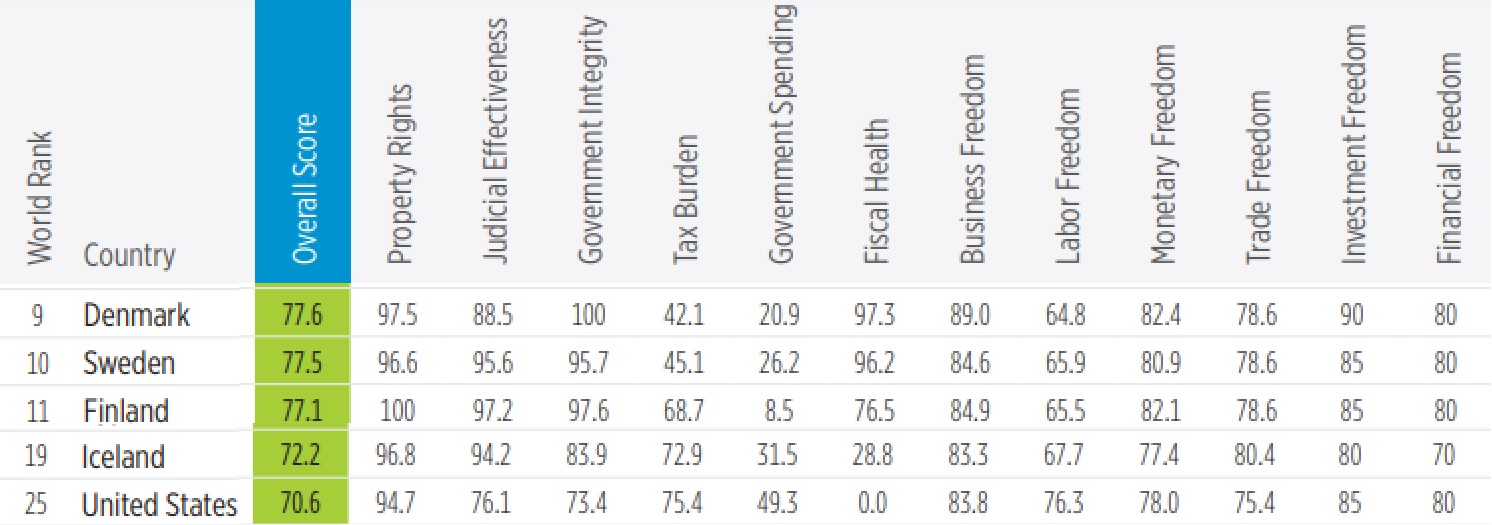
As you can see, the five Nordic nations all rank above the United States. But notice that the United States gets much better scores on “Tax Burden” and “Government Spending.”
The reason these other nation rank above the United States is that they generally get better scores in other areas. So they offset the damage of bad fiscal policy by being better than the United States for things like property rights and trade.
By the way, the United States does better if we instead look at the Fraser Institute’s Economic Freedom of the World. America is only behind Denmark when comparing overall grades for America and the Nordic nations.
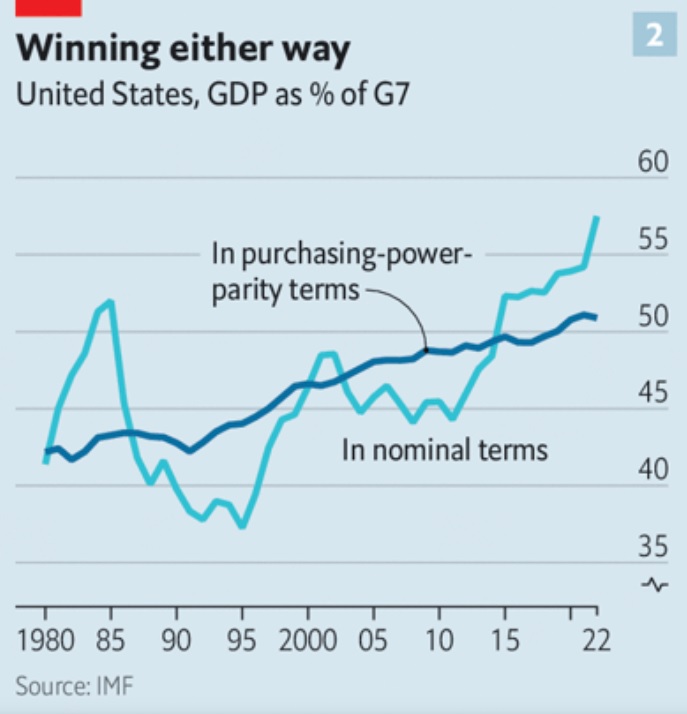
Regarding the second point, here’s a chart that was part of a tweet from Stefan Schubert. It shows that the United States is widening it lead over the other nations of the G-7 (Canada, France, Germany, Italy, Japan, and the United Kingdom).
The above chart is from the Economist, and here are some excerpts from an accompanying article.
America remains the world’s richest, most productive and most innovative big economy. By an impressive number of measures, it is leaving its peers ever further in the dust. …America’s dominance of the rich world is startling. Today it accounts for 58% of the g7’s gdp, compared with 40% in 1990. Adjusted for purchasing power, only those in über-rich petrostates and financial hubs enjoy a higher income per person. Average incomes have grown much faster than in western Europe or Japan. Also adjusted for purchasing power, they exceed $50,000 in Mississippi, America’s poorest state—higher than in France. …Americans work more hours on average than Europeans and the Japanese. …they are significantly more productive than both. …Another lesson is the value of dynamism. Starting a business is easy in America, as is restructuring it through bankruptcy. The flexibility of the labour market helps employment adapt to shifting patterns of demand.
The most important sentence in that excerpt was the one about America’s poorest state (Mississippi) being richer than France.
That’s something to share the next time you’re talking with a leftist who thinks America should “catch up” with Europe.
P.S. I can’t resist sharing one more excerpt from the article. As you can see, the Economist does not approve of Biden-Trumpprotectionism.
…more likely their politicians are to mess up the next 30 years. Although America’s openness brought prosperity for its firms and its consumers, both Mr Trump and Mr Biden have turned to protectionism.
Excellent point. Hopefully the US eventually will have someone in the White House who understands that free trade makes the country more prosperous.
Which approach is better (or, to be more accurate, less worse)?
To answer that question, you want to compare living standards. And that means looking at how much people earn, adjusted for factors such as how much they get to keep after taxes.
The United States wins that contest. Americans earn more and they get to keep more.
That’s apparent when you look at average levels of consumption on both sides of the Atlantic. And it’s even true when you compare living standards of low-income and poor Americans to living standards for average Europeans.
But what if Americans only earn more because they work longer hours? When my left-of-center friends make this argument, my usual response has been that Americans choose to work longer hours because they have better incentives (i.e., lower tax rates).
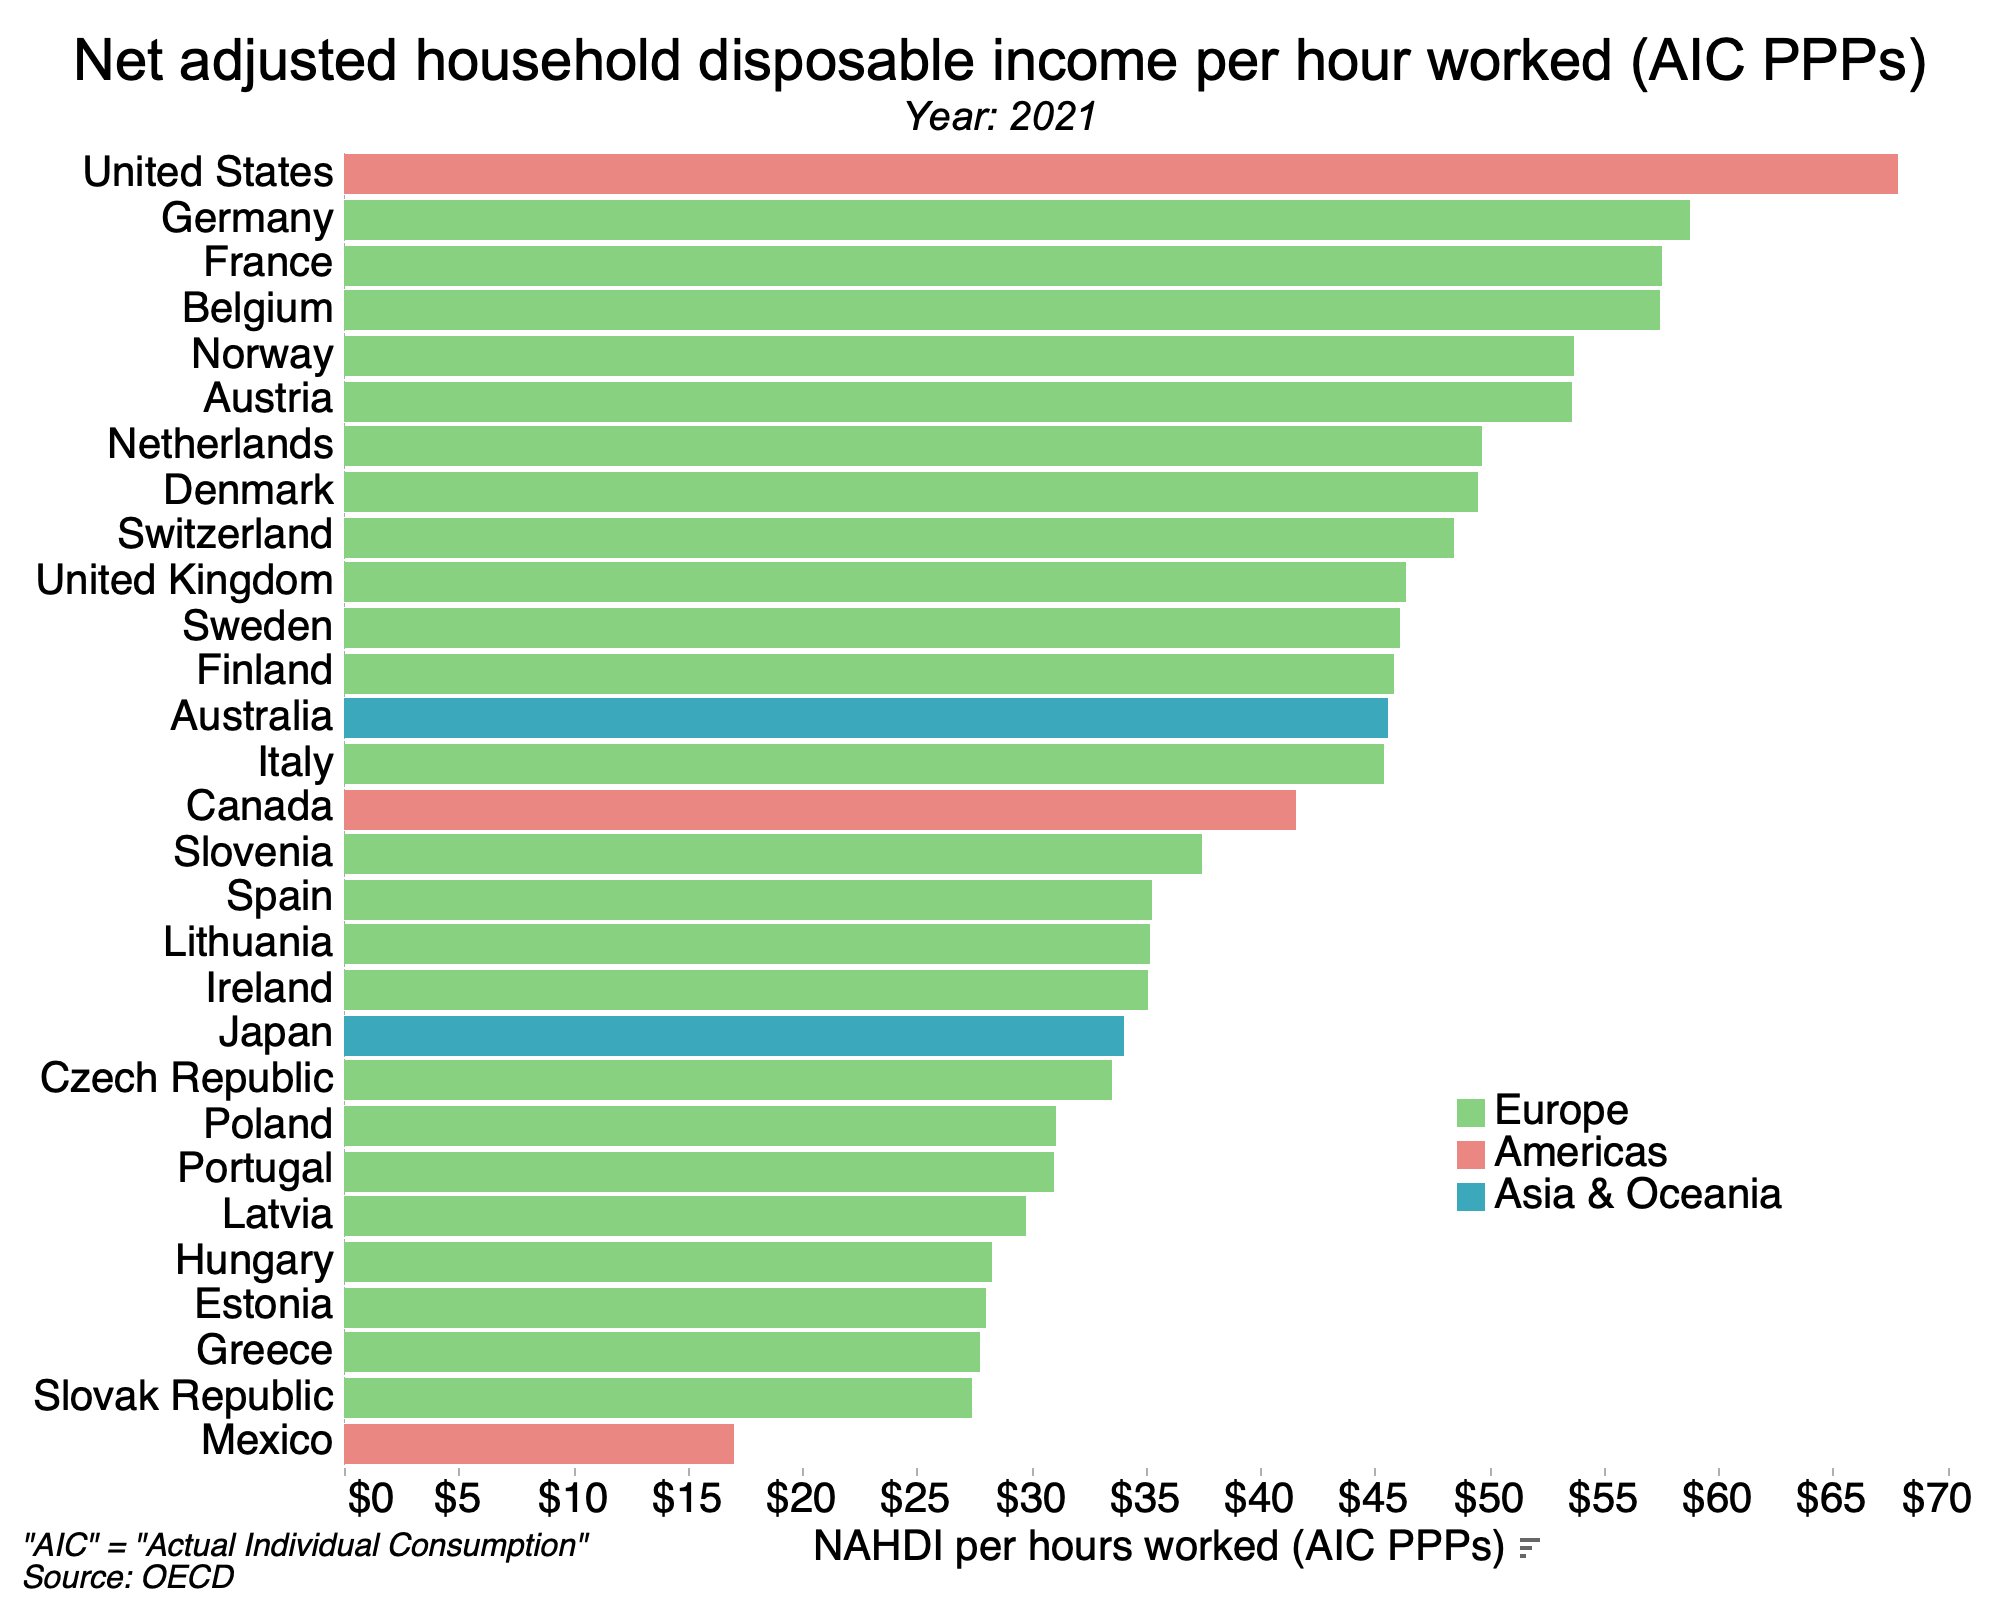
That’s true, but it’s only part of the story. Here’s some data from the Organization for Economic Cooperation and Development that was shared by Robert Orr of the Niskanen Center. It turns out that Americans also have the higher living standards on a per-hours-worked basis.
I’ll close with a big caveat about the quality of these OECD numbers. While I feel comfortable with the notion that the US ranks above Europe, some of the other countries seem too high or too low. For instance, France ranks well above Switzerland, yet other OECD data shows that per-capita GDP is more than $82,000 in Switzerland and less than $56,000 in France.
To be sure, there can be non-trivial gaps between GDP and living standards (think Ireland). And let’s not forget that the whole purpose of the above chart is to adjust for hours worked, and the French are famous for long vacations and short workweeks.
To help convince people that this is a bad outcome, I frequently share data showing how ordinary people in the United States have higher living standards than their European counterparts.
And I also like to share data showing that lower-income Americans often are better off than average-income Europeans.
Sounds convincing, right?
Well, I recently wound up in a discussion with a left-leaning fellow who claimed my data must be misleading because of the difference between “mean” and “median.”
For those not familiar with these terms, the “mean” is the overall average of a group and the “median” is the midpoint. Here are two examples that show the differences.
If you have five people making $80,000, $90,000, $100,000, $110,000, and $120,000, the “mean” income is $100,000 and the “median” income is also $100,00.
If you five people making $10,000, $20,000, $30,000, $40,000, and $300,000, the “mean” income is still $100,000 but the “median” income is only $30,000.
As you might suspect, folks on the left think the United States is like the second example – i.e., a very unequal society. They seem to think that America has high levels of “mean” income mostly because of a few really rich people.
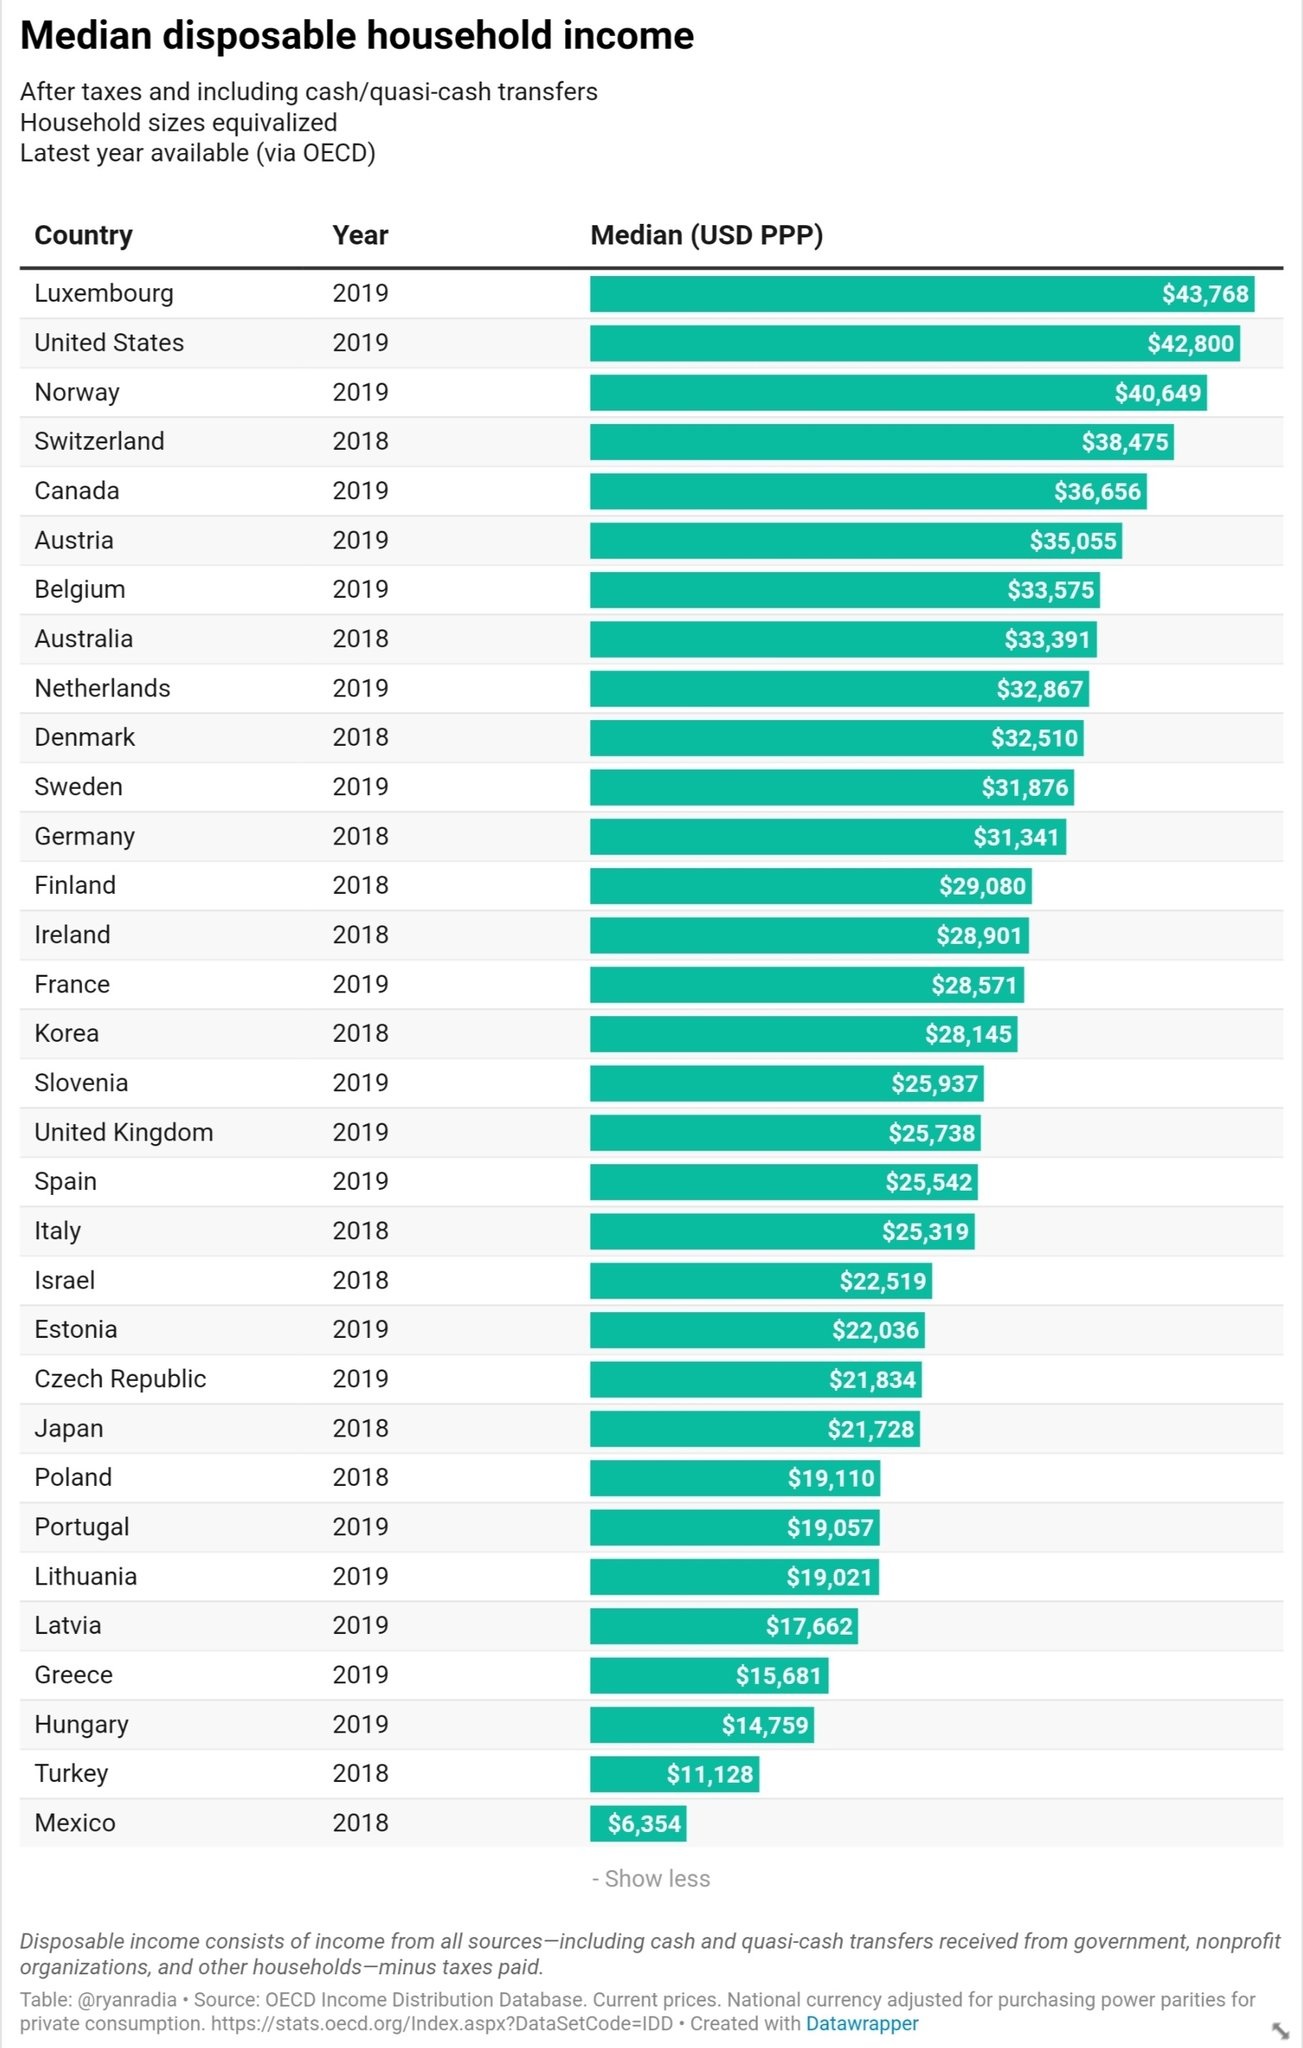
So it was fortuitous that I saw a tweet this morning that addresses this issue. Here’s a look at “median” household income in OECD nations.
Lo and behold, the midpoint household in the United States is richer than almost every household in the western world.
Only the tiny tax haven of Luxembourg ranks higher than the United States. And oil-rich Norwegians are the only others who are close.
The bottom line is that Americans are richer than Europeans, no matter how the data is sliced. And the U.S. advantage almost surely is the result of having more economic freedom and smaller government.
But if we no longer have better policy in the United States, there’s no reason to think that Americans will continue to be more prosperous.
P.S. Based on data from some Nordic nations, I’m guessing Norwegian-Americans and Luxembourg-Americans are far richer than their cousins back in Europe.
I’ve repeatedly pointed out that there is a relationship between national prosperity and economic liberty. And I’ve shared plenty of data showing that ordinary Americans have significantly higher living standards that their counterparts on the other side of the Atlantic Ocean.
So why “catch up” with countries that are lagging behind?
One of my favorite ways of illustrating the gap is the “actual individual consumption” data from the Paris-based Organization for Economic Cooperation and Development.
Here are the latest numbers, with show that the United States is more than 50 percent above the average for OECD nations.
Many people are stunned by the data I shared early last year showing that ordinary people in the United States tend to be much richer than their peers in advanced European nations.
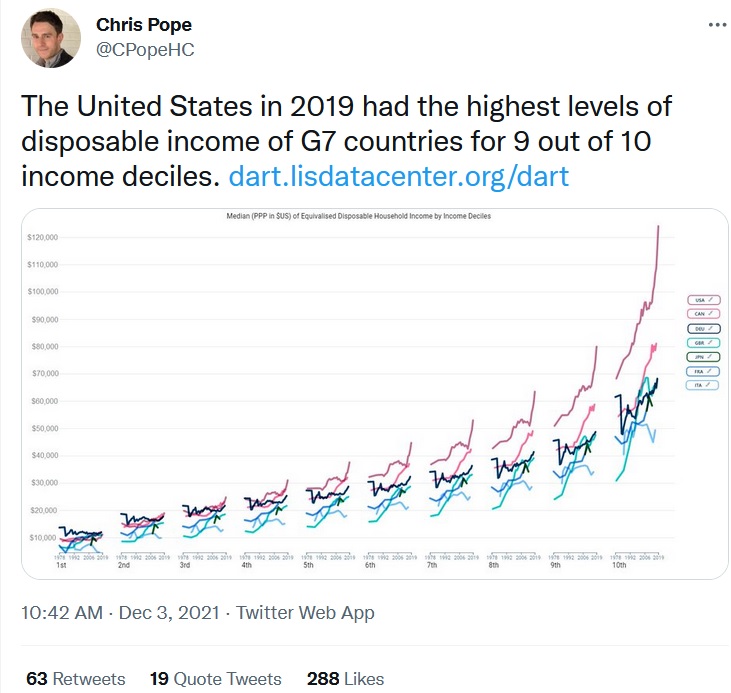
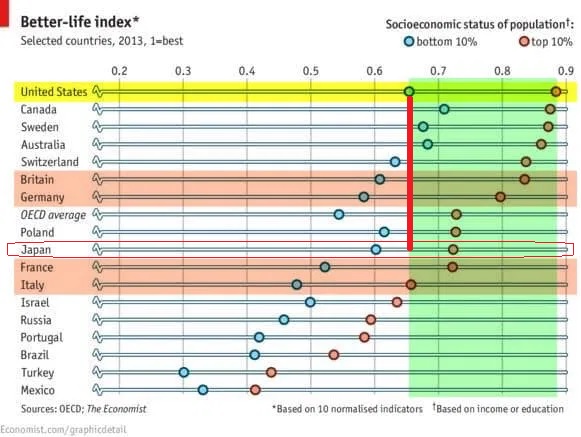
Here’s some more evidence, courtesy of the Manhattan Institute’s Chris Pope.
As you can see, the poorest people in America are about equal to the poorest people in Germany, France, Canada, and the United Kingdom, but Americans are ahead of their peers when looking at the top 90 percent of the population.
For the top 70 percent, Americans are comfortably ahead.
But not everybody agrees.
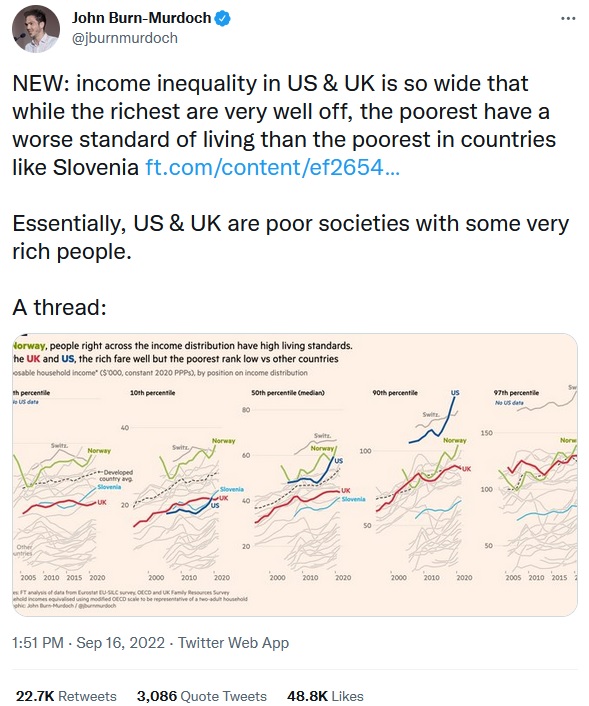
Here’s a tweet from John Burn-Murdoch of the U.K.-based Financial Times. He has a very negative portrayal of the United States (and the United Kingdom).
The tweet from Burn-Murdoch includes a link to an article he wrote.
Here are some excerpts.
…one good way to evaluate which countries are better places to live than others is to ask: is life good for everyone there, or is it only good for rich people? …If you’re a proud Brit or American, you may want to look away now. …Norway is a good place to live, whether you are rich or poor. …The rich in the US are exceptionally rich — the top 10 per cent have the highest top-decile disposable incomes in the world, 50 per cent above their British counterparts. But the bottom decile struggle by with a standard of living that is worse than the poorest in 14 European countries including Slovenia. …transpose Norway’s inequality gradient on to the US, and the poorest decile of Americans would be a further 40 per cent better off while the top decile would remain richer than the top of almost every other country on the planet. …Until those gradients are made less steep, the UK and US will remain poor societies with pockets of rich people.
The United States is a poor society with some very rich people?!?
Is that possibly true?
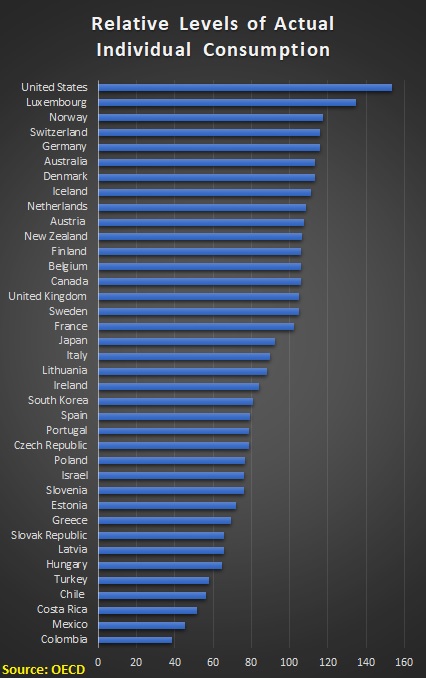
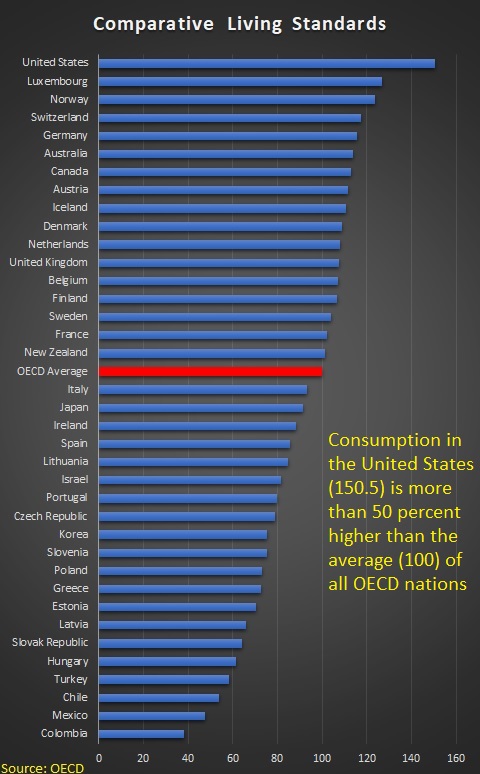
As you might expect, that is utter hogwash. Here’s a chart, based on data from the Paris-based (and left-leaning) Organization for Economic Cooperation and Development.
It shows “actual individual consumption” in the OECD’s member nations, and people in the United States are far better off than people in any other nations.
Indeed, they have 50 percent more consumption than the average person in other OECD countries.
All you need to know is that Burn-Murdoch took some data about America’s poorest people and wants to mislead readers into thinking it also applies to the general population.
And he doesn’t even show his calculations. For what it’s worth, his numbers are not very consistent with some other data sources that are publicly accessible.
Professor Noah Smith also debunks the FT‘s report.
…when we look at how Americans in the middle of the distribution are doing, we see that America is not a “poor society” at all — in fact, it’s one of the richest on Earth. …the median American has a higher income than the median resident of almost any other country… Some people argue that because European countries buy health care for their citizens via the government — which is not counted in disposable income — that it’s not fair to use disposable income as the comparison measure here. But this isn’t right. The U.S. has a relatively low percentage of out-of-pocket health spending — our employers and our government pick up most of the tab. In fact, when we look at “adjusted disposable income”, which includes the value of government services like health care, we find out that the U.S. comes out even more ahead relative to other countries. …someone at around the 18th percentile of income in America in 2019 — a working-class person on the edge of being considered poor — lived in a household making $21,400 a year. That’s about the same as the median income of households in Japan, and about 84% of the median income of households in the UK. In other words, a working-class American on the edge of poverty makes as much as a middle-class person in some rich countries.
I’ll close by noting something else that was misleading in the FT report. Burn-Murdoch compares Norway to the U.S. and U.K., but that nation’s oil wealth makes it very unrepresentative.
Since the report concludes by endorsing more redistribution, it would be more honest and appropriate to compare American living standards to the performance of Europe’s other welfare states.
But Burn-Murdoch did not do that because his already flimsy case would look even weaker.
Also, note that he did not highlight Switzerland. After all, it is richer than Norway, even though it does not enjoy abundant natural resources.
P.S. Speaking of libertarians, the Burn-Murcoch story in the Financial Times begins with this passage.
Where would you rather live? A society where the rich are extraordinarily rich and the poor are very poor, or one where the rich are merely very well off but even those on the lowest incomes also enjoy a decent standard of living? For all but the most ardent free-market libertarians, the answer would be the latter.
At the risk of stating the obvious, libertarians want a society with the smallest-possible government. Limiting coercion (the non-aggression principle) is the main motive.
Libertarians will view the resulting distribution of income as just, but they also will point out that freer societies do a much better job of generating broadly shared prosperity than government-dominated societies.
The bottom line is that Burn-Murdoch is either extraordinarily ignorant about libertarianism or he suffers from Nancy MacLean levels of bad faith and dishonesty.
For instance, the main takeaway is that the United States is uniquely individualistic, which I view as a very valuable form of societal capital (another great president shared that perspective).
Compared to most other nations, we still believe in self-reliance and individual responsibility.
Indeed, there’s even evidence that the people with those values were most likely to emigrate to the United States.
There are other points from the video that merit attention.
We’re told that Americans work more hours than people in other developed nations. That’s generally true, though it almost certainly has something to do with the heavier tax burden on labor in Europe.
Now I’m going to quibble with a few of the points in the video.
We’re told, for instance, that Americans enjoy higher income but don’t get goodies from the government such as paid parental leave.
What should have been noted, though, is that we’re richer in part because we don’t have such programs.
Likewise, the U.S. is probably the leader in developing new drugs and medical technologies in part because we don’t have government-run health care (though, given the pervasive role of Medicare, Medicaid, and the healthcare exclusion, it’s not clear whether the U.S. actually has a more market-oriented health system than many European nations).
The video points out that Americans have low voting rates. But why is that a bad thing? I like the idea of having government playing such a small role in people’s lives that many of them figure it’s not important to vote.
Last but not least, the video points out that the United States spends less than other nations on redistribution, relative to economic output. That’s true. But because per-capita economic output is much higher in America, per-person spending by government often is depressingly high. If you doubt me, check out these numbers for health and education.
P.P.S. I don’t want my left-leaning friends to feel neglected on this special day, so here’s a Declaration of Dependence to make them feel comfortable. Speaking of Dependence Day, here’s some satire from Babylon Bee.
When debating big issues such as the size and scope of government, I like to think that facts matter. Maybe I’m being naive, but people should look at evidence before deciding whether to make government bigger or smaller.
After all, if we’re going to make America more like Europe, shouldn’t we try to understand what that might mean for the well being of the citizenry?
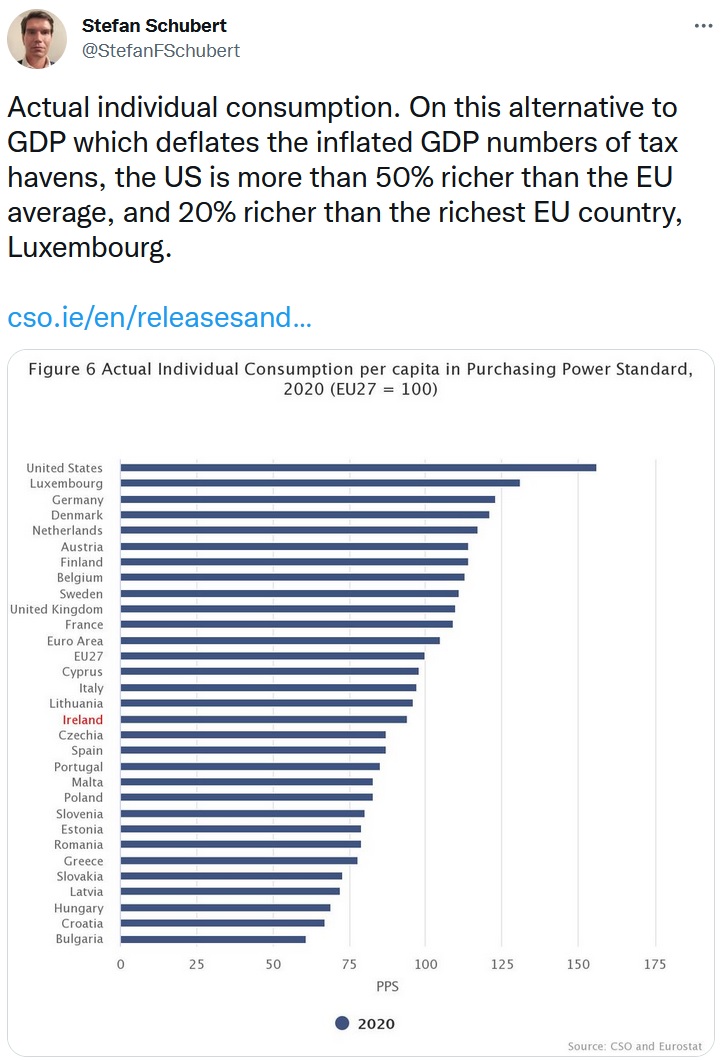
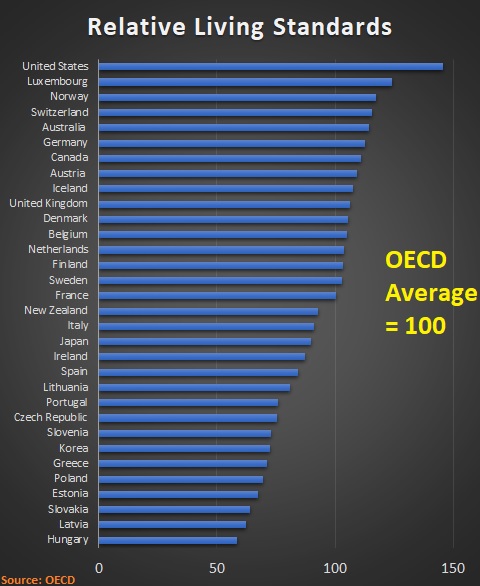
With this in mind, I want to share this tweet (based on this data) from Stefan Schubert at the London School of Economics.
The obvious takeaway is that the average person in the United States enjoys much higher living standards (more than 50 percent higher) than the average person in the European Union.
Even more astounding, the United States even has a big 20-percent advantage of the wealthy tax haven of Luxembourg.
By the way, the above data may understate the gap if you make apples-to-apples comparisons.
Nima Sanandaji compared the economic output of Scandinavians who emigrated to the United States with Scandinavians who stayed home.
He found even bigger gaps, one example of which is the data about Swedes in this chart.
The only good news for Europeans (if we’re grading on a curve) is that there’s been a decline in both the relative and absolute levels of economic freedom in the United States during the 21st century.
If that continues, the U.S. may “catch up” to Europe at some point in the future. Joe Biden certainly is working for that outcome.
When I compare the United States and Europe, it’s usually because I want to make the point that people on the other side of the Atlantic have lower living standards in large part because there is a more onerous fiscal burden of government.
But I also use US-vs.-Europe comparisons to make another point, namely that big welfare states mean big tax burdens for lower-income and middle-class households.
Yes, European politicians impose onerous burdens on upper-income taxpayers, but there simply are not nearly enough rich people to finance big government.
So those politicians have responded by pillaging everyone else as well (onerous payroll taxes, harsh value-added taxes, high income tax rates on modest incomes, etc).
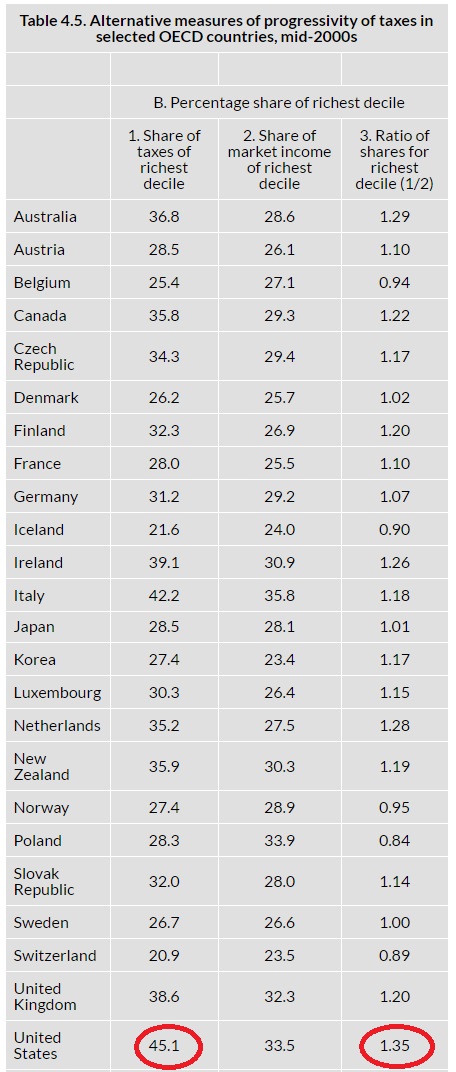
The United States takes a different approach. We also impose onerous burdens on upper-income taxpayers (as confirmed by IRS data), but we impose comparatively modest taxes on everyone else.
Indeed, the net result, as shown in the table, is that the United States actually has the most “progressive” tax system among OECD nations.
Today, let’s look at some research that makes similar points.
Three academics at the Paris School of Economics authored a study for the World Inequality Lab that uses a new database to measure redistribution and inequality.
Their main conclusion is that there are differences between the United States and Europe, but redistribution policies don’t have a big impact on inequality.
This article addresses…substantive and methodological issues by constructing distributional national accounts for twenty-six European countries from 1980 to 2017. To our knowledge, this is the first attempt at doing so. …our series are fully comparable with recently produced US distributional national accounts, allowing us to compare the dynamics of inequality and redistribution in the two regions in great detail. Two key findings emerge from the analysis of our new database. First, we show that, over the past four decades, inequality has increased in nearly all European countries as well as in Europe as a whole, both before and after taxes, but much less than in the United States. …Second, the main reason for Europe’s relative resistance to the rise of inequality has little to do with the direct impact of taxes and transfers. While Western and Northern European countries redistribute a larger fraction of output than the US (about 47% of national income is taxed and redistributed in Europe versus 35% in the US), the distribution of taxes and transfers does not explain the large gap between Europe and US posttax inequality levels. Quite the contrary: after accounting for all taxes and transfers, the US appears to redistribute a greater fraction of its national income to the poorest 50% than any European country.
What drives these results?
Simply stated, the most salient feature of European fiscal policy is that nations tax the middle class and have programs that benefit the middle class.
The United States, by contrast, focuses more on taxing the rich and giving benefits to the poor.
Look at what the study says about tax progressivity.
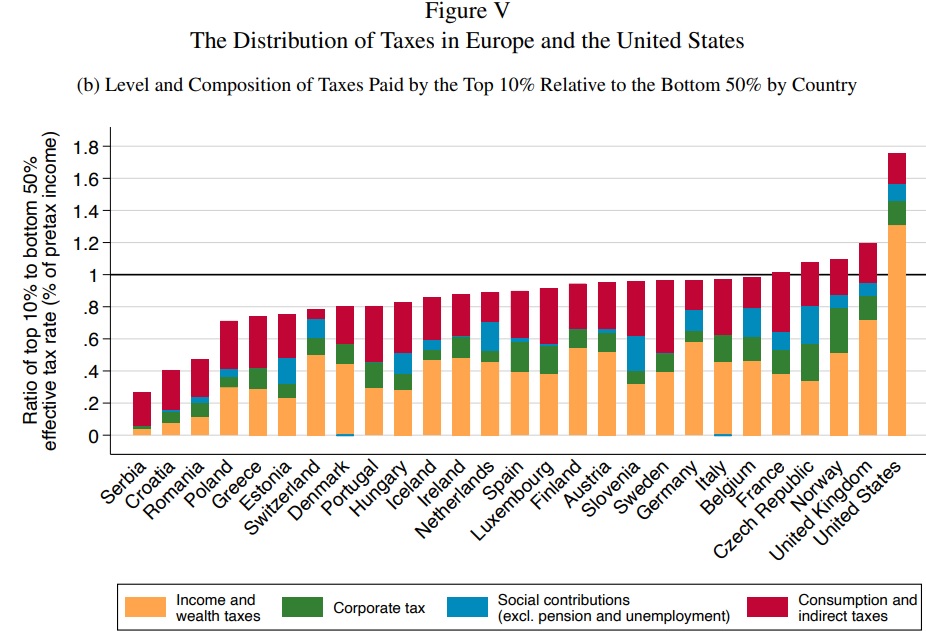
Figure Vb ranks European countries and the United States according to a simple measure of tax progressivity: the ratio of the total tax rate faced by the top 10% to that of the bottom 50%. The composition of bars correspond to the composition of taxes paid by the top 10%. The US stands out as the country with the highest level of tax progressivity: the top decile faces a tax rate that is more than 70% higher than that of the poorest half of the population. By this measure, the European country with the most progressive tax system is the United Kingdom, followed by Norway, the Czech Republic, and France. Many European countries have values close to 1 on this indicator, corresponding to relatively flat tax systems, in which top income groups face a tax rate approximately equal to that of the bottom 50%. …the US also stands out as one of the countries where the top 10% pay the largest share of their pretax income in the form of income and wealth taxes.
And here’s Figure V, which shows how the U.S. has (far and away) the most “progressive” tax system.
Again, I want to emphasize that this is not because the U.S. imposes higher taxes on the rich. The so-called progressivity of the American system is driven by the fact that there are low taxes on everyone else.
What about on the spending side of the fiscal ledger?
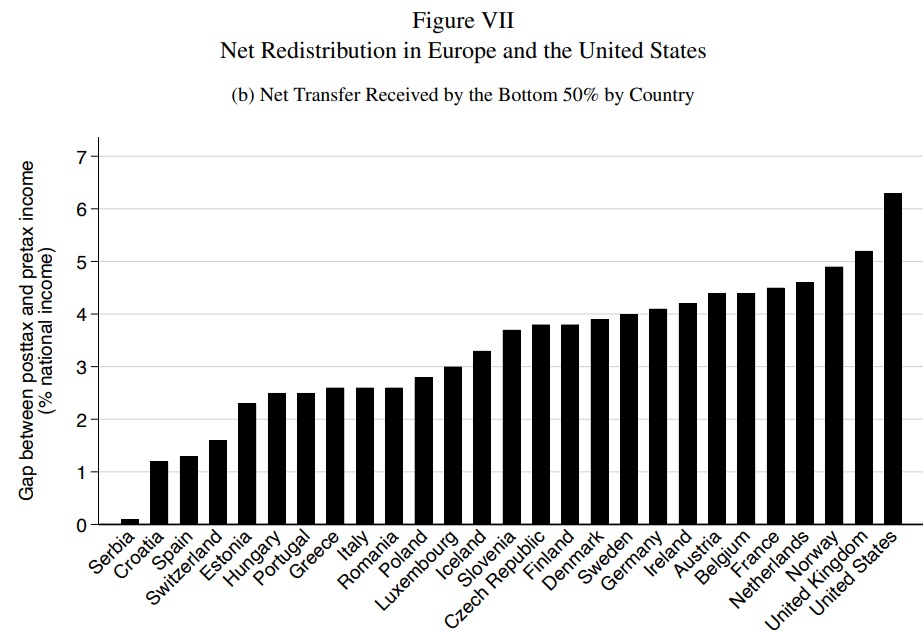
The study finds that the the United States has the most redistribution to lower-income people.
…the US tax-and-transfer system appears to be unequivocally more progressive. The bottom 50% in the US received a positive net transfer of 6% of national income in 2017, compared to about 4% in Western and Northern Europe and less than 3% in Eastern Europe. Meanwhile, the top 10% saw their average income decrease by 8% of national income in the US after taxes and transfers, compared to about 4% in Western and Northern Europe and 3% in Eastern Europe. …Figure VIIb represents the net transfer received by the bottom 50% in all European countries and the United States in 2017. Again, the US stands out as the country that redistributes the greatest fraction of national income to the bottom 50%.
Here’s the aforementioned Figure VII.
I’ll close by observing that there are multiple interpretations of this data. I suspect that authors want readers to conclude that there should be higher taxes and more redistribution. Both in Europe and the United States.
My big takeaway is that this research confirms why people with modest incomes in the United States have a better life than their counterparts in Europe.
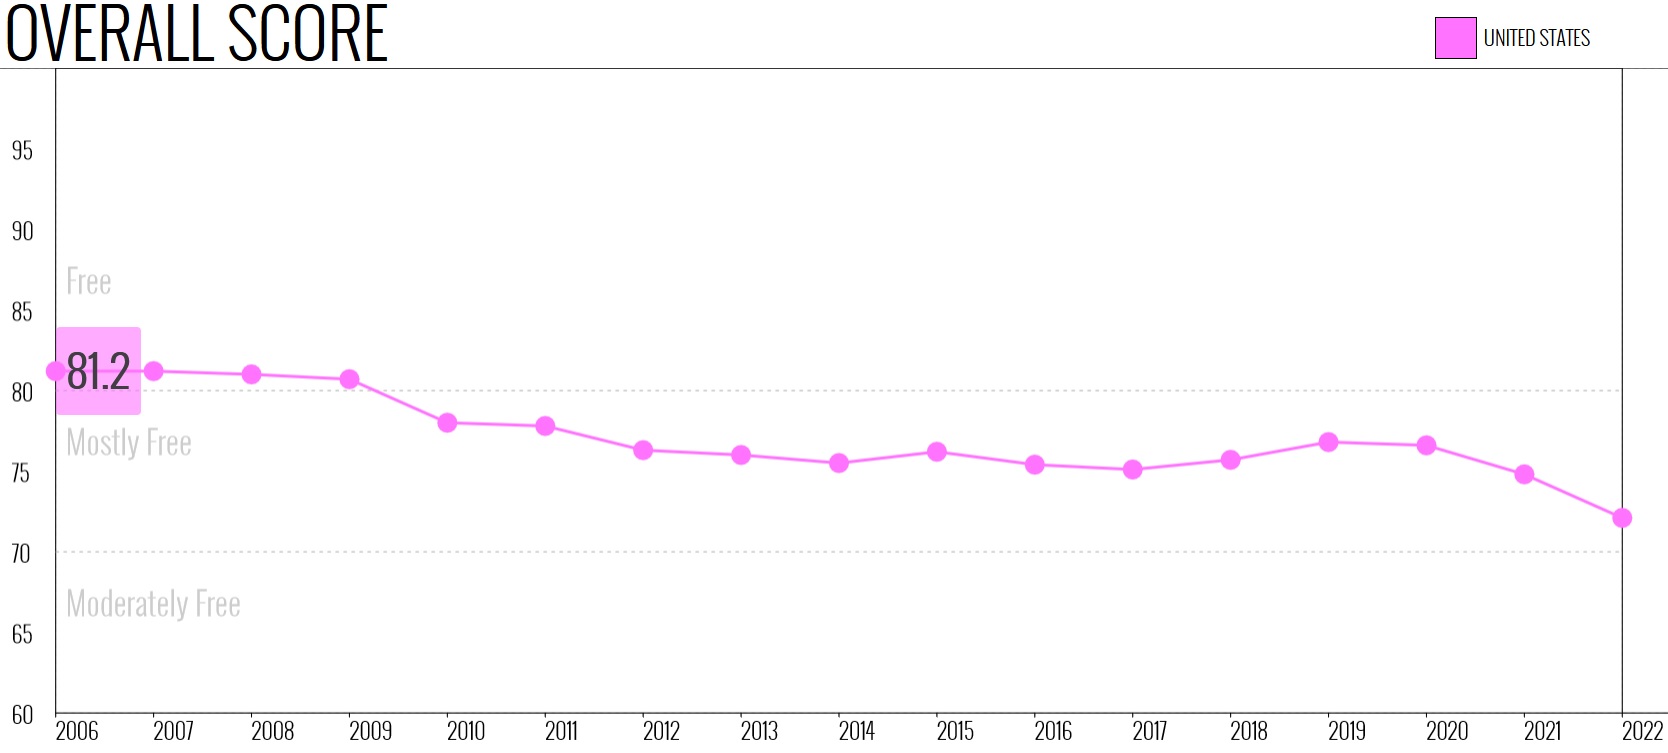
When I first wrote about the Index of Economic Freedomback in 2010, the United States was comfortably among the world’s 10-freest nations with a score of 78 out of 100.
By last year, America had dropped to #20, with a very mediocre score of 74.8.
Sadly, the United States is continuing to decline. The Heritage Foundation recently released the 2022 version of the Index and the United States is now down to #25, with an even-more-mediocre score of 72.1.
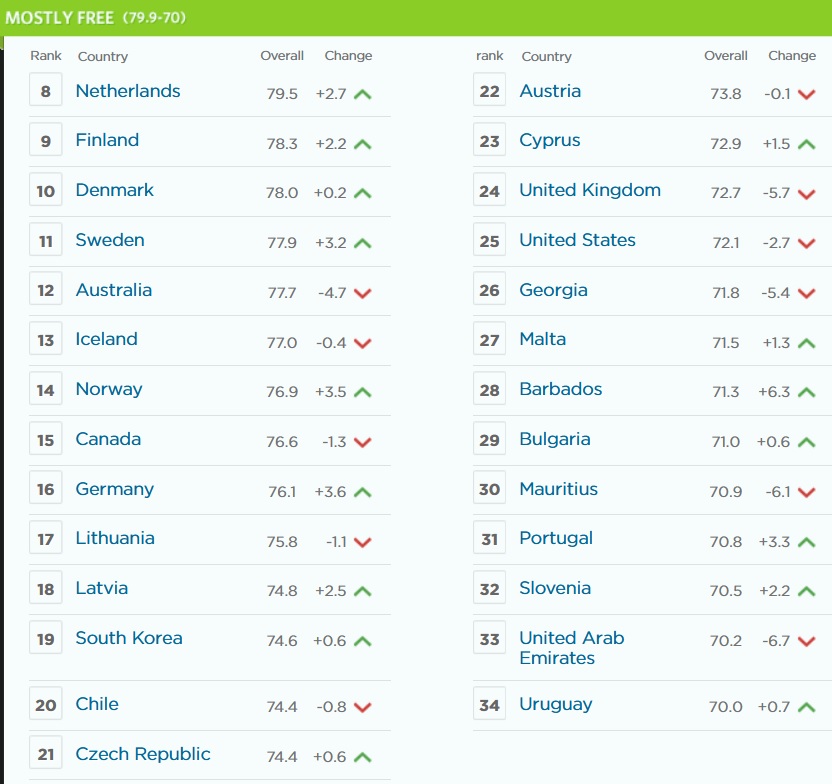
Our next visual shows that Singapore has the world’s freest economy, narrowly edging out Switzerland.
Notice, though, that Singapore’s score dropped and Switzerland’s improved. So it will be interesting to see if the “sensible nation” takes the top spot next year.
Also notice that only 7 nations qualified as “Free,” meaning scores of 80 or above.
The United States is in the “Mostly Free” category, which is for nations with scores between 70 and 80.
By the way, notice that the United States trails all the Nordic nations. Indeed, Finland, Denmark, Sweden, Iceland, and Norway get scores in the upper-70s.
I’ll close with a depressing look at how the United States has declined over the past two decades. I already mentioned that the U.S. gets a score of 72.1 in the 2022 version. That’s far below 81.2, which is where America was back in 2006.
P.S. The Fraser Institute’s Economic Freedom of the World shows a similar decline for the United States.
But, starting in the 1980s, that convergence stopped. And not because Europe reached American levels of prosperity. Even the nations of Western Europe never came close to U.S. levels of per-capita economic output.
Moreover, European countries then began to lose ground for the rest of the 20th century.
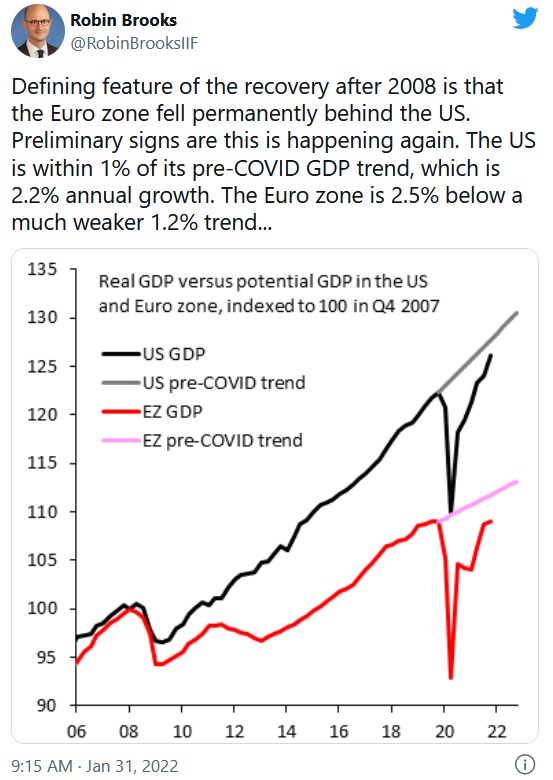
And that process is continuing. Here’s a recent tweet from Robin Brooks, the Chief Economist of the Institute of International Finance, which shows that the United States was growing faster than Europe before the pandemic and is now growing faster than Europe after the pandemic.
Sven Larson addressed this same issue in a new article on this topic for European Conservative.
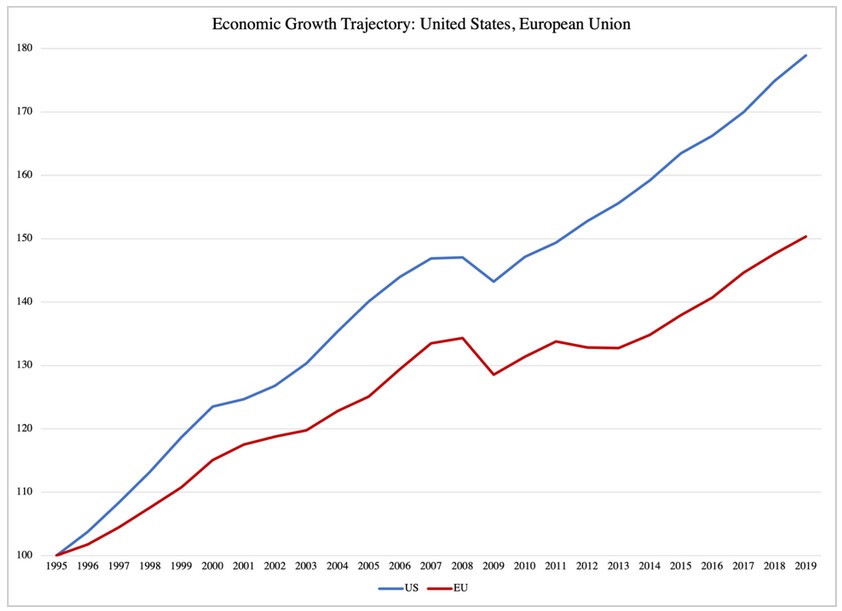
Over the 20 years from 2000 to 2019, the U.S. economy outgrew the 27-member European Union by a solid 19%, adjusted for inflation. These numbers…are quite impressive, especially considering that during President Obama’s eight years in office, annual growth in gross domestic product, GDP, never reached 3%. …From 2010 to 2019, U.S. unemployment averaged 6.3%, dropping below 3.7% in the last year before the pandemic. By contrast, the EU economy never dropped below 6.7% unemployment (in 2019) with an average of 9.5% for the entire decade. …These differences between America and Europe are significant, and should be the subject of debate in Europe: what is it that the Americans are doing that Europeans could do better? Over time, even small differences in economic growth compound into large differences in the standard of living.
Here’s his chart showing the divergence.
So why is Europe falling behind the United States when it should be growing faster because of lower living standards?
Sven has a very good explanation.
There are many candidates for explaining this difference, but there is one that stands out compared to all the others: the size of government. Between 2010 and 2019, government spending in the European Union was equal to 48.3% of GDP, on average, compared to 37.1% in the U.S. economy. …The most hard-hitting impact does not come through taxes, as conventional wisdom suggests, but through spending. …government operates under a form of central economic planning. Its outlays are not based on the mechanisms and prices of free markets: instead, its spending is governed by ideological preferences… While government spending inflicts the most damage on the economy, taxes are not insignificant. Here, again, the U.S. comes out more competitive than its European counterpart, and it is not a new problem. …For the past 20 years, European governments in general have taxed their economies 10-12 percentage points higher, as a share of GDP, than is the case in America.
With regards to factors other than fiscal policy, European nations have just as much economic liberty (or, if you’re a glass-half-empty type, just as little economic liberty) as the United States. Heck, many of them rank above the United States when just considering factors such as trade, red tape, monetary policy, and rule of law.
Yet the United States nonetheless earns a better overall score.
Why? Because the United States does much better on fiscal policy (or, to be more accurate, doesn’t do as poorly).
P.S. Both Europe and the United States are moving in the wrong direction with regard to fiscal policy. Almost as if there’s a contest to see who can be the most profligate. Let’s call it the Keynesian Olympics. Whoever wins a gold medal is the first to suffer a fiscal crisis.
In a column for Bloomberg, Allison Schrager analyzes America’s supply-chain problems and the impact on consumption patterns.
But what caught my eye were the numbers comparing the United States and Europe.
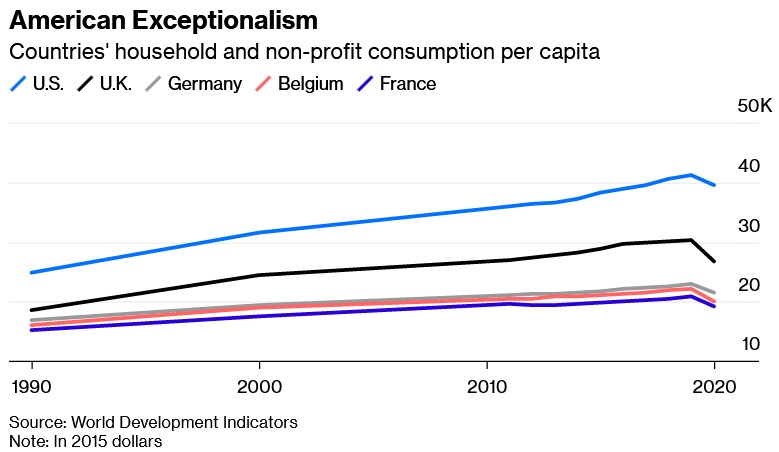
Americans can’t spend like they used to. Store shelves are emptying, and it can take months to find a car, refrigerator or sofa. If this continues, we may need to learn to do without — and, horrors, live more like the Europeans. That actually might not be a bad thing, because the U.S. economy could be healthier if it were less reliant on consumption. …We consume much more than we used to and more than other countries. Consumption per capita grew about 65% from 1990 to 2015, compared with about 35% growth in Europe. …What would that mean for the U.S. economy? European levels of consumption coexist with lower levels of growth.
Here’s the chart that accompanied her article.
As you can see, consumption in the United States is far higher than it is in major European nations – about $15,000-per-year higher than the United Kingdom and about double the levels in Germany, Belgium, and France.
So when someone says we should expand the welfare state and be more like Europe, what they’re really saying is that we should copy nations that are far behind the United States.
Some of you may have noticed that Ms. Schrager is citing per-capita consumption data from the World Bank and you may be wondering whether other numbers tell a different story.
After all, if higher levels of consumption in America are simply the result of borrowing from overseas, that would be a negative rather than a positive.
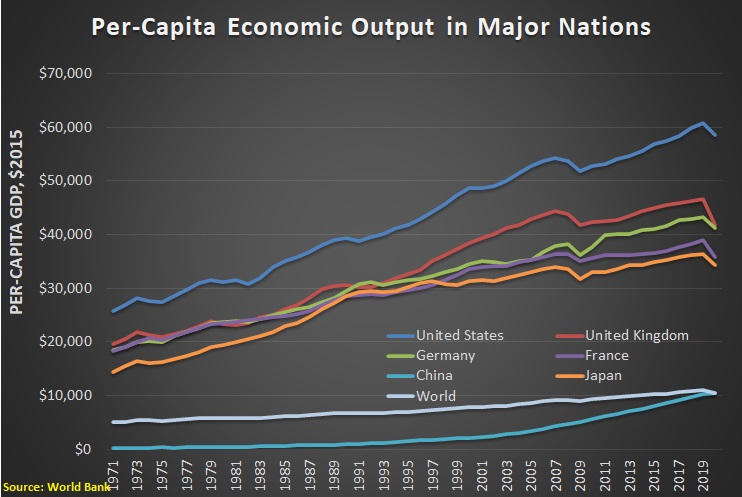
So I went to the same website and downloaded the data for per-capita gross domestic product instead. I then created this chart (going all the way back to 1971). As you can see, it shows that Americans not only consume more, but we also produce more.
For those interested, I also included Japan and China, as well as the average for the entire world.
The bottom line is that it’s good to be part of western civilization. But it’s especially good to be in the United States.
Since we’re on the topic of comparative economics, David Harsanyi of National Reviewrecently wrote about the gap between the United States and Europe.
More than anything, it is the ingrained American entrepreneurial spirit and work ethic that separates us from Europe and the rest of the world. …Europe, despite its wealth, its relatively stable institutions, its giant marketplace, and its intellectual firepower, is home to only one of the top 30 global Internet companies in the world (Spotify), while the United States is home to 18 of the top 30. …One of the most underrated traits we hold, for instance, is our relative comfort with risk — a behavior embedded in the American character. …Americans, self-selected risk-takers, created an individual and communal independence that engendered creativity. …Because of a preoccupation with “inequality” — one shared by the modern American Left — European rules and taxation for stock-option remuneration make it difficult for start-up employees to enjoy the benefits of innovation — and make it harder for new companies to attract talent. …But the deeper problem is that European culture values stability over success, security over invention…in Europe, hard work is less likely to guarantee results because policies that allow people to keep the fruits of their labor and compete matter far less.
In other words, there’s less economic dynamism because the reward for being productive is lower in Europe (which is simply another way of saying taxes are higher in Europe).
P.S. The main forcus of Ms. Schrager’s Bloomberg article was whether the U.S. economy is too dependent on consumption.
It feels like our voracious consumption is what fuels the economy. But that needn’t be the case. Long-term, sustainable growth doesn’t come from going deep into debt to buy stuff we don’t really need. It comes from technology and innovation, where we come up with new products and better ways of doing things. An economy based on consumption is not sustainable.
And if you want to understand why some states have more vibrant economies than other states, you should check out the latest edition of the Fraser Institute’s Economic Freedom of North America.
Since most readers are from the United States, I’ll start with a look at the publication’s sub-national index, which shows how American states rank in terms of economic liberty. Unsurprisingly, a bunch of jurisdictions with no income tax are at the top of the list and California and New York are at the bottom.
By the way, the authors (Dean Stansel, José Torra, and Fred McMahon) specifically note that the rankings are based on 2019 data (the latest-available data) and thus “do not capture the effect on economic freedom of COVID-19 and government responses to it.“
With that caveat out of the way, here are some of the findings for the sub-national index (which is where Figure 1.2b from above can be found).
Since the Fraser Institute is based in Canada, they understandably start by looking at Canadian provinces, but you can then read about results for the rest of North America.
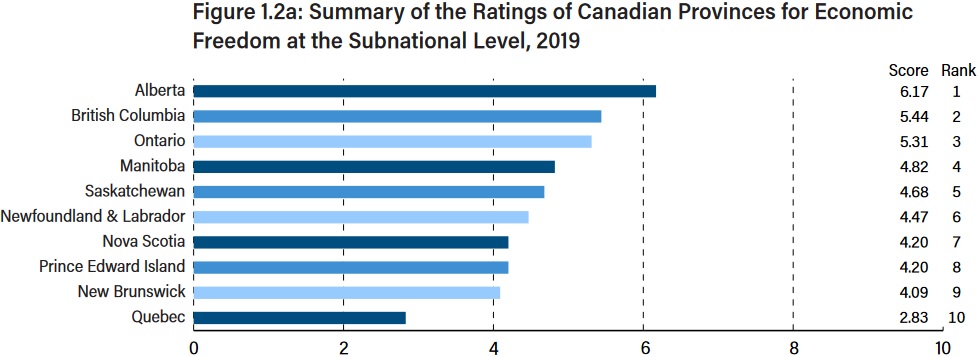
For the purpose of comparing jurisdictions within the same country, the subnational indices are the appropriate choice. There is a separate subnational index for each country. In Canada, the most economically free province in 2019 was again Alberta with 6.17, followed by British Columbia with 5.44, and Ontario at 5.31. However, the gap between Alberta and second-place British Columbia continues to shrink, down from 2.30 points in 2014 to 0.73 in 2019. The least free by far was Quebec at 2.83, following New Brunswick at 4.09, and Prince Edward Island and Nova Scotia at 4.20. In the United States, the most economically free state was New Hampshire at 7.83, followed closely by Tennessee at 7.82, Florida at 7.78, Texas at 7.75, and Virginia at 7.59. …In Mexico, the most economically free state was Baja California at 6.01.
Here are the provincial rankings from Canada.
Alberta is the best place for economic growth and Quebec is the worst (by a significant margin).
Here are the some of the findings for the all-government index (which uses a different methodology than the sub-national index mentioned above).
The good news, from the perspective of folks in the U.S., is that most states rank above every other jurisdiction in North America (and the Mexican state all rank at the bottom).
The top jurisdiction is New Hampshire at 8.23, followed by Florida (8.17), Idaho (8.16), and then South Carolina, Utah, and Wyoming tied for fourth (8.15). Alberta is the highest ranking Canadian province, tied for 33rd place with a score of 8.00. The next highest Canadian province is British Columbia in 47th at 7.91. Alberta had spent seven years at the top of the index but fell out of the top spot in the 2018 report (reflecting 2016 data). The highest-ranked Mexican state is Baja California with 6.65, followed by Nayarit (6.62)… Seven of the Canadian provinces are ranked behind all 50 US states.
By the way, here’s some historical context showing that all three nations had their best scores back in the early 2000s (when the “Washington Consensus” for pro-market policy still had some impact.
Historically, average economic freedom in all three countries peaked in 2004 at 7.74 then fell steadily to 7.24 in 2011. Canadian provinces saw the smallest decline, only 0.19, whereas the decline in the United States was 0.51 and, in Mexico, 0.58. Since then average economic freedom in North America has risen slowly to 7.43 but still remains below that peak in 2004. However, economic freedom has increased in the United States and Mexico since 2013. In contrast, in Canada, after an increase in 2014, it has fallen back below its 2013 level.
P.S. If you want some additional historical context, Alberta’s fall from the top (mentioned in the first excerpt) can be partly blamed on the provincial government’s fiscal profligacy when it was collecting a lot of energy-related tax revenue.
P.P.S. I first wrote about Economic Freedom of North America in 2013 and more recently shared commentary about the 2019 and 2020 versions.
This is not a good idea. Americans are richer than their counterparts on the other side of the Atlantic. Even more remarkably, lower-income people in the United States often have living standardsequal to – or even greater than – middle-income Europeans.
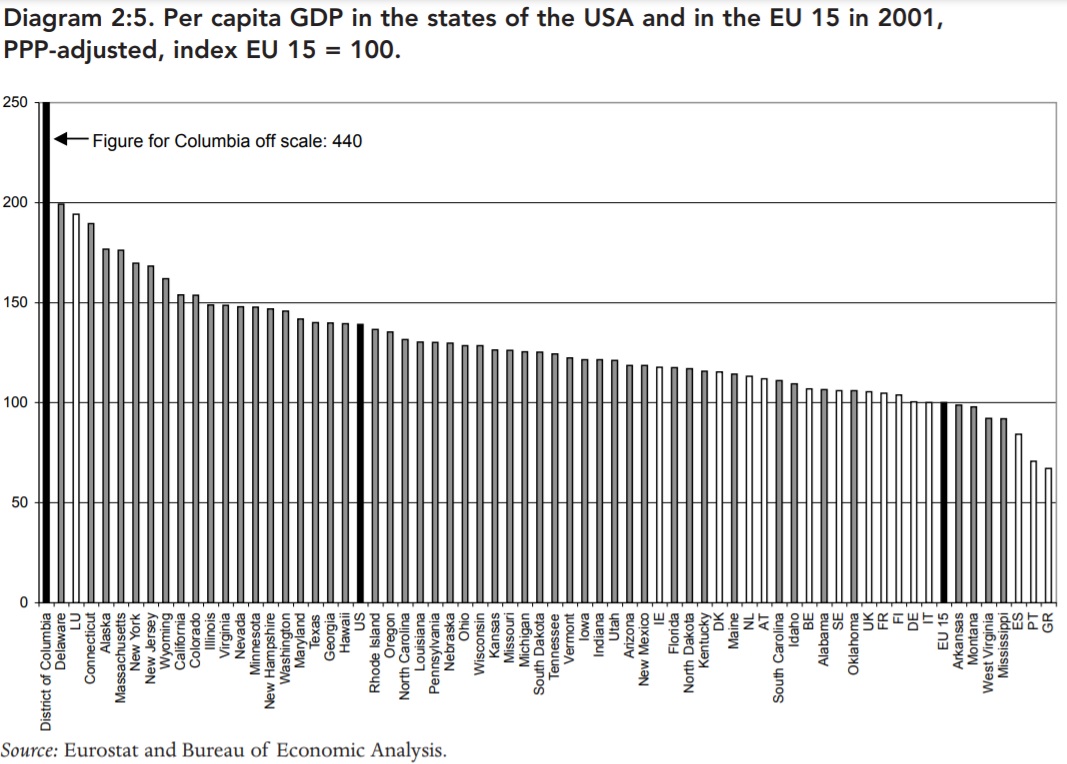
Another way of making this point is to compare economic outcomes in American states compared to European countries.
I first did that back in 2015, citing data to show that all be the very-richest European nations would be considered poor if they were part of the United States.
I want to augment that comparison today. I’m motivated by a National Reviewcolumn by Charles Cooke. As a former European, he realizes it would be a mistake for the United States to copy European policies.
Schrager writes, “Americans can’t spend like they used to. Store shelves are emptying, and it can take months to find a car, refrigerator or sofa. If this continues, we may need to learn to do without — and, horrors, live more like the Europeans. That actually might not be a bad thing.” Counterpoint: Yes, it would. …having spent a great deal of time in both places, I can assure you that it is considerably easier to live in America than it is to live in Europe, and that one of the main reasons for that — beyond Americans’ being so stonkingly rich — is that Americans are far, far more demanding of their marketplaces. …We do not, under any circumstances, need to “learn to do without.”
I want to focus on the “stonkingly rich” part of the above excerpt.
Cooke links to a 2014 column in the Washington Post by Hunter Schwarz. Here are the key passages.
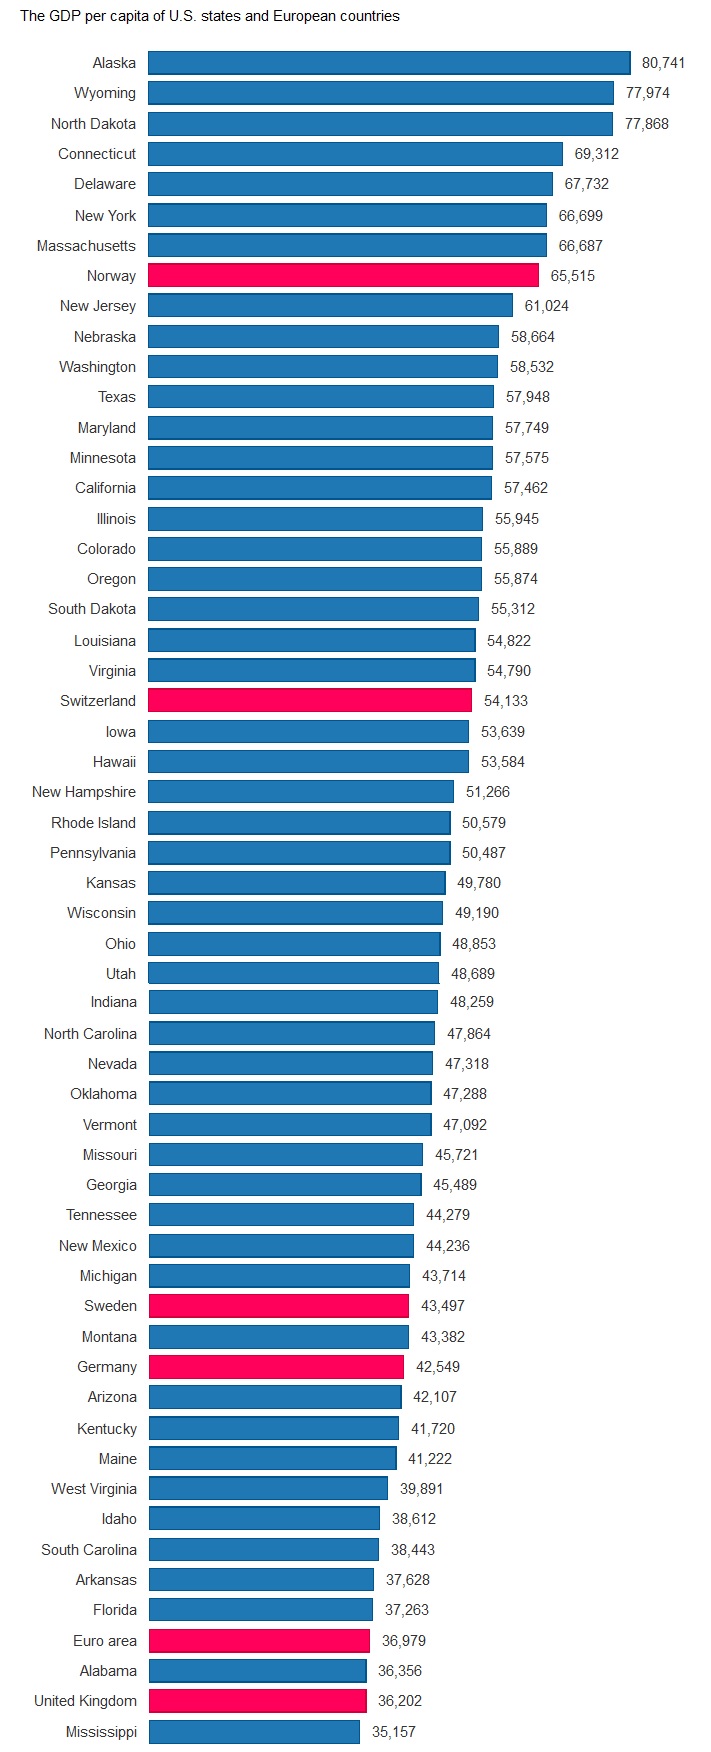
If Britain were to join the United States, it would be the second-poorest state, behind Alabama and ahead of Mississippi. The ranking, determined by Fraser Nelson, an editor of The Spectator magazine, was made by dividing the gross domestic product of each state by its population, and it took into account purchasing power parity for cost of living. Several other European countries were also included… Norway was the top European country on the list, between Massachusetts and New Jersey.
Here’s the Nelson data, which shows that only oil-rich Norway and pro-market Switzerland look good.
Some readers may be questioning the use of numbers from 2014 and 2015.
That’s a reasonable suspicion since perhaps European countries have closed the gap over the past few years.
But that’s not the case. The United States has grown faster in recent years, so updated state/country numbers would make Europe look even worse.
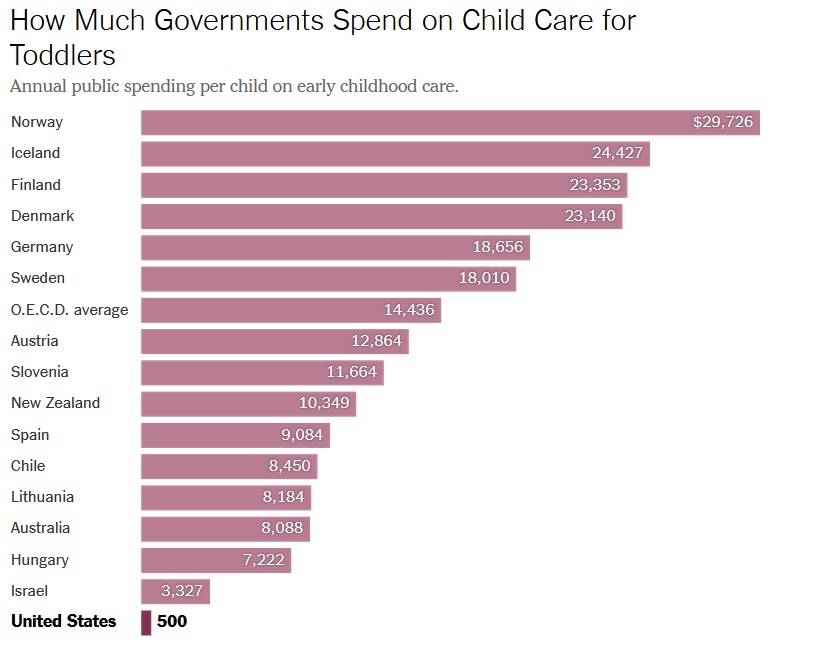
A column in the New York Times, authored by Spencer Bokat-Lindell, suggests that the United States needs to increase government spending on child care to “shrink the gap” with other nations.
The main evidence for this proposition is a chart showing the United States at the bottom.
The obvious goal is to convince readers that the United States is doing something wrong.
And that comes across in the text of the article.
If you’re active on social media there’s a decent chance you came across this chart…about how much less the U.S. government spends on young children’s care than other rich countries. The infrastructure and family plan that President Biden proposed and that’s now being negotiated in Congress is an attempt to shrink the gap through four key policies: a federal paid family and medical leave program, an extension of the child tax credit (in the form of a monthly payment) that debuted this year, subsidized day care, and universal pre-K.
But why is it bad to be at the bottom of this list when all the nations above the U.S. have lower living standards?
I’ve repeatedly made the point that we don’t want to “catch up” to nations that have lower levels of prosperity.
Household consumption is 50 percent higher in the United States than the average of other developed nations.
The bottom 10 percent of Americans enjoy better lives than the average citizens of OECD nations.
But maybe this isn’t just about living standards.
The article also suggests that childcare subsidies are needed to avert demographic decline.
…Why does the United States have such an exceptional approach to family and child care benefits…? European and Latin American countries began enacting these policies…the end of World War II accelerated the process, particularly in Europe… “Part of it had to do with fears of demographic decline…the need to recover from those years and to ensure that there was a strong work force going forward,” Siegel told the BBC.
For what it’s worth, I agree that demographic decline is a major issue.
Falling birth rates and increased life expectancy are a very worrisome combination for government budgets.
Which leads to the hypothesis that childcare subsidies can help deal with this problem by enabling higher levels of fertility.
That’s theoretically possible, I’ll admit, but we certainly don’t see it in the data. Here’s the chart from the New York Times, which I’ve augmented by showing fertility rates.
As you can see, the United States has a higher fertility rate than almost every other nation on the list, which certainly suggests that childcare subsidies are not an effective way of encouraging more babies.
Moreover, U.S. fertility of 1.71 is higher than the OECD average of 1.61.
And when you compare the United States to peer nations (“OECD rich nations” and “EU-15 nations”), the fertility gap is even larger, 1.71 to 1.52.
One moral of the story is that government handouts are not an effective way of increasing fertility.
And the other moral of the story is that it’s not a good idea to copy nations that are economically weaker.
A very persuasive argument against Biden’s fiscal agenda is that it makes no sense to copy the fiscal policies of European welfare states.
Indeed, I routinely share this column from January, which looks at three different measures of comparative prosperity – all of which show the United States is way ahead of nations on the other side of the Atlantic Ocean.
One of the three data sources is this comparison of “actual individual consumption” (AIC) in the member nations of the Organization for Economic Cooperation and Development.
We now have updated AIC numbers. Here’s a look at the OECD’s latest data. As you can see, people in the United States enjoy levels of consumption 50 percent above the average for developed nations.
The U.S. is even way ahead of oil-rich Norway and the tax havens of Luxembourg and Switzerland.
By the way, if you look at the OECD’s technical definition, AIC includes “government expenditure on individual consumption goods and services,” so the gap between the United States and other nations is not a statistical quirk based on whether government is (or is not) paying for things.
P.S. I can’t resist a couple of closing observations. If you click on the OECD’s link for AIC, you’ll notice that there are seven years of data, thus showing which nations are moving in the right direction or wrong direction (relative to other OECD countries).
Eastern European nations tend to have the largest increases, as one might expect based on convergence theory (these nations fell way behind because of communist mismanagement). But the biggest increase was enjoyed by Lithuania, which also is very highly ranked for economic liberty. Not a coincidence.
Nations that suffered noticeable declines include Japan (no surprise), along with Italy and Greece (even less of a surprise).
The moral of the story is that smaller government is part of the recipe for greater prosperity, even if that’s not the approach preferred by vote-buying politicians.
P.P.S. Click here is you want an estimate of how much economic damage would be caused by Biden’s fiscal agenda.
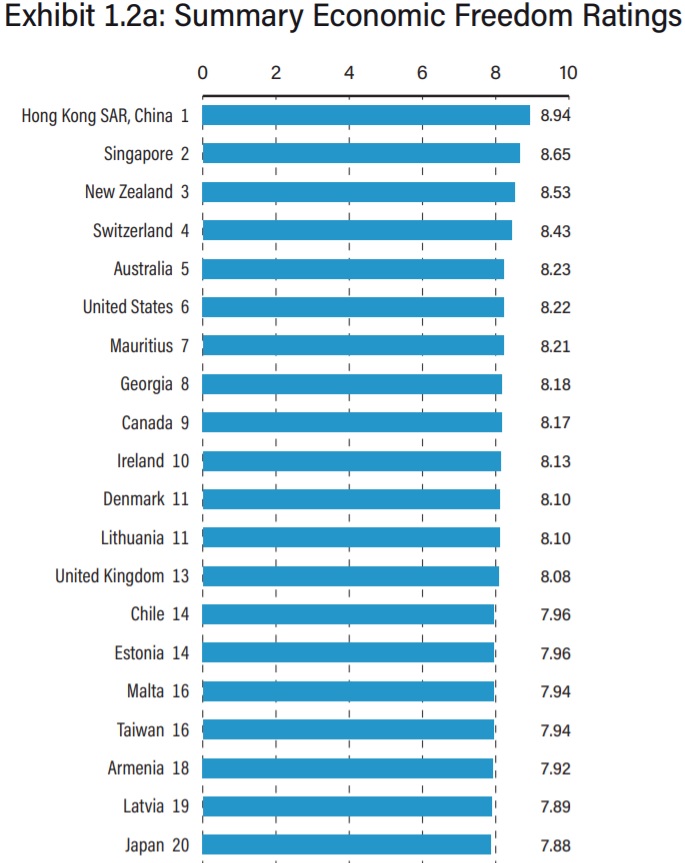
But does that score indicate that China will become richer than the United States, which has a current score of 8.22 (the world’s 6th-highest level of economic liberty)?
Of course not.
My answer might change of China engaged in more economic liberalization, as I have urged. But it seems the opposite is happening and China is backsliding toward more state control.
And that means the United States almost surely will remain far more prosperous.
But some people must not be very familiar with data about China and its economy.
For instance, President Trump’s former top trade official, Robert Lighthizer, wrote that the United States should copy China’s cronyism in a column in the New York Times.
…we need a multifaceted long-term strategy. …Our strategy must include…an industrial policy that includes subsidies to foster the development of the most advanced science and technology…and a robust plan to combat China’s unfair trade practices. …The Senate legislation would achieve some of what is needed. It calls for $200 billion to bolster scientific and technological innovation, $52 billion to rebuild our capacity to make semiconductors, and a supply-chain resiliency program… The House should perfect the provisions of the Senate bill that restructure and enhance federal support for science and innovation and strip out those that weaken our trade laws and encourage Chinese imports.
Lighthizer not only doesn’t understand economics, he also doesn’t know history.
Adam Thierer of the Mercatus Center points out that the current angst about China is a repeat verse of a song we heard over and over again in the late 1980s.
Back then, everyone though Japan was on the verge of overtaking the United States, ostensibly because that nation had wise politicians and bureaucrats who knew how to pick winners and losers.
Thierer’s article tells us what really happened.
In 1949, the Japanese government created the Ministry of International Trade and Industry (MITI) to work with other government bodies (especially the Bank of Japan) to devise plans for industrial sectors in which they hoped to make advances. Although not as heavy-handed as Chinese planning authorities are today, MITI came to have enormous influence over private-sector research and investment decisions during the next five decades. The organization used a variety of the same policy levers that Chinese officials do today, with a particular focus on trade management and industrial policy investments in sectors perceived to be “strategic” for future economic advance. …By the late 1970s…, U.S. officials and market analysts came to view MITI with a combination of reverence and revulsion, believing that it had concocted an industrial policy cocktail that was fueling Japan’s success at the expense of American companies and interests. …By the end of the 1980s, fears about “Japan Inc.” had reached a fever pitch. …Just as Japan phobia was reaching its zenith in the early 1990s, Japan’s fortunes began taking a turn for the worse. The Japanese stock market crashed in 1990… Japan suffered a brutal economic downturn that became known as the Lost Decade, which really lasted almost two decades. …by the late 1990s many scholars came to view most Japanese industrial policy initiatives as a costly bust.
Amen.
I wrote that Japan was a “basket case” back in 2013. A bit of hyperbole, to be sure, but I was trying to drive home the point that the nation’s politicians have made some costly mistakes.
P.S. If China wants to pursue industrial policy and other forms of cronyism, that’s a mistake that mostly hurts the Chinese people. To the extent such policies are designed to subsidize exports (as Lighthizer argues), the best response is to utilize the World Trade Organization, not to copy China’s misguided interventionism.
Since this is America’s Independence Day, I’m going to continue my tradition (see 2010, 2011, 2012, 2013, 2014, 2015, 2016, 2017, 2018, 2019, and 2020) of authoring a July 4-themed column.
What will make this year special, though, is that we’re going to tackle the heavy topic of whether the United States lives up to its own ideals.
Two years ago, the New York Times unveiled the “1619 Project,” which largely argues that slavery and racism are part of the nation’s DNA. The NYT states that the project “aims to reframe the country’s history by placing the consequences of slavery…at the very center of our national narrative.”
As a libertarian, I don’t believe our government is good and pure today, and I also don’t believe it was good and pure in the past. So I have no problem with a skeptical assessment of American history.
That being said, I have a positive view of America’s founding and consider the Declaration of Independence in 1776 and the unveiling of the Constitution in 1787 as victories for liberty.
But only partial victories. What happened in the late 1700s should be viewed as the beginning of a process that slowly but surely has extended the blessings of liberty to the broader population.
Just as Martin Luther King stated back in 1964, “the arc of the moral universe…bends toward justice.”
At the risk of oversimplifying, the 1619 Project has people fighting about two sides of the same coin.
Some people say the story of the United States is bad because of a legacy of slavery, segregation, and racism.
Other people say the story of the United States is good because of progress against slavery, segregation, and racism.
But the battle is about more than whether we have a glass-half-full or glass-half-empty view of history.
It’s also about fanciful claims, such as the assertion that the War of Independence was fought to preserve slavery. In an article for Quillette, Phillip Magness points out that historians almost universally reject that interpretation.
Critics on both the Left and Right took issue with the paper’s declared intention of displacing 1776 with the alternative date… For several months after the 1619 Project first launched, its creator and organizer Nikole Hannah-Jones doubled down on the claim. “I argue that 1619 is our true founding,” she tweeted the week after the project launched. …the historical controversies around the 1619 Project intensified in late 2019 and early 2020. A group of five distinguished historians took issue with Hannah-Jones’s lead essay, focusing on its historically unsupported claim that protecting slavery was a primary motive of the American revolutionaries when they broke away from Britain in 1776. …a historian who the Times recruited to fact-check Hannah-Jones’s essay revealed that she had warned the paper against publishing its claims about the motives of the American Revolution on account of their weak evidence. The 1619 Project’s editors ignored the advice.
Indeed, Magness’ article discusses how the New York Times has largely conceded it made a mistake and has “stealth edited” the 1619 website.
Magness also has criticized the way supporters of the 1619 Project are attempting to promote statist economic policies.
Here’s some what he wrote for the American Institute for Economic Research.
When I first weighed in upon the New York Times’ 1619 Project, I was struck by its conflicted messaging. …certain 1619 Project essayists infused this worthy line of inquiry with a heavy stream of ideological advocacy. Times reporter Nikole Hannah-Jones announced this political intention openly, pairing progressive activism with the initiative’s stated educational purposes. …A historical discussion about the Constitution’s notoriously strained handling of slavery quickly drifted into a list of partisan grievances against the tax and health care policy views of congressional Republicans in the twenty-first century. …The 1619 Project, it seemed, could serve as both an enduring long-term curriculum for high school and college classrooms and an activist manual… This tendency finds its most visible display in…Matthew Desmond’s essay on the relationship between slavery and modern American capitalism. …Lurking beneath it all was a long list of Desmond’s own modern progressive political causes—economic inequality…and a general disdain for deregulation and free market thought. In short, Desmond was weaponizing the history of slavery to attack modern capitalism.
If you want to spend 79 minutes learning about why Desmond is wrong, this Reason interview with Magness is very informative.
I’ll simply add that it’s absurd to link slavery with capitalism. In a laissez-faire society, government’s legitimate role is to protect the “negative rights” of life, liberty, and property.
Yet slavery is based on government laws that allow one person to own another person.
Let’s wrap up today’s column by looking at the future rather than the past.
In a book review for the Wall Street Journal, Jason Riley discusses Robert Woodson’s concerns that the 1619 Project may promote a victim mentality and discourage upward mobility.
Mr. Woodson is a veteran community activist who broke with the traditional civil-rights leadership in the 1970s after realizing that the agenda of “racial grievance groups” like the NAACP was increasingly at odds with the actual wants and needs of the black underclass. …After the New York Times published its “1619 Project”…he became incensed. …Mr. Woodson responded by initiating his own project, “1776 Unites,” which enlisted a group of black scholars, journalists and social activists “who uphold the true origins of our nation and the principles through which its founding promise can be fulfilled.” …Mr. Woodson released “Red, White and Black: Rescuing American History from Revisionists and Race Hustlers.” The book is a collection of essays by 1776 Unites participants, and its publication is a public service. …In the book’s introduction, Mr. Woodson writes that his goal is not to offer point-by-point rebuttals. Rather, he wants to “debunk the myth that present-day problems are related to our past . . . specifically, debunking the myth that slavery is the source of present-day disparities and injustice.” Mr. Woodson understands that pointing out the moral shortcomings of others might prove cathartic, but it will do little if anything to facilitate black upward mobility. And he flatly rejects the notion that “the destiny of black Americans is determined by what whites do—or what they have done in the past,” which is otherwise known as critical race theory.
As I wrote a few days ago, critical race theory can be a helpful way to understand history, but it also can be harmful if it labels everyone as either a victim or an oppressor.
I much prefer how Walter Williams viewed race-related issues.
This is because such data, especially over decades, teaches us very important lessons about the policies that are most likely to generate prosperity.
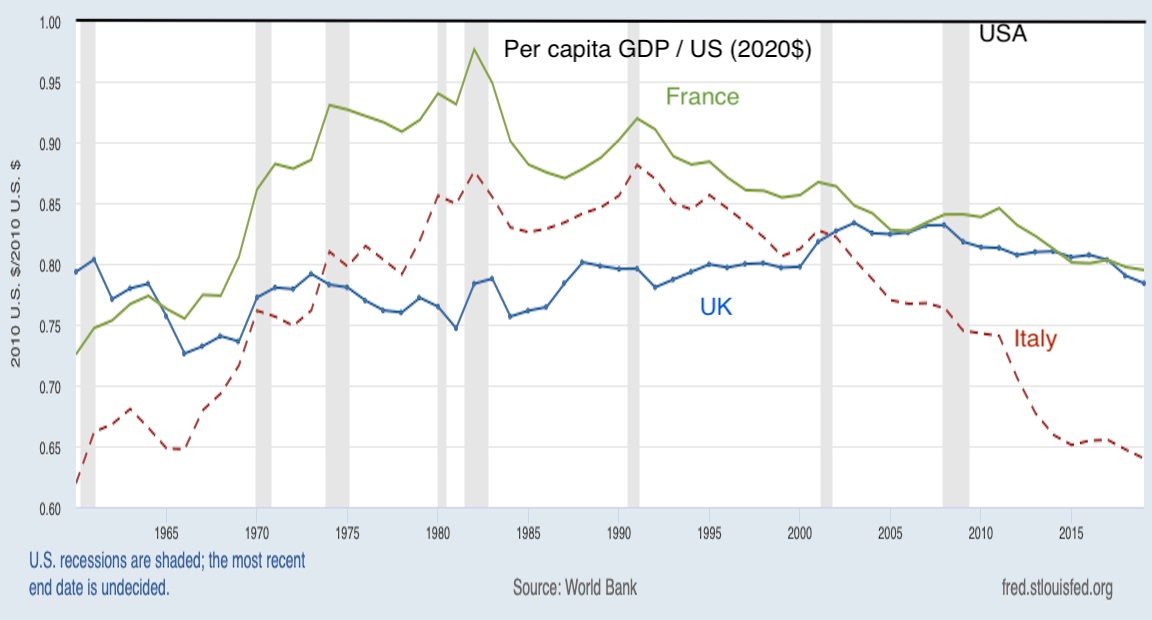
I’m revisiting these issues today because John Cochrane, a Senior Fellow at the Hoover Institution and a former professor of economics at the University of Chicago, recently wrote a column that contains a must-see chart showing how some of the major European nations have been losing ground to the United States over the past several decades.
The main thing to understand is that European nations were catching up to the United States after World War II, which is what one would expect.
But that trend came to a halt about 40 years ago and now these nations are suffering divergence instead of enjoying convergence.
Here’s some of Cochrane’s analysis.
…the US is 54% better off than the UK.. France…50% less than US. …the US is 96% better off than Italy. …And it’s been getting steadily worse. France got almost to the US level in 1980. And then slowly slipped behind. The UK seems to be doing ok, but in fact has lost 5 percentage points since the early 2000s peak. And Italy… Once noticeably better off than the UK, and contending with France, Italy’s GDP per capita is now lower than it was in 2000. GDP per capita is income per capita. The average European is about a third or more worse off than the average American, and it’s getting worse.
What’s most remarkable, as I wrote about back in 2014, is that the gap between the United States and Europe is “getting worse.”
Cochrane wonders if this is evidence against the European Union’s free-trade rules.
This should be profoundly unsettling for economists. Everyone thinks free trade is a good thing. The European union, one big integrated market, was supposed to ignite growth. It did not. The grand failure of the world’s biggest free trade zone really is a striking fact to gnaw on. Sure, other things are not held constant. Perhaps what should have been the world’s biggest free trade zone became the world’s biggest regulatory-stagnation, high-tax, welfare-state disincentive zone. Still, “it would have been even worse” is a hard argument to make.
For what it’s worth, I don’t think it’s “a hard argument to make”. I’ve pointed out – over and over again – that Europe’s reasonably good policies in some areas are more than offset by really bad fiscal policy.
Think of the different types of economic policy as classes for a student. If a kid flunks one class, that’s going to produce a sub-par grade point average even if there was good marks in all the other classes.
Besides, I suspect some of the benefits of free trade inside the European Union are offset by the damage of the E.U.’s protectionist barriers against trade with the rest of the world.
P.S. Some people may wonder why Germany was not included in Cochrane’s chart. I assume that’s because the reunification of West Germany and East Germany about 30 years ago creates a massive discontinuity in the data. For those interested, Germany is slightly better off than France and the U.K., according to the Maddison data, but still lagging well behind the United States.
P.P.P.S. I don’t think it’s a coincidence that America started out-performing Europe after Reaganomics was implemented.
P.P.P.P.S One obvious takeaway from Cochrane’s data (though not obvious to President Biden) is that the United States should not be copying Europe. Unless, of course, one wants ordinary Americans to be much poorer.
As illustrated by my recent three-part series (here, here, and here), I care about helping the poor rather then hurting the rich.
More broadly, I want a bigger economic pie so that everyone can have a larger slice. And I don’t particularly care if some people get richer faster than other people get richer (assuming they are earning money honestly and not relying on government favoritism).
In other words, it doesn’t bother me if someone like Bill Gates is getting richer faster than I’m getting richer, so long as there’s an economic environment that gives both of us a chance to prosper based on how much value we are providing to others.
But some folks are fixated on how the pie is sliced.
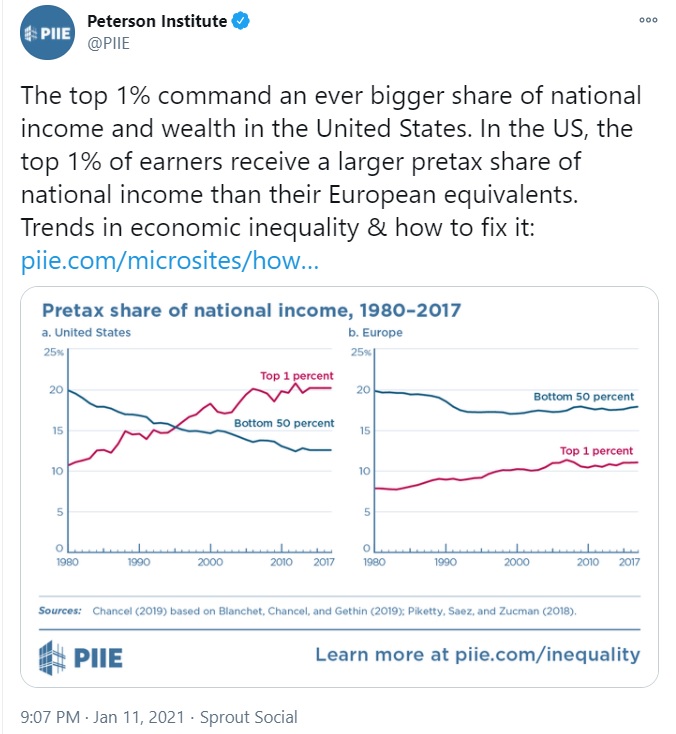
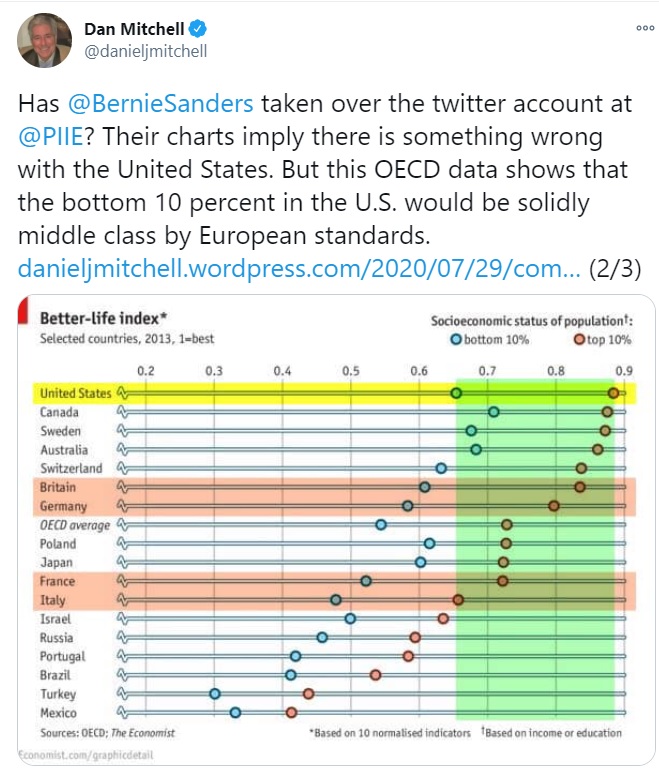
For instance, the Peterson Institute for International Economics recently tweeted that there is too much inequality in the United States (compared to Europe) and that something should be done to “fix” this supposed problem.
This type of data irks me because some people will assume that rising levels of income for the rich somehow imply falling levels of income for everyone else.
That may be true in nations with despotic socialist governments, such as Cuba, North Korea, and Venezuela, where the ruling class lines it pockets at the expense of the general population.
However, let’s focus on the United States and Europe, since the Peterson Institute wants readers to think that politicians in Washington should “fix” the distribution of income in America so that we resemble our friends on the other side of the Atlantic Ocean.
But first we must answer two very important questions: Are the non-rich in the United States suffering because rich people are doing well? And are the non-rich in Europe better off than the non-rich in America?
Earlier today, I answered those questions with three tweets.
I then concluded with this tweet showing that the bottom 20 percent of people in the United States have incomes higher than the average income in most European countries.
The moral of this story is that ordinary people are better off in America.
According to the Fraser Institute’s Economic Freedom of North America, the most economically free jurisdiction in North America used to be the Canadian province of Alberta.
But Alberta then slipped and New Hampshire claimed the top position. And, according to the the 2020 edition of Economic Freedom of North America, the Granite State is still the best place to live.
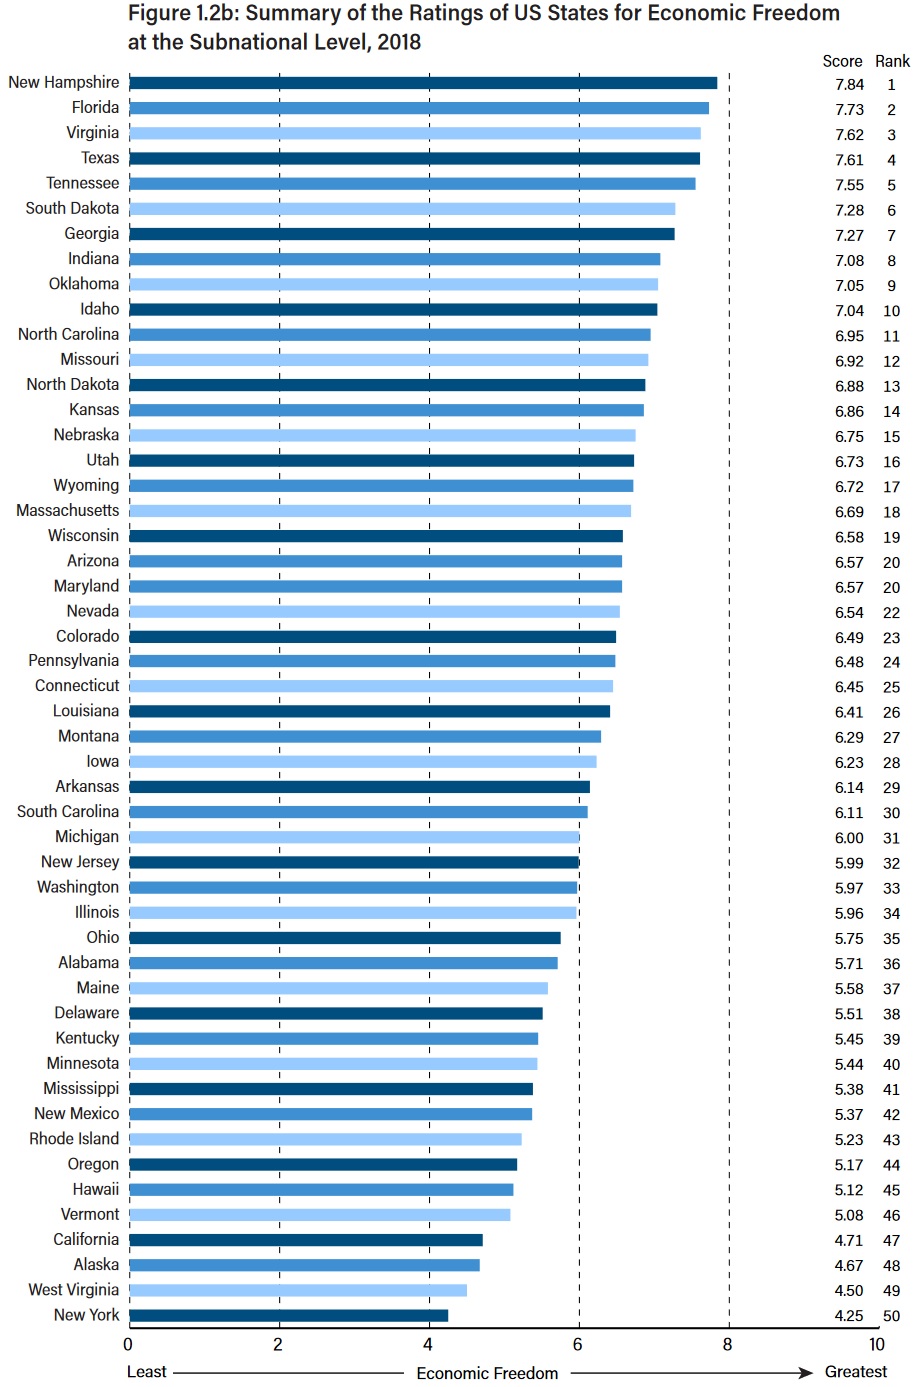
But since most of my readers are from the United States, let’s focus just on American states, and specifically look at how they rank based on the policies they control.
On this basis, you can see that New Hampshire is in first place, followed by Florida, Virginia, Texas, and Tennessee (if you’re looking for a common thread, four of the five have no state income tax).
Here are some highlights from the Fraser Institute’s summary.
Economic Freedom of North America 2020…measures the extent to which…individual provinces and states were supportive of economic freedom… There are two indices: one that examines provincial/state and municipal/local governments only and another that includes federal governments as well. …The all-government index includes data from Economic Freedom of the World… The top jurisdiction is New Hampshire at 8.16, followed by Florida and Idaho at 8.10 , then Wyoming (8.09) and Utah (8.08). Alberta is the highest ranking Canadian province, tied for 9th place with a score of 8.06. The next highest Canadian province is British Columbia in 27th at 7.98. …The highest-ranked Mexican state is Jalisco with 6.70… The lowest-ranked states in the United States are Delaware at 7.72 in 56th place, following Rhode Island (7.76 in 54th) and New York (7.77 in 53rd).
As I noted above, I think it’s especially instructive to see how jurisdictions compare when looking at the policies they control.
Here’s what the study says about the subnational index.
For the subnational index, Economic Freedom of North America employs 10 variables for the 92 provincial/state governments in Canada, the United States, and Mexico in three areas: 1. Government Spending; 2. Taxes; and 3. Labor Market Freedom. …There is a separate subnational index for each country. In Canada, the most economically free province in 2018 was again Alberta with 6.61, followed by British Columbia with 5.98… The least free by far was Quebec at 2.84… In the United States, the most economically free state was New Hampshire at 7.84, followed by Florida at 7.73. …(Note that since the indexes were calculated separately for each country, the numeric scores on the subnational indices are not directly comparable across countries.) The least-free state was New York at 4.25… In Mexico, the most economically free state was Jalisco at 6.57.
One obvious takeaway is to avoid Quebec and New York.
And almost all of Mexico as well.
One of the many great things about the Fraser Institute is that they are very good at sharing their data.
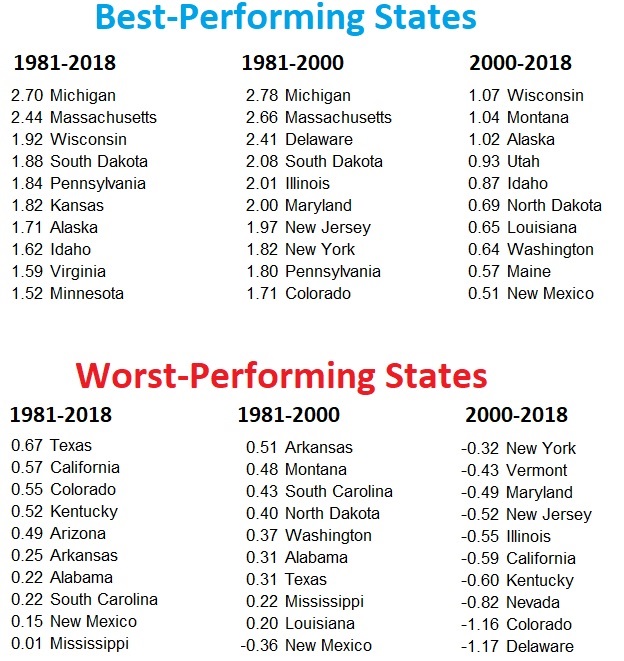
And, because I was curious to know what states are moving in the right direction and wrong direction, I downloaded the excel file so I could make the relevant calculations.
Here are the numbers, showing the both the overall shift since 1981 as well as the data for 1981-2000 and 2000-2018.
The good news is that every single state has more economic freedom today that it had in 1981. Michigan and Massachusetts enjoyed the biggest increases over the past four decades, though both of them still plenty of room for upward improvement.
Looking at the 1981-2000 and 2000-2018 periods, there was much more reform at the end of last century than there has been at the beginning of this century. So maybe the “Washington Consensus” influenced American states as well as foreign nations.
I realize I’m a dork about such things, but I was especially interested to see that some states (Delaware, Illinois, Maryland, New Jersey, New York, and Colorado) were very good performers in 1981-2000, but fell to the bottom group in 2000-2018.
By contrast, other states (Montana, North Dakota, Washington, and New Mexico) jumped from the bottom 10 to the top 10.
P.S. Texas ranked #1 in 1981, and by a comfortable margin, so even though it was among the bottom-10 performers for 1981-2018, it still ranks #4 overall for good economic policy.
P.P.S. Colorado dropped from #8 in 1981 to #23 in 2018, which may be a sign that the pro-growth impact of TABOR is more than offset the anti-growth impact of all the Californians that have moved to the state.
Overall, I have a pessimistic view of Japan, but not because it has terrible policy by world standards (it’s currently ranked #20 for economic liberty).
Instead, my concern is that it is drifting in the wrong direction (it was ranked in the top 10 for economic freedom in the mid-1950s) and the country is dealing with grim demographics.
But not everyone shares my view. Indeed, some people even think Japan is a role model. Here are some excerpts from a column in the Japan Times by Jesper Koll of Wisdomtree Investments.
U.S. President-elect Joe Biden can learn a lot from Japan. …the overall result generated by the Japanese economic system is extremely positive. Japan is the global best-in-class for balancing both income growth and income distribution. …an economy must both grow and distribute the spoils of wealth creation in a fair and equitable way.
So why does Mr. Koll think Japan does a good job?
Mostly because of economic outcomes for lower-income people.
At the end of last year, the median net financial wealth — all financial assets minus liabilities — for households in Japan stood at $104,000. In the United States, it was $62,000. …Japan does have an underbelly of poor people, but compared to America, relatively few are truly left behind financially. …America has more than two times more very wealthy people than Japan, but it also has more than five times more poor people. …In the past eight years, the bottom 10% of income earners saw a $15,000 rise in earnings in Japan, from $17,000 to $32,0000. In contrast, their American counterparts got only $10,000 more income, from $18,000 to $28,000.
For what it’s worth, I’m a bit skeptical of whether the experiences of ethnically homogeneous Japan are directly applicable to an ethnically heterogeneous society such as the United States.
But it’s interesting that he concludes by observing that you help low-income people with tight labor markets rather than the kind of class-warfare tax policy that Biden has been advocating.
How did Japan successfully bring up the poor? Not by taxing the rich, but by…positive demographic dynamics…because the growing scarcity of labor is forcing steadfast improvement in the type of employment contracts offered, i.e., not just part-time, but full-time as well as solid pay increases at the bottom end of the employment attractiveness spectrum.
But what about Koll’s point about lower-income people being better off in Japan than in the United States?
On that issue, I’m very skeptical.
His article doesn’t include links to data sources, so I can’t comment on the accuracy of his numbers.
But here’s a chart that I first shared earlier this year, which I’ve augmented in red to highlight how the bottom 10 percent of people in the United States are at the same level of middle-income people in Japan.
Call me crazy, but the above data don’t suggest that the United States should copy Japan.
Or what about this chart, which I originally shared back in 2019. It shows that the bottom 20 percent of people in the United States are doing better than the average person in Japan (highlighted in red).
Once again, these numbers don’t lead me to think that America should be copying Japan.
I won’t bother with another chart, but I also invite readers to peruse the OECD’s AIC data, which shows the average person in the United States being way ahead of the average person in Japan.
The latest edition of Economic Freedom of the World has been released by the Fraser Institute. The good news is that the United States is in the top 10 (we dropped as low as #18 during Obama’s first term).
The bad news is that Australia jumped in front of the United States, so America is now #6 instead of #5 like last year.
Here are the 20 jurisdictions in the world with the highest levels of economic liberty.
Here are some of the highlights from the report.
Hong Kong and Singapore, as usual, occupy the top two positions. The next highest scoring nations are New Zealand, Switzerland, United States, Australia, Mauritius, Georgia, Canada, and Ireland. The rankings of some other major countries are Japan (20th), Germany (21st), Italy (51st), France (58th), Mexico (68th), Russia (89th), India (105th), Brazil (105th), and China (124th). The 10 lowest-rated countries are: Central African Republic, Democratic Republic of Congo, Zimbabwe, Republic of Congo, Algeria, Iran, Angola, Libya, Sudan, and, lastly, Venezuela.
It’s not exactly a surprise that Venezuela is in last place, though keep in mind that a few basket-case nations aren’t included in the rankings because of inadequate data (most notably, North Korea and Cuba).
Some people may be surprised that Hong Kong is still #1, but there’s a good (albeit temporary) reason.
Between 1997 and 2018, there was no evidence of significant policy changes in Hong Kong as the result of the 1997 establishment of Hong Kong as a Special Administrative Region within China. Our data indicate that there have not been any major changes in tax and spending policy, monetary stability, or regulatory policy. In fact, Hong Kong’s 2018 rating of 8.94 is its highest since the financial crisis in 2008. However, it will be surprising if the apparent increase in the insecurity of property rights and the weakening of the rule of law caused by the interventions of the Chinese government in 2019 and 2020 do not result in lower scores
For those interested in the United States, here are the scores for the five major components.
For what it’s worth, I think American monetary policy should be ranked lower, but I admit that’s a subjective opinion that can’t be quantified (at least not yet).
Our worst score is for trade. Though that’s not just the fault of Trump. Yes, he’s caused a decline, but the U.S. score has been on a downward trajectory for almost 20 years.
Speaking of Trump, readers who get upset by my periodic criticisms of the President (such as what I wrote yesterday) may be interested in knowing that the U.S. now has a lower score (8.22 out of 10) than it did in Obama’s last year (8.32 out of 10).
P.S. Last but not least, here’s a map showing which nations are in various categories. All you really need to know is that it’s good to be blue and bad to be red.
P.P.S. China’s low score explains why I don’t think there’s any danger of that nation becoming an economic powerhouse (a point I first made back in 2010). At least not until and unless President Xi has the wisdom to allow a second wave of pro-growth reform.
And because of the relationship between policy and prosperity, this means that Americans tend to have much higher living standards than their counterparts in other nations. Even when compared to people in other developed countries.
Let’s examine some data. In a column for National Review, Joseph Sullivan compares recent increases in living standards for major nations.
If you want to answer questions about how economic wellbeing for individuals in a country has evolved, the actual change in the value of real GDP per capita may tell you more than the rate of its change. Why? Individuals buy goods and services with dollars and cents — not the rates of change that economists, politicians, and pundits tend to focus on when it comes to growth. …By this metric, between 2016 and 2019, economic growth in the U.S. was the best in its class. …The U.S. surpasses…its peers…by no small margin. It bests the silver medalist in this category, Finland, by $1,100. That is almost as big as the $1,160 that separates the runner-up from the peer country that comes in dead last, Sweden.
Here’s the chat from his article.
The key takeaway is that Americans started the period with more per-capita GDP and the U.S. lead expanded.
That’s one way of looking at the data.
A 2017 report from the Pew Research Center also has some fascinating numbers about the relative well-being of the middle class in different nations.
…the middle class in a country consists of adults living in households with disposable incomes ranging from two-thirds to double the country’s own median disposable household income (adjusted for household size). This definition allows middle-class incomes to vary across countries, because national incomes vary across countries. …That raises a question: What shares of adults in Western European countries have the same standard of living as the American middle class? …When the Western European countries the Center analyzed are viewed through the lens of middle-class incomes in the U.S., the share of adults who are middle class decreases in most of them. …In most Western European countries studied, applying the U.S. standard shrinks the middle-class share by about 10 percentage points… Applying U.S. incomes as the middle-class standard also boosts the estimated shares of adults who are in the lower-income tier in most Western European countries… Overall, regardless of how middle class fortunes are analyzed, the material standard of living in the U.S. is estimated to be better than in most Western European countries examined.
The main thing to understand is that there’s a big difference between being middle class in a rich country and being middle class in a not-so-rich country.
And if you peruse the chart from the Pew Report, you’ll notice that a lot of middle-class Europeans would be lower-income if they lived in the United States.
And if you looked at the issue from the other perspective, as I did last year, many poor Americans would be middle class if they lived in Europe.
Let’s augment that analysis by looking at a graphic the Economist put together several years ago. It’s based on the OECD’s Better-Life Index, which is a bit dodgy since it includes measures such as the Paris-based bureaucracy’s utterly dishonest definition of poverty.
That being said, notice that the bottom 10 percent of Americans would be middle class (or above!) if they lived in other nations.
I’ll close with the data on Actual Individual Consumption from the OECD, which are the numbers that (I believe) most accurately measure relative living standards between nations (indeed, I shared data from this source in 2010, 2014, and 2017).
As you can see, the United States easily surpasses other industrialized nations, with a score of 145.9 in 2017 (compared to the average of 100).
My final observation is that all this data is contrary to traditional convergence theory, which assumes that poor nations should grow faster than rich nations.
In other words, Europe should be catching up to the United States.