Since I’m currently in Stockholm and just gave a speech about fiscal policy, let’s take a look at Swedish taxation.
Like most western nations, Sweden became a rich nation in the 1800s and early 1900s when taxes were modest and the burden of government was very small.
How small? Government spending consumed less than 10 percent of economic output.
And limited government meant low tax burdens. Here’s a chart from a 2015 report on the history of Swedish taxation. As you can see, even rich people faced marginal tax rates of less than 5 percent in the 1800s and just a bit over 10 percent up until about 1920.
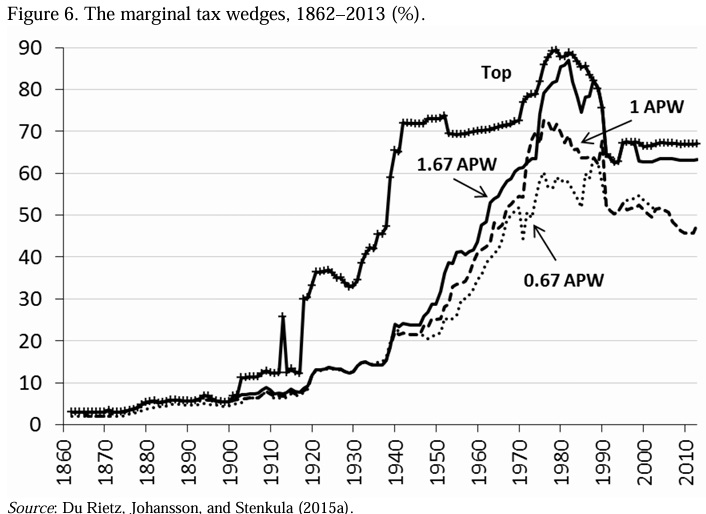
Sadly, tax rates jumped in the 1920s and then skyrocketed in the 1940s. At least for rich people. Close to 90 percent!
But as is so often the case, higher taxes on the rich were a precursor for higher taxes on everyone else. The chart also shows that marginal tax rates for middle income and lower-middle income taxpayers jumped dramatically in the 1950s and 1960s.
By the 1970s and 1980s, everyone was facing confiscatory marginal tax rates.
And don’t forget that Swedish taxpayers also had an onerous value-added tax which grabbed about 20 percent of whatever was left after income and payroll taxes.
That sounds horrible and it was horrible, but the tax burden on investment and entrepreneurship was even worse.
Here’s another chart from the report looking at the effective marginal tax rate on investment.
Before the income tax, there was no problem. And the tax burden was modest during the first half of the 1900s. But look at what happened to tax rates in the 1970s and 1980s. The effective marginal tax rate was way above 100 percent on investments financed with new shares.
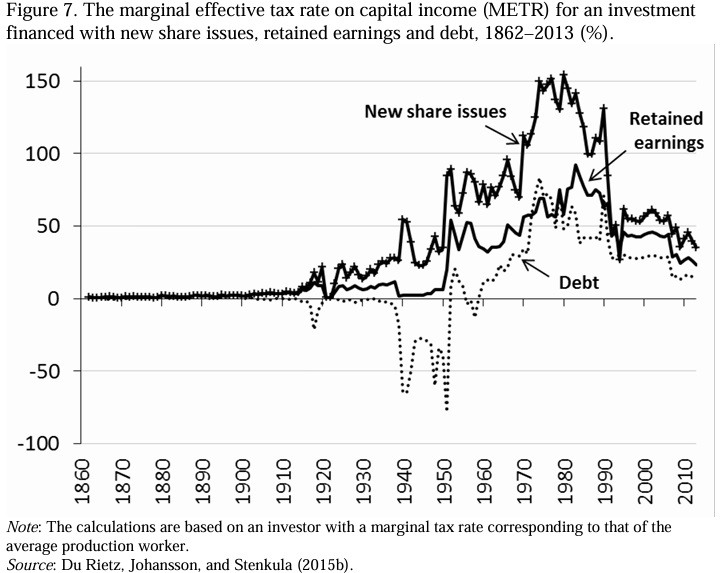
In other words, investors would have been better off dumping their money in an incinerator. And the tax rates on other types of investment also peaked about 75 percent-85 percent.
The good news, though, is that Sweden learned from mistakes. Lawmakers began lowering tax rates in the 1980s and especially in the 1990s.
But that simply meant Sweden has gone from horrible tax policy to bad policy. A step in the right direction, to be sure, but marginal tax rates on labor income are still absurdly high
There has been a bigger improvement in business taxation, which is positive, though effective marginal tax rates of 20 percent-35 percent are tolerable rather than good.
But I’ll close with some positive observations. In addition to lowering marginal tax rates, Sweden in recent years also has eliminated both death taxes and wealth taxes.
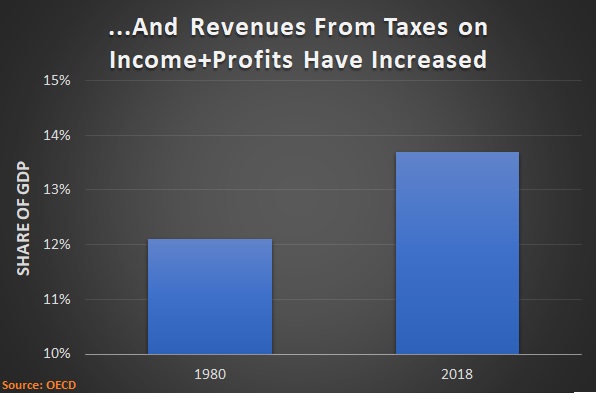
And the overall tax burden has declined.
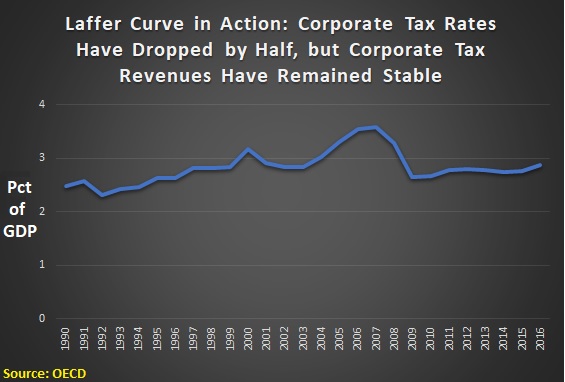
Interesting, a declining tax burden does not mean declining tax revenue. Here’s a final chart on taxation in the 21st century. The orange line shows the overall tax burden as a share of GDP and the grey bars show inflation-adjusted tax revenue.
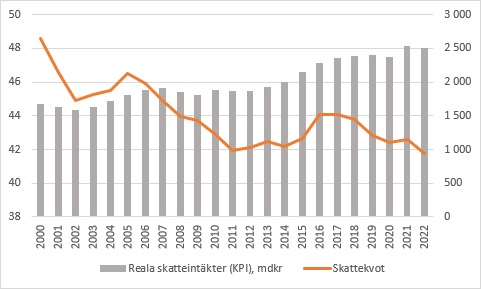
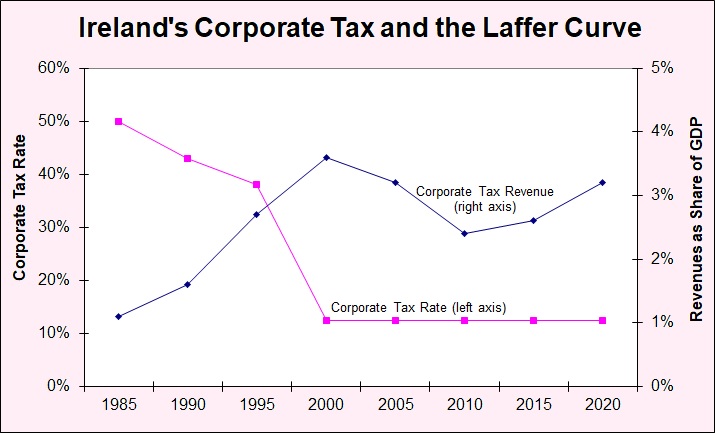
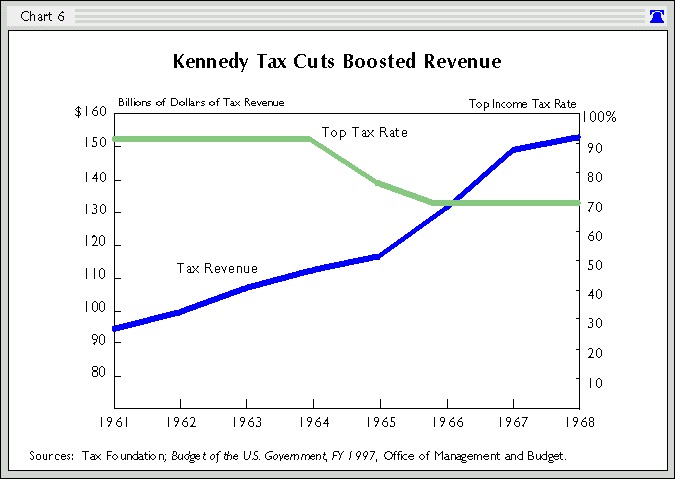
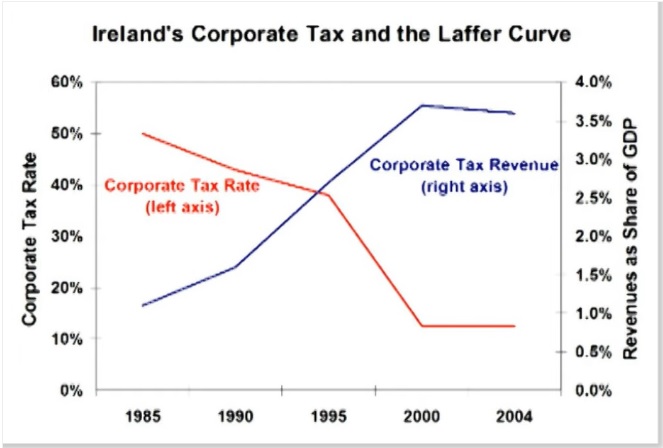
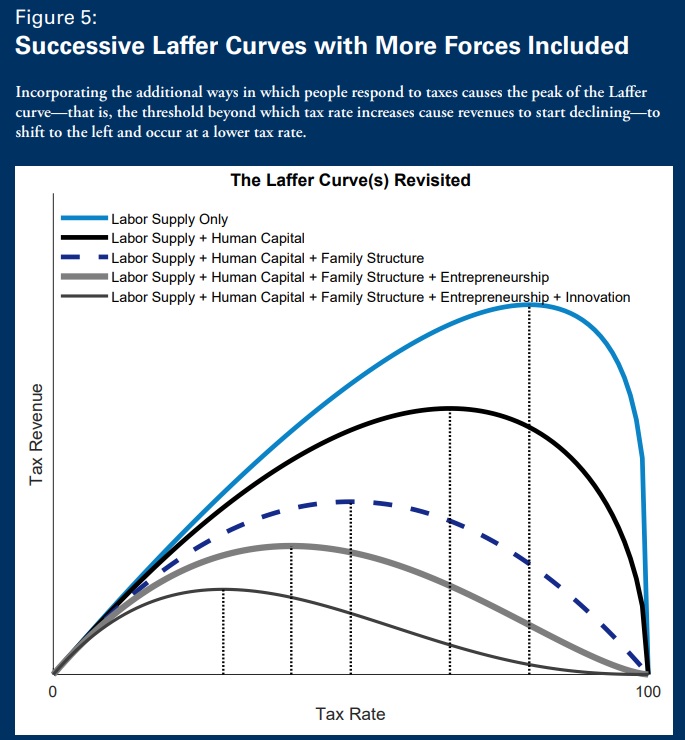
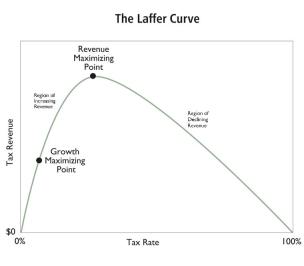
It’s almost as if the Laffer Curve is working its magic (and even Paul Krugman might agree). As it has before.
P.S. Sweden has some very admirable policies, such as school choice and a partially privatized Social Security system.


