Feeds:
Posts
Comments

Archive for the ‘Poverty’ Category

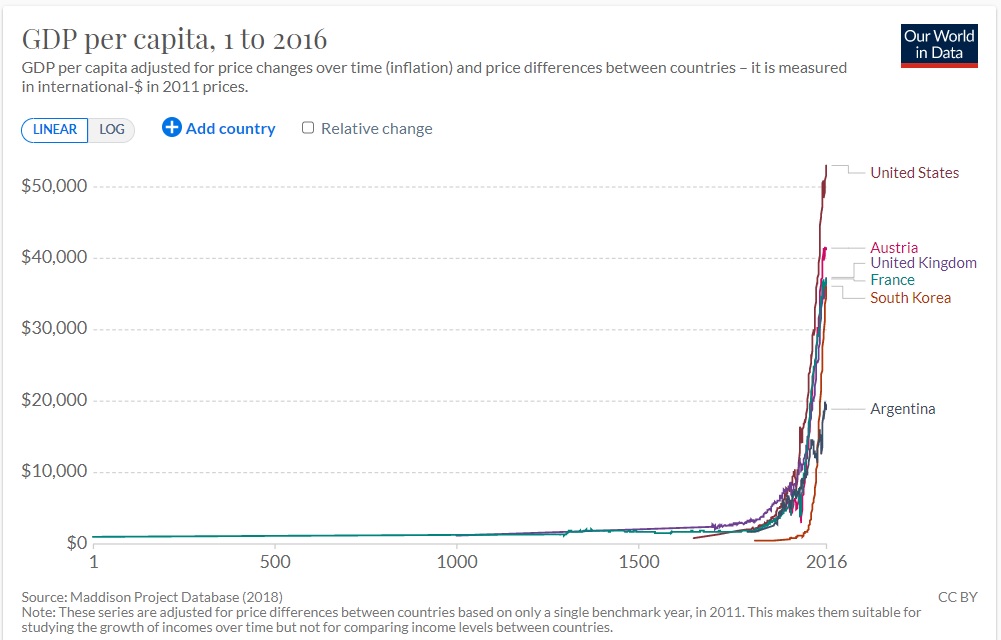
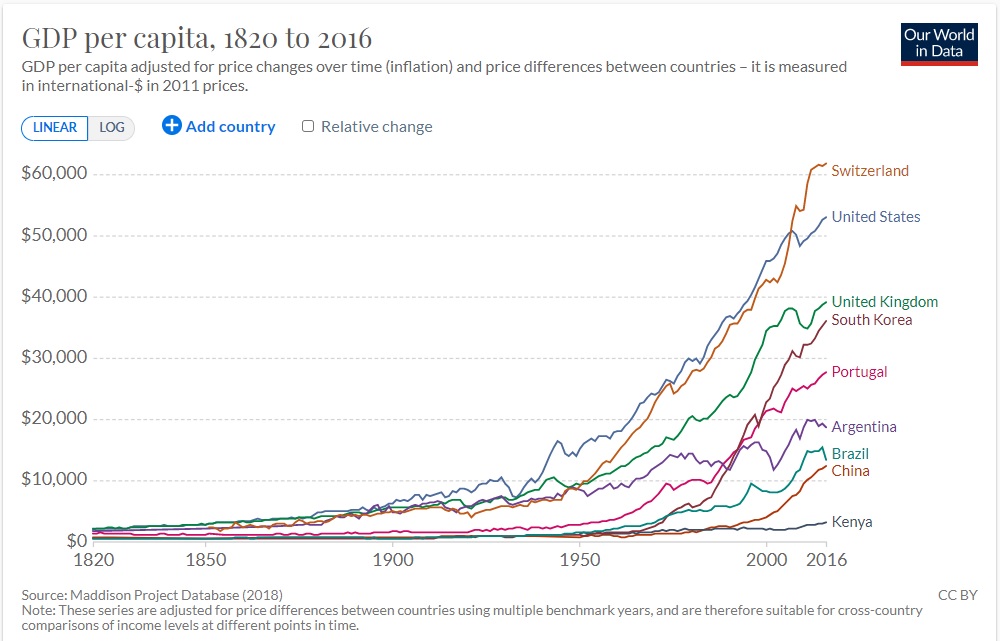
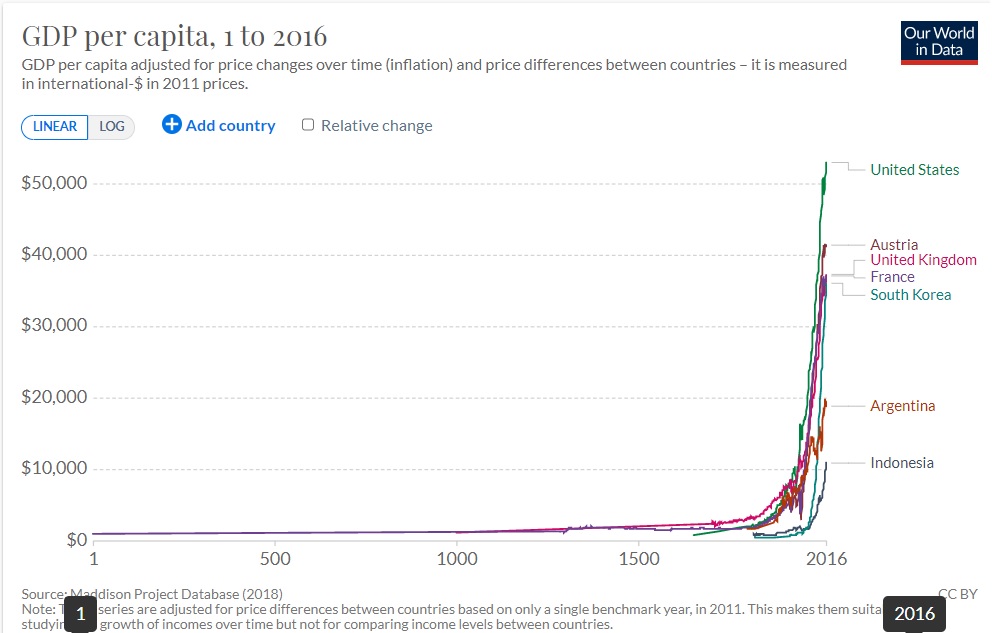
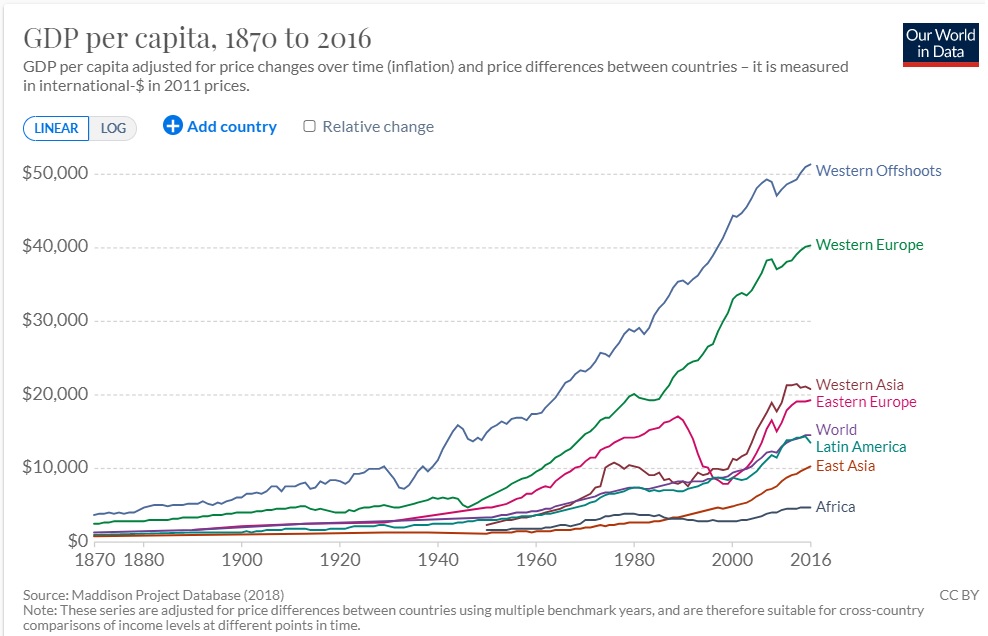
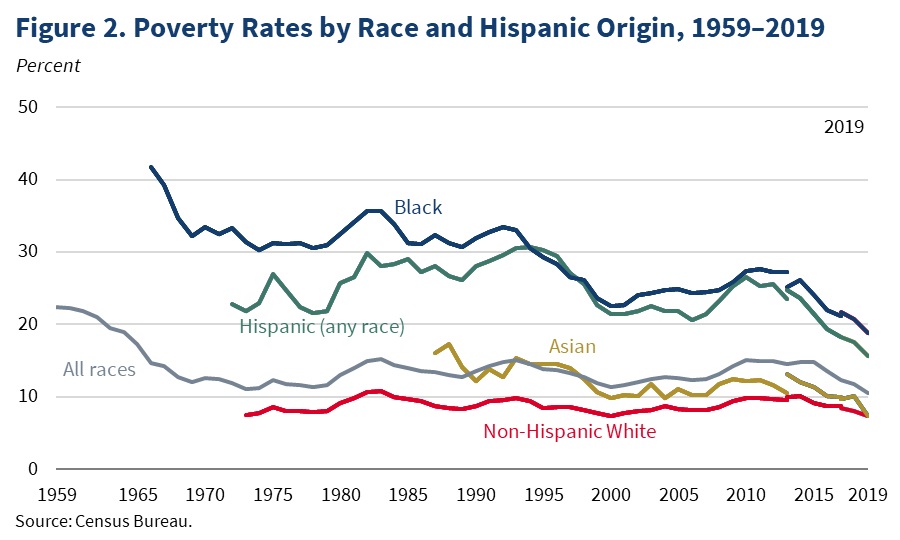
Genuine material deprivation is almost nonexistent in rich nations such as the United States. This is a huge improvement compared to how people lived just 100 or 20o years ago.

Yet public policy fights about poverty will probably never end for the simple reason that people have different goals.
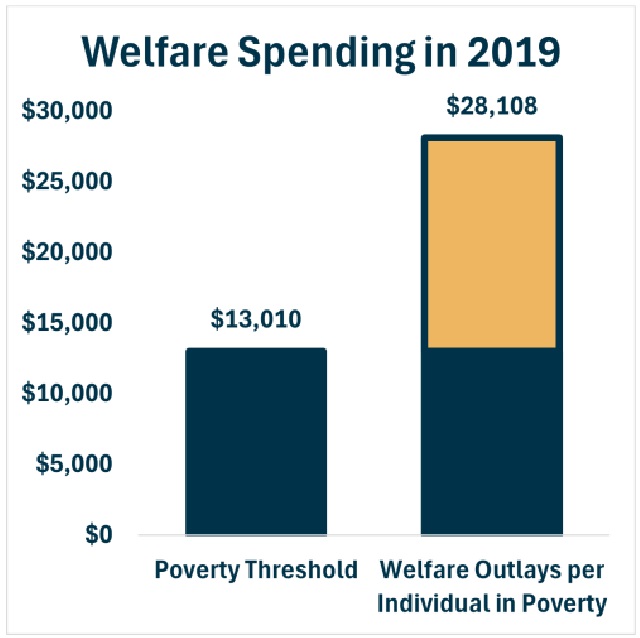
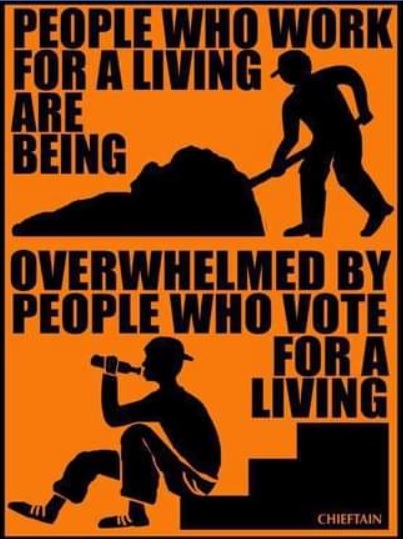
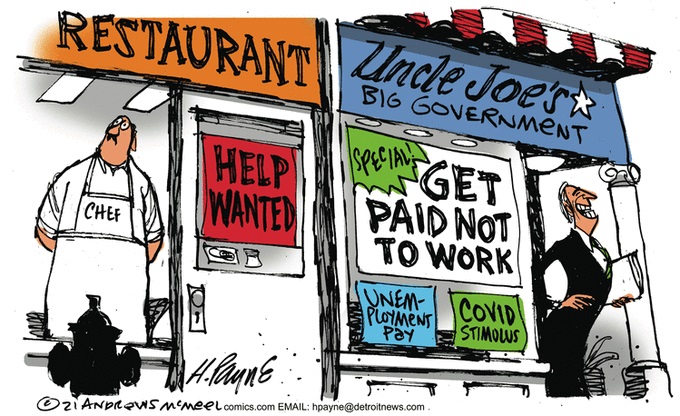
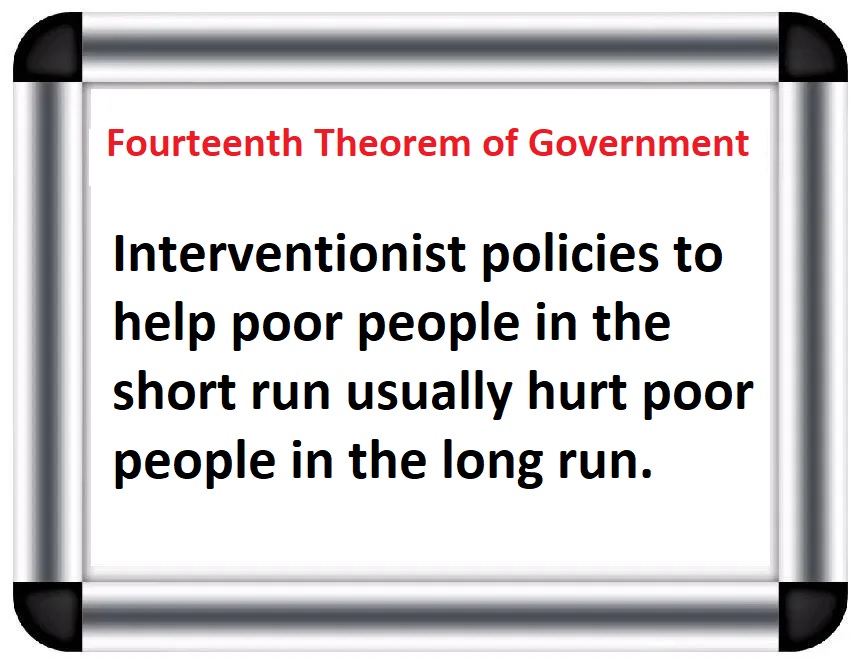
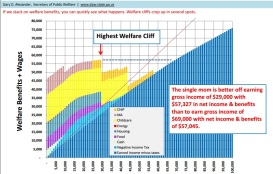
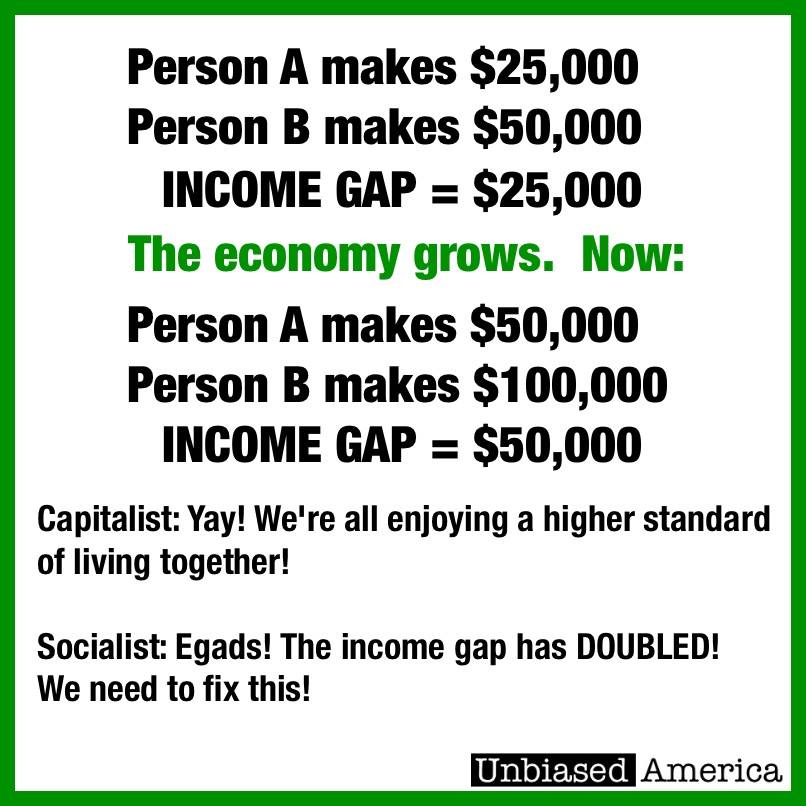
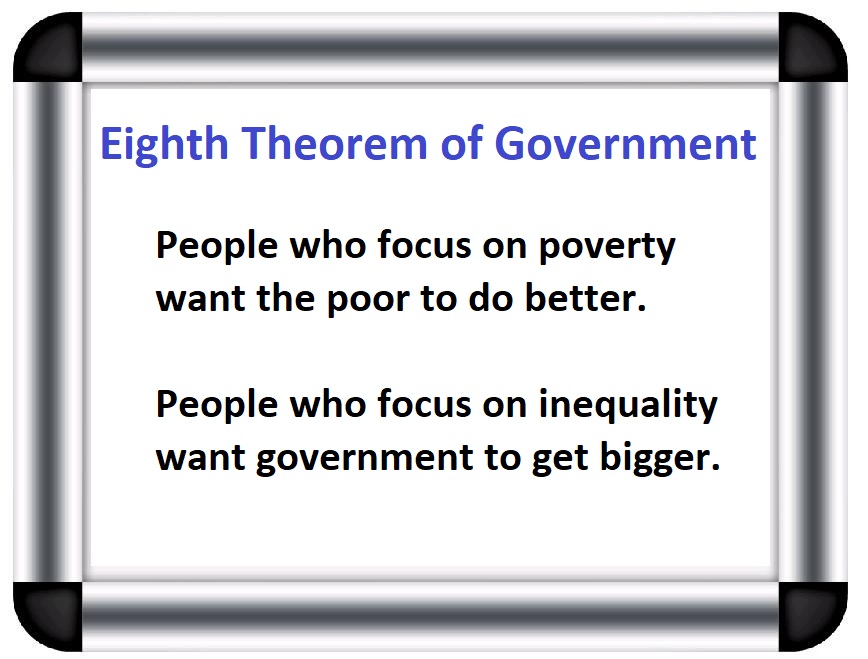
The cartoon is a good illustration of the first question.

And my Eighth Theorem of Government summarizes the second question.

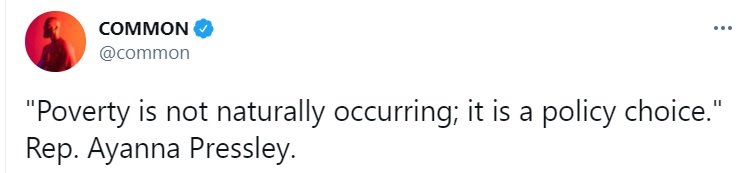
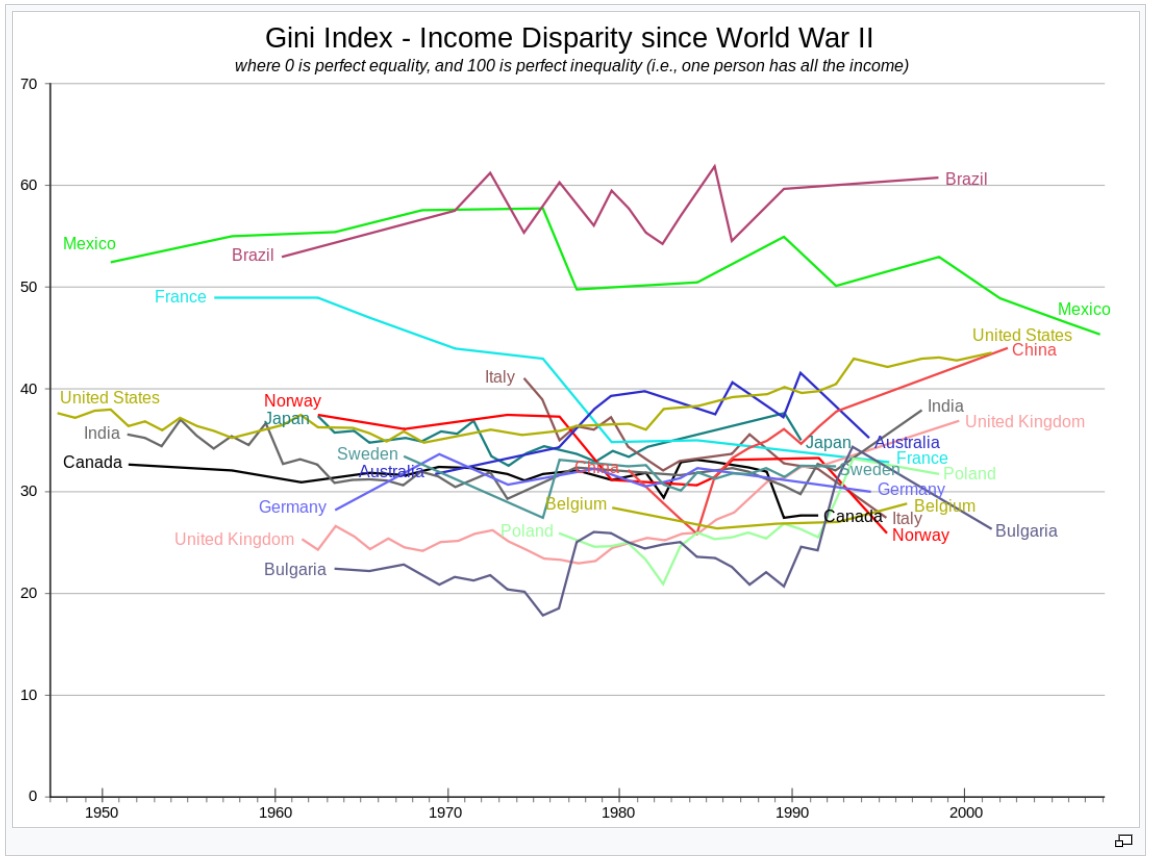
To elaborate on the second question, some of our friends on the left have blurred the distinction between poverty and inequality.

Let’s look at some excerpts from a Project Syndicate article by Teresa Ghilarducci of the New School for Social Research.

America’s retirement system isn’t working. It is failing older workers, pensioners, and would-be retirees, and if we don’t fix it soon, 
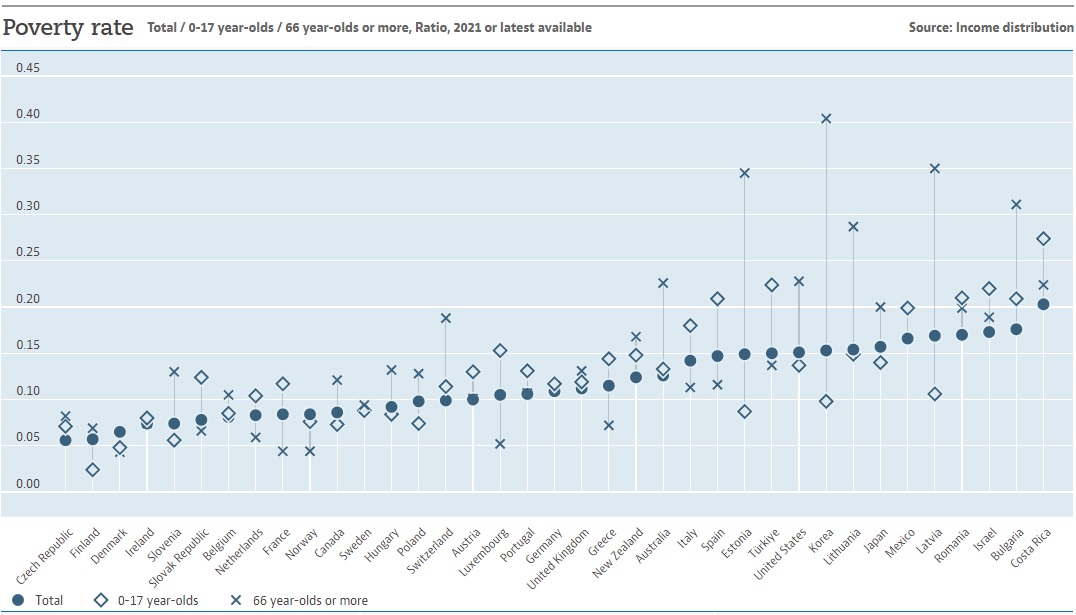
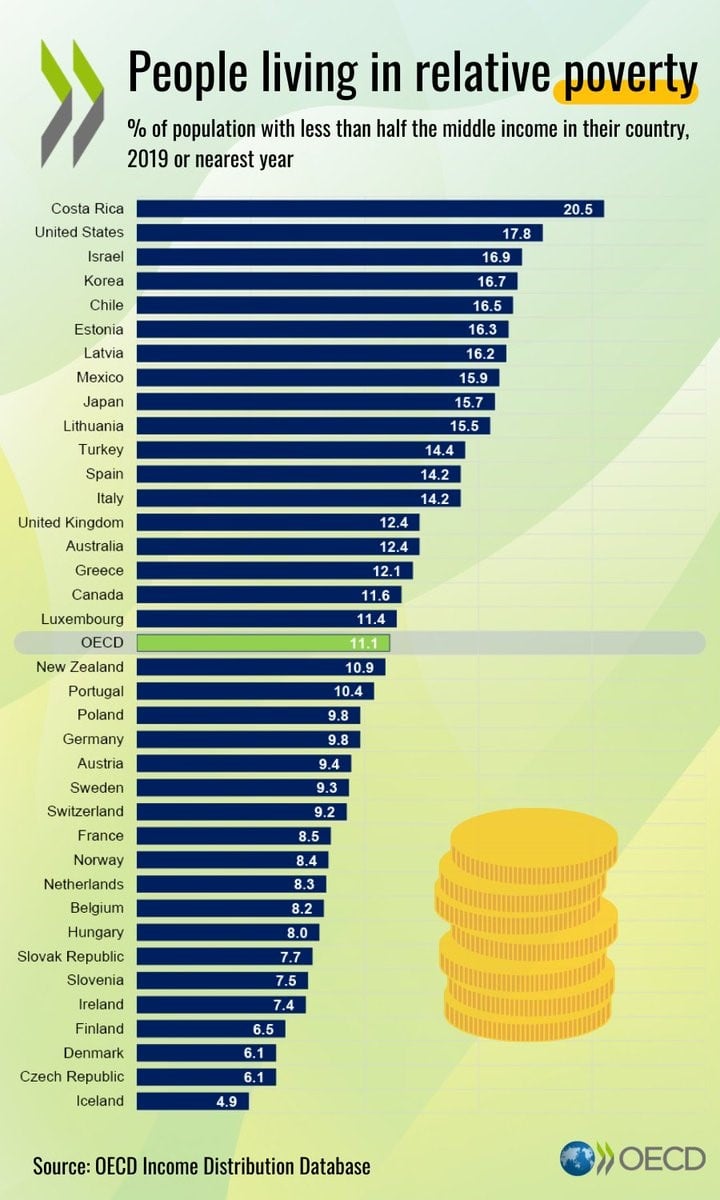
it will also fail future generations, lowering living standards and increasing the risk of poverty. …Already, America’s elderly suffer a far higher rate of poverty – defined as half the median income or lower – than their peers in other high-income countries. …the old-age poverty rate in the US is 23%, compared to about 15% in the United Kingdom, 12% in Canada, 4.4% in France, and just 3.1% in the Netherlands.

Since there are massive problems with Social Security, I agree with Ms. Ghilarducci that America’s retirement system isn’t working.

But her numbers on old-age poverty seem very strange. How can the poverty rate be much higher in the United States when the other countries she mentions have much lower living standards?

Notice, though, that she wrote that poverty is “defined as half the median income or lower.”

So if you were a millionaire and lived in a house with Jeff Bezos, Elon Musk, and Bill Gates, you would be poor based on this definition.

Needless to say, that’s crazy. Poverty should be a concrete number.

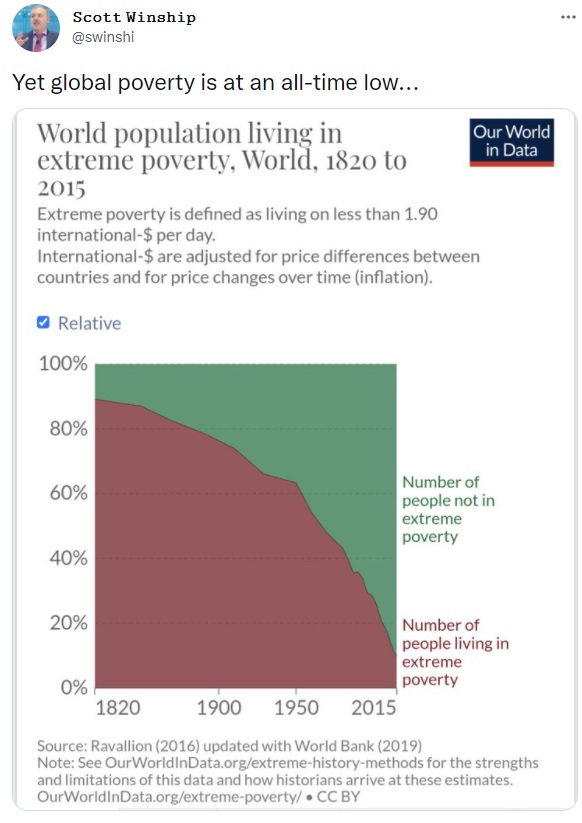
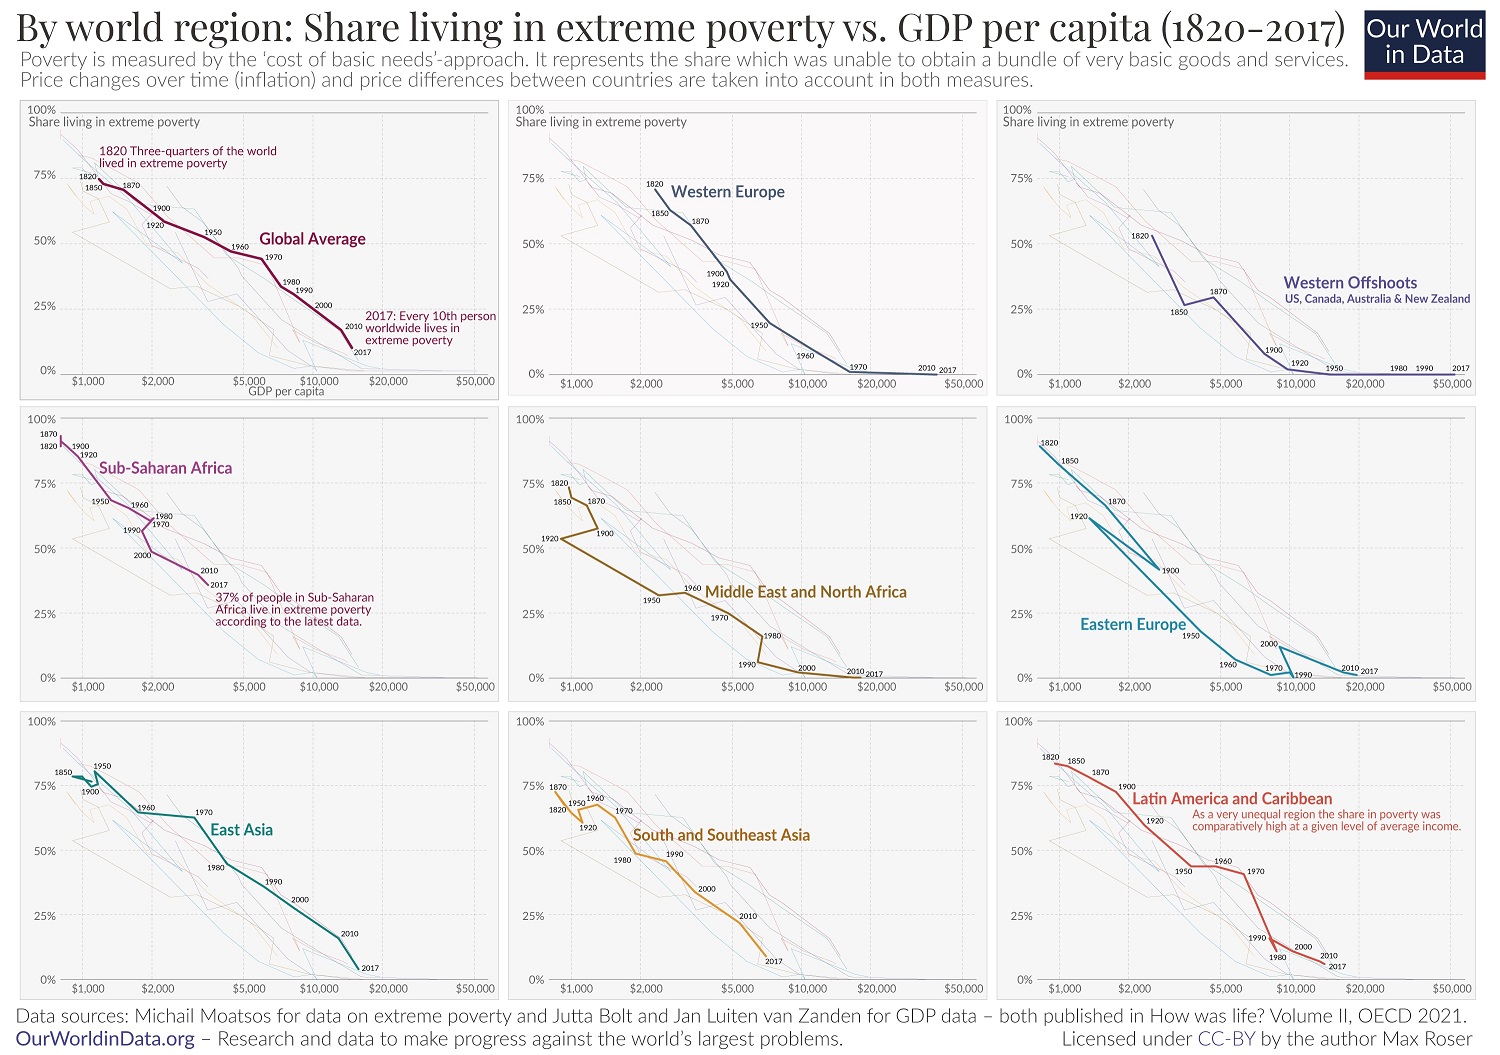
And it usually is. The World Bank (which is concerned about genuine material deprivation) measures poverty based on whether people are subsisting at very low levels, such as $1.90 per day. In the United States, the poverty rate is a specific calculation of what a household needs to subsist at a modest level.

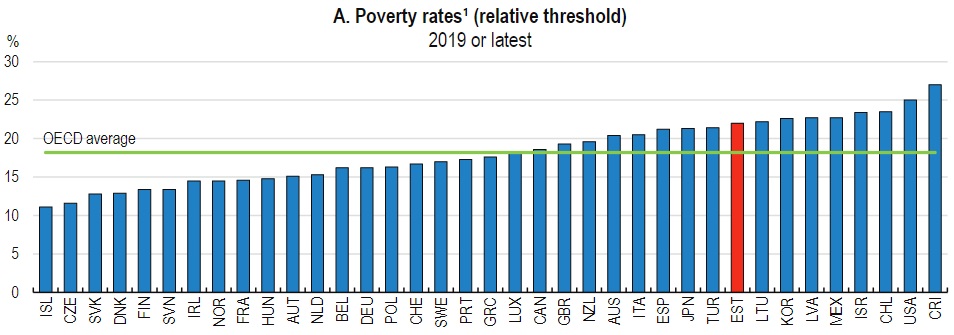
Ms. Ghilarducci’s numbers, however, come from the left-leaning bureaucrats at the Paris-based Organization for Economic Cooperation and Development.

And they have a make-believe measure of poverty based on the distribution of income.

I’m not joking, if you go to their website, you will find these crazy numbers.

  • There’s supposedly more old-age poverty in the United States than there is in countries such as Costa Rica, Greece, Italy, Poland, and Turkey.
  • There’s supposedly more overall poverty in the United States than there is in countries such as Hungary, Mexico, Portugal, Slovenia, and Turkey.

These are garbage numbers, at least for the purpose of measuring poverty.

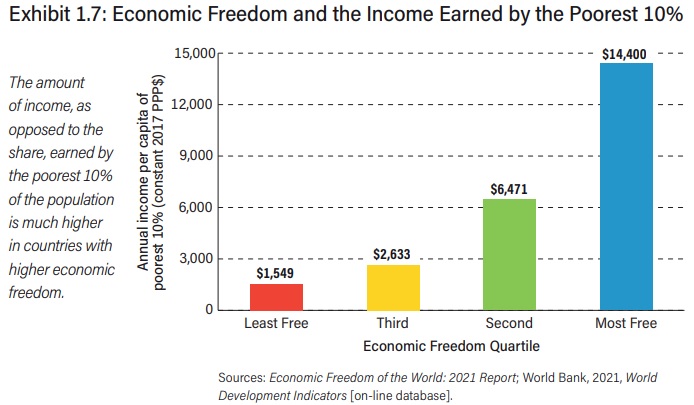
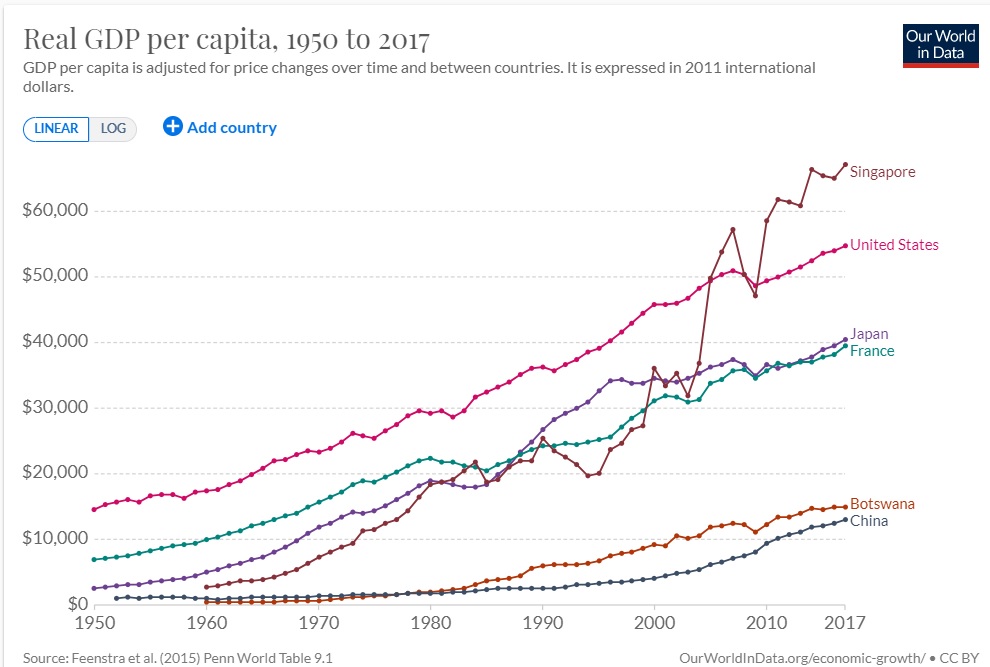
The average senior (or average person) in the United States is much better off than their counterparts in other countries.

So congratulations to Ms. Ghilarducci, who is now a member of the Poverty Hucksters Club.

P.S. In fairness to Ms. Ghilarducci, her article does make some good points about overall retirement policy. I’m sure we disagree on many things, but she favorably cites nations with private Social Security systems, such as Denmark and the Netherlands.

Read Full Post »

As part of my everything-you-need-to-know series, I shared an incomprehensible flowchart showing the ridiculous maze of federal welfare programs back in 2015.

Today, let’s look at another visual that captures what’s wrong with the Washington welfare state. As you can see, taxpayers are footing the bill for a system that spends more than twice what would be required to eliminate all poverty.

The chart comes from a new report by Matt Dickerson for the Economic Policy Innovation Center. And the purpose of the chart is to show that the welfare system is grotesquely inefficient.

Here’s some of what he wrote.

…the welfare bureaucracy is broken, making it more difficult for millions of people to achieve the American Dream. …It is demeaning to believe that many Americans are simply unable to be successful and should be relegated to a life of dependence on perpetual government subsidization of their basic needs. …the welfare bureaucracy undermines and discourages employment. Only 18% of able-bodied adults receiving Food Stamps, who are expected to meet work requirements, actually work 20 hours or more per week. …Many welfare programs undermine the institution of the family — and the benefits brought by stable two-parent households — by including marriage penalties. …The principle of subsidiarity dictates that the independent sector, communities, and local and state governments should be empowered rather than the distant and bureaucratic central government. …The welfare bureaucracy is also filled with duplication and overlapping programs. According to the Congressional Research Service, there are 15 different food aid, 13 housing, 12 health care, and five cash aid programs. …Welfare is one of the largest categories of the federal budget, comprising about 20% of annual spending. …the federal government spent more than $28,100 per person in poverty — providing benefits $15,000 above the poverty threshold for individuals

At the risk of understatement, this is an utter disaster.

Terrible for taxpayers. Terrible for poor people.

So why does it exist? This clever cartoon tells part of the answer.

But this is only a partial explanation.

Don’t forget all the bureaucrats, consultants, and contractors who make a lot of money administering the programs. Walter Williams called them “poverty pimps” and they have an obvious incentive to maintain the current system.

I’ll close by emphasizing a point from Matt’s EPIC report. The answer is to get Washington out of the redistribution racket. In other words, copy the success of Bill Clinton’s welfare reform by turning all welfare programs into block grants and putting states back in charge. With the ultimate goal, of course, of phasing out the block grants so that states are fully responsible for raising and spending the money.

P.S. The goal should not merely be reducing poverty, but also reducing dependency.

Read Full Post »

If I want to educate someone about the harmful impact of America’s counterproductive welfare state, there are several items I like to share.

I augment those visuals with other analysis, such as my two-part series (here and here) on the right and wrong way to reduce poverty (Hint: the ultimate goal should be reducing dependency).

And I just read a sobering article by John Goodman that I’ll add to my list. Here are two shocking/depressing findings that he shared.

First, in many cases, households that mooch get more money than households that work.

…the bottom fifth of households in 2017 had an average (after tax and after transfer) income of $33,653 per person. …The per capita income of second fifth in 2017 was $29,497; and for the middle fifth it was $32,574. Those with the least earned income had more actual total income than those in the next two higher quintiles! The average household in the bottom fifth received 14 percent more income than the average second-fifth household and 3.3 percent more than the average middle-income household.

As you might predict, people respond to incentives. John reports that the excessive welfare state has greatly undermined incentives to be productive.

Since the War on Poverty started in 1965, the labor force participation of the bottom one-fifth of households has dropped from 70 percent to 36 percent. As a group, this one-fifth now receive more than 90 percent of their income from government. For this group, our welfare system has substituted in-kind benefits for labor market income.

These two sets of numbers are horrific. We basically have a system that tells people they are chumps if they work. Their reward for work is to pay taxes.

But if they become wards of the state, they can play video games all day and get lots of freebies.

That’s a recipe to destroy societal capital.

P.S. For readers who want some international evidence, I have a three-part series (here, here, and here) on how the welfare state is hurting European nations.

P.P.S. The Biden Administration wants to lie about the definition of poverty. Which may or may not be worse than their celebration of dependency.

P.P.P.S. Here’s a ranking of which states exacerbate the problem of redistribution.

Read Full Post »

In Part I of this series, I explained that the War on Poverty, launched by Lyndon Johnson and expanded by other profligate presidents, has been bad news for both taxpayers and poor people.

More specifically, I shared some academic research showing how it led to a big increase in dependency on government.

Let’s expand on that topic today by looking at a column published last week by National Review.

Authored by Angela Rachidi of the American Enterprise Institute, it compares the two ways of reducing poverty and deprivation. Here are some excerpts.

President Johnson introduced his Great Society agenda, setting the stage for the vast federal anti-poverty bureaucracy that we have today. Passage of programs such as Medicaid, Head Start, and a nationalized Food Stamp Program followed, and today, the federal government funds more than 80 means-tested programs or services… Unsurprisingly, this approach set the federal government on a disastrous fiscal path. Federal expenditures on means-tested programs have increased eightfold since the War on Poverty started, equating to an additional $800 billion per year in today’s dollars. …expanding transfer payments to reduce the poverty rate was simply a mathematical achievement. Fundamentally improving the lives of poor families has proved an entirely different task. …the key to the problem of poverty in this country was a failure among young people to achieve key life milestones. …when young people graduated high school, worked full-time, and married before having children, their odds of living in poverty dramatically reduced. …Analyzing 15 years of longitudinal data consisting primarily of poor unmarried mothers…, I find that many disadvantaged unmarried mothers were able to rise out of poverty when they later achieved success sequence milestones, even though they started on a different path. For example, 15 years after giving birth to a child outside of marriage, only 9 percent of mothers who earned a high school education, worked full-time, and later married were in poverty. Among mothers who failed to complete any of those three steps, the poverty rate was 79 percent.

Those “success sequence milestones” sounded familiar.

Sure enough, they are similar to what my late, great, friend Walter Williams wrote many years ago.

The problem, of course, is that government penalizes you if you get a job or get married.

Though I’m guessing the problem is worse in places like New York in California than in states like Florida and Texas.

P.S. Biden and other folks on the left want to bastardize the definition of poverty in hopes of further expanding the welfare state and creating more dependency.

Read Full Post »

I’ve previously pointed out that the so-called War on Poverty is a failure, both for poor people and for taxpayers.

My main argument is that poverty was steadily declining throughout American history, but that progress ground to a halt once politicians in Washington decided to spend trillions of dollars.

As you might expect, folks on the left have a different perspective. Or, to be more precise, they have two different perspectives.

  1. Some left-leaning people assert that that the post-1965 lack of progress is evidence that we need to have even more redistribution.
  2. But some of them instead assert that there has been a lot of progress, but not the kind that shows up in the official measure of poverty.

Today, let’s examine the second argument.

We’ll start with a chart showing many different ways to measure poverty.

The official poverty rate (“Official Poverty Measure”) comes from the Census Bureau and it gets the most attention in the media and elsewhere.

But is it the right measure, and does it show the impact of redistribution programs?

In a study published by the Journal of Political Economy, Richard V. BurkhauserKevin CorinthJames Elwell, and Jeff Larrimore put together a “full poverty measure” that captures the value of various handouts.

Based on their approach, there is almost no material deprivation in the United States. Their poverty rate as of 2019, shown in the above chart, was just 1.6 percent.

Here’s some of what they wrote.

Almost 60 years have passed since President Johnson declared his War on Poverty. Even so, academics and policy makers still debate its outcome. …disagreement over progress in the War on Poverty stems from disagreements over how poverty should be defined… We…create a poverty measure…which we refer to as the absolute full-income poverty measure (FPM)… We include both cash and in-kind programs designed to fight poverty, including food stamps (now the Supplemental Nutrition Assistance Program [SNAP]), the school lunch program, housing assistance, and health insurance. Finally, we hold poverty thresholds constant in inflation-adjusted terms using the Personal Consumption Expenditures (PCE) price index. Using this poverty measure, we find substantial reductions in poverty based on President Johnson’s standards. Specifically, we find that the absolute FPM poverty rate in 2019 was 1.6%, well below the official poverty rate of 10.5%.

Incidentally, the official poverty rate is now 11.5, so perhaps the authors’ FPM measure also has increased a bit.

But that’s not important for our discussion today. Instead, let’s consider whether their FPM measure shows that the War on Poverty has been a success.

The answer depends, at least in part, of whether you think government dependency is an acceptable outcome.

Here are some further excerpts from the study.

…we evaluate the extent to which poverty has fallen as a result of increases in market income versus increases in government transfers. As President Johnson further stated in his State of the Union address on January 8, 1964, “The War on Poverty is not a struggle simply to support people, to make them dependent on the generosity of others”… Contrary to this goal of President Johnson, we estimate that dependence—which we define as receiving less than half of full-income from market sources—among working-age individuals increased from 4.7% to 11.0% between 1967 and 2019. Likewise, dependence among children increased from 6.0% to 13.1%. …Success in reducing material hardship has come at the cost of having a greater share of the population dependent on government for at least half of their incomes.

Here are some charts from the JPE article, all of them showing how dependency increased for just about all groups in society.

Here’s one final excerpt, showing the difference between the right way and wrong way of reducing poverty.

…the War on Poverty…was not won by making people more self-sufficient, as President Johnson sought. Dependence (defined as receiving less than half of household income from market sources) among working-age adults and children more than doubled from 1967 to 2019. However, the rise in dependence was not uniform over the entire period, with dependence falling substantially, especially among children and non-aged Black individuals, from 1993 to 2000. This period is coincident with welfare reforms that required and encouraged work as well as a strong labor market.

This echoes my view that Bill Clinton’s welfare reform (replacing an entitlement with a block grant) was very successful and that it should be extended to other redistribution programs such as Medicaid and food stamps.

And it reinforces my view that Biden’s proposal for per-child handouts would be very harmful. The goal should be employment and self-sufficiency, not dependency and bigger government.

P.S. We can learn lessons about welfare and dependency by looking at data from Europe and Canada.

Read Full Post »

This series has reviewed Biden’s dismal record with regards to subsidiesinflation, protectionism, household income, fiscal policy, red tape, and employment.

Today, let’s add poverty to the mix.

We’ll start with a very depressing chart from Kevin Hassett about worsening poverty in the United States.

The chart appeared in National Review. Here are some excerpts from the accompanying article.

…the latest poverty figures…extremely grim. Inflation makes the purchase of necessities more costly, forcing those with less means to make difficult trade-offs. Poverty and deprivation can also create secondary effects driven by despair or necessity. …overall poverty increased in the short period between 2021 and 2022 from 7.8 percent of the U.S. population to 12.4 percent. While that top-line number is a stunning increase, the cross-sectional detail of the numbers highlights that specific groups have been hit harder than others. Female-headed households saw their poverty rate increase from 11.7 percent to 22.6 percent. Individuals without a high-school education saw their poverty increase from 19.7 to 29.7 percent. …Why the big jump? …When goods get more costly, the same amount of income gets spread thinner and thinner. While income could in principle rise to offset the higher cost of goods, that did not happen on average… The inflationary policies that contributed to the crisis were driven recently by President Biden and the Democrats… The latest numbers are only through 2022, and they likely worsened in 2023.

Kevin points out that some of the increase in poverty was caused by reduced redistribution (such as no more pandemic-era “stimulus” goodies and presumably no more per-child handouts).

So it would be interesting to find out if there was a breakdown of how much poverty rose for a bad reason (declining inflation-adjusted income) and how much it rose for a different reason (fewer goodies from Uncle Sam).

The goal, of course, is so have poverty decline because of economic growth and people becoming self-sufficient. It’s not progress, though, if poverty falls simply because people get a lot of handouts (something Biden used to understand).

Read Full Post »

I have written dozens of columns explaining why a value-added tax would be very bad for the United States, mostly because it would encourage and enable a much bigger burden of government spending.

That argument is compelling when I’m speaking to conservatives (though not all of them, apparently!), but I need different arguments when talking to my friends on the left.

Fortunately, I now have some very persuasive data that hopefully will make left-of-center types much less likely to support a VAT.

Look at this graph, which clearly shows a strong relationship between higher value-added taxes and higher poverty.

The chart comes from a recent study by Manuel Schechtl for Social Policy and Society, published by Cambridge University Press.

He investigated the extent to which valued-added taxes push households into poverty.

Poor households spend a higher share of their disposable income on consumption simply because consumption does not increase proportionally with income. …This study aims to evaluate the change in poverty rates before and after deducting consumption taxes (consumable income poverty) and the increase in poverty (consumption tax induced poverty) across household types. …Figure 2 indicates the overall percentage point increase in poverty plotted against the implicit consumption tax rate. The pattern reveals a clear positive association between consumption tax and poverty increase – for instance, consumption taxes in Slovenia and Hungary lead to an increase in poverty of over ten percentage points compared to about four percentage points in Mexico or Switzerland (which have lower implicit consumption tax rates).

Very depressing findings, at least for those of us who don’t like high taxes.

But there is a big methodological flaw in the study.

It relies on a dishonest definition of poverty, one that is used by ideologues who want to exaggerate societal problems.

…poverty is measured as below fifty percent of median disposable household income.

For what it is worth, this approach measures the distribution of income in a society, not material deprivation or some other tangible definition of actual poverty.

Having pointed out this flaw, I don’t know if the author is trying to be dishonest. He may have simply relied on data from a group (like the OECD) that does have a dishonest agenda.

However, this methodological flaw does not undermine Schechtl’s core point. There’s no question that value-added taxes reduce the ability of poor people to consume. And I would not be surprised if a chart based on honest data looked very similar to the one shown above.

The moral of the story is that all good people – on the right and on the left – should reject the value-added tax.

P.S. One of the reasons I get upset about the Biden/Trump approach to entitlements is that I fear it would make a VAT more likely.

Read Full Post »

There are three troubling things about the politics of poverty.

First, I frequently grouse and complain that some folks on the left don’t actually care about helping poor people. Instead, as explained in my Eighth Theorem of Government, they simply use poor people as props so they can expand the size and scope of the welfare state.

Second, I sometimes speculate that our friends on the left are more motivated by a disdain for the rich than they are by any desire to help the less fortunate (something that Margaret Thatcher observed many decades ago).

Third, some people knowingly (or perhaps in a few cases, unknowingly) lie by asserting that income inequality is the same thing as poverty – even if it means absurd conclusions such as there being more poverty in the United States than in Mexico.

For purposes of today’s column, we’re going to focus on this third group because lying about poverty may soon become official government policy.

In a column for the Wall Street Journal, the American Enterprise Institute’s Kevin Corinth warns that the Biden Administration is thinking about turning poverty hucksterism into official government policy.

A new report from the National Academy of Sciences seeks to redefine poverty. …the report’s real purpose could be to expand the welfare state. If the Census Bureau adopts the new poverty definition, millions more Americans could automatically be made eligible for benefits—leading to at least $124 billion in additional government spending over the next decade… It would also break with more than 50 years of precedent by establishing a relative standard. People could become better off and still be classified as “poor”; poverty would decline only if income at the bottom of the distribution increases more quickly than in the middle class. …Redrawing the official poverty line would be a nakedly political move without any scientific basis that could alter the scope of the safety net overnight.

I suspect readers won’t be surprised to learn that the report was put together by a very biased panel.

The 13 authors of the recent NAS paper appear to have been selected along partisan lines: 12 of them have contributed to Democratic causes or worked for Democratic administrations.

And I also suspect that nobody will be surprised to learn that a secondary effect will be to steer more redistribution to left-wing states.

As consequential is the potential reallocation of government assistance across states. The poverty line under the Supplemental Poverty Measure is higher in states like California and New York…and lower in states like West Virginia and Mississippi.

Adding $124 billion of additional cost to the welfare state would be bad news for taxpayers.

But the worst thing about this scheme is that it would enshrine dishonesty into Washington’s welfare state.

As I wrote a few years ago, it would be “insanely dishonest.” That’s because “everyone’s income could double and the supposed rate of poverty would stay the same.” Or that “a country could execute all the rich people and the alleged rate of poverty would decline.”

And now the Biden Administration is thinking about turning this type of dishonesty into official policy (which is hardly a surprise since the Obama Administration thought this awful idea was the right approach).

P.S. For anyone who actually wants to help poor people, we already know what works.

Read Full Post »

There are some policy fights that focus on technical disagreements (for instance, how much do deadweight losses increase when tax rates go up?) and other policy fights that involve moral disagreements (for instance, should drugs be legalized when that may lead some people to harm themselves?).

Other policy fights, however, involve dishonesty.

Poverty hucksters might be the most irritating example. These are the people who push an utterly dishonest definition of poverty, which I first wrote about back in 2010. But this article from 2019 has the best summary.

…folks on the left have decided to use an artificial and misleading definition of poverty. One that depends on the distribution of income rather than any specific measure of poverty. Which is insanely dishonest. It means that everyone’s income could double and the supposed rate of poverty would stay the same. Or a country could execute all the rich people and the alleged rate of poverty would decline. No wonder the practitioners of this approach often produce absurd data, such as the OECD’s assertion that there’s more poverty in the United States than in basket case economies such as Greece and Italy.

Sadly, the many complaints from me and others have not stopped the poverty hucksters.

Here’s a chart I just downloaded from the Organization for Economic Cooperation and Development, one of the organizations pushing the dishonest measure of poverty.

As you can see, they want people to believe that there’s more poverty in the United States than in nations such as Turkey, Italy, and Greece.

Heck, they also want people to think the wealthy nations of Luxembourg and Switzerland have more poverty than Hungary.

I’m sharing this information because it’s time to add a new member to our collection of poverty hucksters.

Timothy Noah of the New Republic has a column in the Washington Post that utilizes the OECD’s inaccurate definition of poverty. Here are some excerpts from his article.

How can the richest nation on Earth have so much poverty? …The Bible tells us that the poor are always with us. But devout resignation can’t explain why the United States, with the world’s largest economy (gross domestic product: $26.15 trillion) should house more poverty than many much poorer countries. In 2021, the Organization for Economic Cooperation and Development ranked 37 member nations by poverty rate. Costa Rica had the highest rate, followed by Bulgaria, but way up there at No. 10 was the United States. …We may not have the means to eliminate poverty. But we can certainly do better than Estonia.

If you read Noah’s entire article, you’ll quickly see why he uses the OECD’s dishonest data.

Like Biden, he wants a massive expansion of class-warfare taxation and a big increase in the welfare state, so it is in his interest to portray America as a dystopian hellscape of suffering and deprivation.

It would be nice, however, if he relied on accurate data. Then again, accurate data would backfire on him.

Read Full Post »

My Fourteenth Theorem of Government explains that when government intervenes for the ostensible purpose of providing help to poor people in the short run, it is all but inevitable that such policies will hurt poor people in the long run.

It is hardly a revelation that bigger government causes problems, but it is particularly discouraging when such policies victimize the least fortunate members of society.

I’m discussing this issue today because I recently discovered a 2018 article by Brian Balfour.

Published by the Foundation for Economic Education, the article lists seven ways that government traps people in poverty.

At the risk of over-simplifying, four of those policies directly hurt poor people.

  1. The “quicksand effect” of the welfare state, which discourages self-advancement.
  2. Minimum wage laws that remove the bottom rungs of the economic ladder.
  3. Green energy policies that make basic utilities needlessly expensive.
  4. Protectionist trade policies that increase the price of essential products.

And three of those policies indirectly hurt poor people.

  1. Punitive tax policies that discourage job creation and productivity advances.
  2. Regulatory policies that impose high costs and cause inefficiency.
  3. Inflationary monetary policies by central banks that cause higher prices.

There’s nothing in the article that’s wrong, but I’m going to conclude today’s column by pointing out a big sin of omission.

The author’s list should have included the government education monopoly. Especially since poor families tend to live in the areas with the worst-performing government schools.

Failing government schools have a very direct and very negative impact on the life prospects of low-income kids.

So I’ll end by noting that I’m very excited that school choice is beginning to sweep the nation.

P.S. There are many other government policies that have a disproportionately negative impact on poor people. Everything from Social Security to revenue policing, but don’t forget government lotteries, licensing laws, and nanny state protections (all of which may help to explain why poor people are skeptical about the supposed benefits of bigger government).

Read Full Post »

A big argument for free enterprise over statism is that the former delivers growth while the latter leads to stagnation.

And that’s very apparent when you review decades of data.

The case for capitalism is especially powerful if you care about what’s best for the disadvantaged. As the chart from Economic Freedom of the World illustrates, poor people enjoy much higher levels of income in nations that have higher levels of economic liberty.

So why, then, do our friends on the left support bigger government?

There are several possible answers, but today let’s focus on their understandable desire to do things that seem compassionate. Particularly things that seem to offer immediate help.

I think that’s a big reason why some well-meaning leftists support a big welfare state even though there is plenty of evidence that poor people get trapped in dependency. They are so focused on doing something that ostensibly alleviates today’s problems that they do not appreciate the risk of harmful long-run consequences.

This problem is so pervasive that we need to create a new Theorem of Government.

If you want an example of this Theorem, we can look at a story in today’s New York Times.

Reporters Jeanna Smialek and  document how low-income people are being hurt by inflation and will probably be hurt by what will be needed to curtail inflation.

…data and anecdotes suggest that lower-income households, despite the resilient job market, are struggling more profoundly with inflation. That divergence poses a challenge for the Federal Reserve, which is hoping that higher interest rates will slow consumer spending and ease pressure on prices across the economy. Already, there are signsthat poorer families are cutting back. …The Fed might need to raise interest rates even more to bring inflation under control, and that could cause a sharper slowdown. In that case, poorer families will almost certainly bear the brunt again, because low-wage workers are often the first to lose hours and jobs. …America’s poor have spent part of the savings they amassed during coronavirus lockdowns, and their wages are increasingly struggling to keep up with — or falling behind — price increases.

The story is filled with anecdotes about poor people suffering from inflation.

And, as the above excerpts captures, it has plenty of fretting about how the less fortunate will suffer as the Federal Reserve tries to fix the mess.

But what you won’t find in the story is any acknowledgement that poor people would not be dealing with this hardship if the Federal Reserve had not made the mistake of creating too much liquidity in the first place.

Yet this is the big lesson all of us should learn.

The Federal Reserve wanted to offer short-run help to the economy, motivated in part by a desire to help poor people by propping up the economy during the pandemic.

Yet any short-run help has been swamped by subsequent negative consequences.

And this is not unique. The big lesson from the so-called War on Poverty is that poverty rates suddenly stopped declining. In other words, government tried to help, but wound up doing harm.

P.S. Here are the other 13 Theorems of Government.

  • The “First Theorem” explains how Washington really operates.
  • The “Second Theorem” explains why it is so important to block the creation of new programs.
  • The “Third Theorem” explains why centralized programs inevitably waste money.
  • The “Fourth Theorem” explains that good policy can be good politics.
  • The “Fifth Theorem” explains how good ideas on paper become bad ideas in reality.
  • The “Sixth Theorem” explains an under-appreciated benefit of a flat tax.
  • The “Seventh Theorem” explains how bigger governments are less competent.
  • The “Eighth Theorem” explains the motives of those who focus on inequality.
  • The “Ninth Theorem” explains how politics often trumps principles.
  • The “Tenth Theorem” explains how politicians manufacture/exploit crises.
  • The “Eleventh Theorem” explains why big business is often anti-free market.
  • The “Twelfth Theorem” explains you can’t have European-sized government without pillaging the middle class.
  • The “Thirteenth Theorem” explains that people are unwilling to pay for bloated government.

Read Full Post »

The past two days have featured columns about Estonia, with the first one focusing on the nation’s impressive rebound after decades of communist enslavement and the second one criticizing the Organization for Economic Cooperation and Development (OECD) for suggesting tax-and-spend policies that would undermine the country’s prosperity.

Both columns used data from a recent OECD report. Today, I’m going to write a third column using data from that report, but I won’t be focusing on Estonia. Instead, I want to address the OECD’s ongoing efforts to promote redistribution by lying about poverty.

Here’s a chart that ostensibly shows poverty rates in various member nations.

Any sentient person should immediately recognize that the chart is garbage. Notice, for instance, that that United States supposedly has the second-highest poverty rate among OECD nations.

Yet does any rational person actually think poverty is a bigger problem in America than it is in Mexico or Turkey? Or Italy, Hungary, or Greece?

Of course not. Heck, poor people in the United States often have incomes that are equal to or higher than average incomes in other nations.

So what’s going on?

Well, if you read the fine print, you’ll find that the chart doesn’t actually measure poverty. At all.

Instead, it’s a measure of income distribution. The OECD’s bureaucrats have decided that anybody who makes less than 60 percent of a nation’s average income is poor.

This is an absurd approach.

Heck, the OECD’s dishonest approach would show that there’s almost no poverty in the world’s poorest nations, such as North Korea, Haiti, Cuba, and Congo. After all, if almost everyone is equally destitute, then almost nobody will be below 60 percent of the median.

Here’s another example that exposes the OECD’s scam. Imagine that everyone in the United Sates suddenly had three times as much income as today. That would seem like great news, especially for lower-income Americans. Yet based on the OECD’s dishonest approach, the poverty rate would not change.

So why is the OECD publishing nonsensical and dishonest numbers?

I answered that question back in 2012.

The main thing to understand, though, is that this new approach is part of an ideological campaign to promote bigger government and more redistribution. Which is very much consistent with the OECD’s overall agenda.

The fact that this type of agenda hurts poor people doesn’t seem to bother our friends on the left. So long as rich people are hurt even more, that’s a good thing from their perspective.

Remember, they are motivated by equality of outcomes.

Good people, by contrast, seek policies that enable poor people to improve their lives (as captured by the Eighth Theorem of Government).

P.S. Here’s my collection of other hucksters that peddle dishonest poverty data.

P.P.S. Here’s a story from Sweden about what happens when the ideology of equality produces very bizarre outcomes.

Read Full Post »

As far as I’m concerned, the huge reductions in global poverty in recent decades are the only evidence we need about the benefits of economic growth.

This chart I shared in 2014 shows that output doubles much faster when annual economic growth goes from low levels (1 percent or 2 percent) to high levels (4 percent or above).

I call this the miracle of compounding.

Needless to say, I also argue that nations experience high levels of growth with the right policies and the right perspective.

But not everyone thinks policy makers should focus on getting more economic growth. Some of them (the “Okunites“) are willing to sacrifice some prosperity to achieve more equality, while others dislike growth because of the environment.

In a column for the Foundation for Economic Education, Saul Zimet points out that the people who downplay growth are no friends of the poor.

Economic degrowth is terrible for almost everyone, but it endangers the poor most of all. Therefore, it is remarkable that the problems with degrowth are appreciated least by those who claim to be most focused on the interests of the lower classes. …Socialist political commentator Ian Kochinski, who goes by the pseudonym Vaush, has said that, “One of the unfortunate truths of being a socialist is you have to accept that your nation will not get to enjoy the skyrocket GDP growth that capitalist nations get to enjoy. There is going to be a sacrifice of some economic efficiency, to the benefit of hopefully making life better for everybody.” Some growth critics go even further than to question the importance of growth as a policy target. …Naomi Klein calls economic growth “reckless and dirty” and advocates a policy of “radical and immediate degrowth”.

Zimet explains how this agenda is bad news for those on the lower rungs of the economic ladder.

… those brought out of extreme poverty, which have mostly been in places like China and India, were largely not helped by massive social programs but by a growing global market for their labor. …George Mason University economist Tyler Cowen explains…that, “In the medium to long term, even small changes in growth rates have significant consequences for living standards. An economy that grows at one percent doubles its average income approximately every 70 years, whereas an economy that grows at three percent doubles its average income about every 23 years—which, over time, makes a big difference in people’s lives.”

Professor Glenn Hubbard, an economist at Columbia University, makes the case for growth in an article for National Review.

A slightly higher rate of economic growth, sustained over time, can make the difference between a big increase in living standards and relative stagnation. …Nobel Prize–winning economist Robert Lucas famously observed that once economists think of long-term growth, it is hard to think of anything else. A pro-growth policy agenda is a good idea because growth is a good idea. …Higher output can come from growth in inputs such as labor and capital, but what determines their growth? Today’s economists highlight population growth and society’s willingness to work, save, and invest. Still more important is growth in productivity, or the efficiency with which inputs are used to produce goods and services. …McCloskey, an economic historian, has similarly identified the continuous, large-scale, voluntary, and unfocused search for betterment as the source of new ideas that can produce economic growth. She sees this “innovism” as primarily a cultural force, preferring the term to the more familiar “capitalism,” and connects innovism to economic liberalism.

Prof. Hubbard notes that economic growth requires creative destruction, but also acknowledges that this process causes pain.

And that politicians often respond to pain with bad ideas.

Forces that propel growth invariably leave a wake of economic disruption for people in many places… A serious discussion of pro-growth policy must account for that disruption. …growth is messy. It can push some individuals, firms, and even industries off well-worn and comfortable paths. …A gentle industrial policy devised by social scientists who are worried about jobs is not the answer. It results in state tinkering for special interests…it risks a vicious cycle: A little bit of tinkering becomes a lot of tinkering.

Instead of industrial policy, Hubbard suggests a couple of policies, most notably a better system of community colleges.

That would be a good outcome, of course.

From a big-picture perspective, though, I think net job creation is the best way to mitigate the political downsides of creative destruction.

It is not good news if 15 million jobs are destroyed in a particular year (especially for the people and communities that are directly harmed).

But if more than 15 million jobs are created the same year, that surely makes it easier for people to find new opportunities.

Read Full Post »

Thomas Piketty is a big proponent of class-warfare tax policy because he views inequality as a horrible outcome.

But a soak-the-rich policy agenda, echoed by many other academics such as Emmanuel Saez and Gabriel Zucman, is fundamentally misguided. If people really care about helping the poor, they should focus instead on reforms that actually have a proven track record of reducing poverty.

The fact that they fixate on inequality makes me wonder about their motives.

And it also leads me to find their work largely irrelevant. I don’t care if they produce detailed long-run data on changes in inequality.

I prefer detailed long-run data on changes in poverty.

That being said, it appears that some of Piketty’s data is sloppy.

I shared some evidence about his bad numbers back in 2014. And, in a column for the Wall Street Journal, Phil Magness of the American Institute for Economic Research and Professor Vincent Geloso of George Mason University expose another glaring flaw

…the Piketty-Saez theory is less a matter of history than an accounting error caused by their misunderstanding of World War II-era tax statistics. …It’s true that income inequality declined in the early part of the 20th century, but the cause had more to do with the economic devastation of the Great Depression than the New Deal tax regime. …they failed to account properly for historical changes in how the Internal Revenue Service reported income-tax statistics. As a result, their numbers systematically overstate the levels of top income concentrations by as much as a third …Between 1943 and 1944 the tax collection agency shifted from tracking “net income” to “adjusted gross income,” or AGI…a truer depiction of annual earnings… Yet Messrs. Piketty and Saez didn’t bring pre-1944 IRS records into line with AGI accounting standards. Instead, they applied a fixed and arbitrary adjustment to all years before the AGI accounting change that conveniently scaled upward to the highest income brackets. …They used the wrong accounting definition for personal income and neglected to adjust their data for wartime distortions on tax reporting. When we corrected these problems, something stunning happened. The overall level of top income concentration flattened, and the timing of its leveling shifted away from the World War II-era tax rates that Messrs. Piketty and Saez place at the center of their story.

Here’s a chart that accompanied the column, showing how accurate data changes the story.

Since today’s column debunks sloppy class warfare, let’s travel back to 2014, when Deirdre McCloskey reviewed Pikittey’s tome for the Erasmus Journal of Philosophy and Economics.

She also thought his fixation on envy was misguided.

…in Piketty’s tale the rest of us fall only relatively behind the ravenous capitalists. The focus on relative wealth or income or consumption is one serious problem in the book. …What is worrying Piketty is that the rich might possibly get richer, even though the poor get richer too. His worry, in other words, is purely about difference, about the Gini coefficient, about a vague feeling of envy raised to a theoretical and ethical proposition. …Piketty and much of the left…miss the ethical point…of lifting up the poor…by the dramatic increase in the size of the pie, which has historically brought the poor to 90 or 95 percent of “enough”, as against the 10 or 5 percent attainable by redistribution without enlarging the pie. …the main event of the past two centuries was…the Great Enrichment of the average individual on the planet by a factor of 10 and in rich countries by a factor of 30 or more.

But she also explained that he doesn’t understand how the economy works.

The fundamental technical problem in the book…is that Piketty the economist does not understand supply responses. In keeping with his position as a man of the left, he has a vague and confused idea about how markets work, and especially about how supply responds to higher prices. …Piketty, it would seem, has not read with understanding the theory of supply and demand that he disparages, such as in Smith (one sneering remark on p. 9), Say (ditto, mentioned in a footnote with Smith as optimistic), Bastiat (no mention), Walras (no mention), Menger (no mention), Marshall (no mention), Mises (no mention), Hayek (one footnote citation on another matter), Friedman (pp. 548-549, but only on monetarism, not the price system). He is in short not qualified to sneer at self-regulated markets…, because he has no idea how they work.

And she concludes with a reminder that some of our left-wing friends seem most interested in punishing rich people rather than helping poor people.

The left clerisy such as…Paul Krugman or Thomas Piketty, who are quite sure that they themselves are taking the ethical high road against the wicked selfishness…might on such evidence be considered dubiously ethical. They are obsessed with first-act changes that cannot much help the poor, and often can be shown to damage them, and are obsessed with angry envy at the consumption of the uncharitable rich, of which they personally are often examples, and the ending of which would do very little to improve the position of the poor. They are very willing to stifle through taxing the rich the market-tested betterments which in the long run have gigantically helped the rest of us.

Amen. If you want to know what Deirdre means by “betterment,” click here and watch her video.

P.S. Click herehere, here, and here for my four-part series on poverty and inequality. Though what Deirdre wrote in 2016 may be even better.

P.P.S. I also can’t resist calling attention to the poll of economists at the end of this column.

Read Full Post »

There were many notable tweets in 2021.

I realize there are still more than 11 months left in 2022, but we may have a winner for this year’s best tweet.

The hack leftists at Oxfam have a new report with the laughable title of “Inequality Kills.” As part of the report, they grouse about “the recent 40-year period of neoliberalism” that supposedly helped only rich elitists.

Johan Norberg destroyed Oxfam’s sophomoric argument with a tweet showing that this era of free-market policy is associated with dramatic reductions in extreme poverty.

As Johan points out, if neoliberalism (in Europe, that’s the left’s term for people who support economic liberty) was a sinister plot by “rich, powerful, and corrupt elites,” their scheme failed.

They wound up enriching poor people instead!

In reality, of course, there was no secret plot.

What actually happened is that nations did shift toward free markets. And pro-market policies are the only effective way to reduce poverty.

Here’s a chart from the latest edition of Economic Freedom of the World. As you can see, economic freedom has increased over the past two decades, from an average score of 6.61 up to 7.04.

By the way, the above chart underestimates the policy improvement in poor nations.

That’s because the level of economic liberty has declined in the United States since 2000. It’s also declined in Western Europe. And it’s declined slightly in Japan.

So if we took the average score of developing nations, we would see an even bigger increase.

And that increase from 2000-2019 would be relatively small compared to the huge increase in the average Fraser Institute score the preceding two decades.

As you can see from this chart, we got a dramatic increase in economic liberty during the years of the Washington Consensus, with average scores increasing from 5.31 to 6.60.

So what’s the bottom line?

The developing world has enjoyed huge reductions in severe poverty thanks to improvements in economic freedom.

Which is exactly the opposite of the statist agenda being advocated by the kooks at Oxfam.

P.S. For those interested, Johan added a follow-up tweet to show that the reduction in global poverty was not just the result of what happened in China.

Since we shifted to China, I’ll augment Johan’s tweet by noting that China’s partial liberalization after Mao led to more inequality in addition to a giant reduction in poverty.

So even though poor people were big winners, Oxfam probably thinks this is bad news since rich people got richer faster than poor people got richer.

P.P.S. The cranks at Oxfam are not the only ones who are willing to hurt the poor so long as the rich get hurt even more.

Read Full Post »

I created the Eighth Theorem of Government to illustrate the difference between well-meaning people (who want to help the poor) and zero-sum people (who seem to think some people are poor because other people are rich).

This raises the interesting question of whether folks in the latter group are misguided or malicious?

For what it’s worth, I assume most people who fixate on inequality simply don’t understand the issue.

I like to think that they would change their minds if – for instance – they were shown Scott Winship’s devastating, slam-dunk response to Gabriel Zucman.

But there are others (like Zucman) who almost certainly know better, yet they push the inequality narrative for political or ideological reasons.

The bureaucrats at the Organization for Economic Cooperation and Development definitely also belong in the malicious category.

I first exposed the OECD’s disingenuous approach back in 2012, noting that the Paris-based bureaucrats used an utterly dishonest definition of poverty to make the laughably inaccurate claim that there was more poverty in the United States than in nations such as Greece, Hungary, Turkey, and Portugal.

Well, the OECD is still being dishonest. Here’s a look at the bureaucracy’s latest “poverty” measurement.

For those of us who actually pay attention to details, the data in the above chart have nothing to do with poverty.

Instead, the OECD is showing a particular way of measuring how income is distributed (in this case, the share of the population with less than half of the average income).

To see why it is profoundly absurd to measure poverty by looking at the distribution of income, consider these two examples.

  1. Haiti is a wretchedly poor nation, with per-capita yearly income of $1729. But since almost everyone (other than the political elite) in the country is equally destitute, Haiti would have almost no poverty according to the OECD’s perverse definition.
  2. Poor people in the United States have income equal to (or greater than) than middle class people in other developed nations, yet OECD bureaucrats want people to think poverty is a bigger problem in America than in a backward economy like Mexico’s.

I’ll close by pointing out the greatest absurdity of all.

If something miraculous happened and everyone in the United States somehow wound up with ten times as much income next year, guess what would happen to America’s poverty rate, as measured by the OECD? How much would it decrease?

Give yourself a gold star if you correctly answered that it would not change. At all.

What a crock of you-know-what.

P.S. The OECD is not the only guilty party when it comes to lying about poverty. Others who (willingly or unwittingly) misrepresent distribution data as poverty data include:

P.P.S. It’s also worth noting that poor nations aren’t poor because rich nations are rich.

Read Full Post »

I have a four-part series (here, herehere, and here) that explains why it’s much better to focus on fighting poverty rather than fretting about inequality.

I also think that our friends on the left who fixate on inequality are mostly motivated by an ideological desire for bigger government (or an ideological desire to hurt the rich).

Helping the less fortunate seems to be – at best – a secondary concern for them.

But let’s not worry about deciphering their real motives and instead look at why their approach is misguided.

Here’s a tweet from Gabriel Zucman, who (along with Thomas Piketty) is one of the most widely cited crusaders for class-warfare policy.

He is upset that the richest people in the world earn a lot more than the poorest people, and he obviously wants people to view these numbers as scandalous (and, with a reference to colonialism, maybe even subliminally racist).

If the economy was a fixed pie, maybe there would be something scandalous in Zucman’s data, but that’s not the case.

What we’re really seeing in these numbers is that some nations in the 1800s got much richer thanks to capitalism, and that meant their citizens enjoyed much higher levels of income.

But what about the rest of the world, you may ask?

This brings us to the counter-tweet of the year for 2021. Scott Winship of the American Enterprise Institute responded to Zucman and called attention to a statistic that deserves far more attention.

As far as I’m concerned, every decent and good person should celebrate the information in Swinship’s chart and view the information in Zucman’s chart as irrelevant.

Or, maybe those numbers are relevant, but only in that they tell us that some low-income countries still have lots of room to grow.

But I suspect Zucman would not be in favor of the good policies that would be needed to help poor nations converge with rich ones.

Read Full Post »

I’ve shared several videos (here, here, here, and here) that use rigorous data to show that grinding poverty and severe material deprivation was the norm for humanity – until capitalism gained a foothold a few hundred years ago.

Fortunately, as free enterprise has gradually spread around the world, there’s been a remarkable increase in living standards, leading to a stunning drop in poverty.

For today’s column, let’s look at some new academic evidence about the link between capitalism and poverty reduction.

Here the abstract of a new study by Colin Doran and Thomas Stratmann of George Mason University.

We study the relationship between economic freedom and poverty rates in 151 countries over a twentyyear period. Using the World Bank’s poverty headcounts of those living on less than $1.90 per day, $3.20 per day, and $5.50 per day, we find evidence that economic freedom, measured by the Heritage Foundation’s Index of Economic Freedom, is associated with lower poverty rates. We also test the effect of various components of the Index of Economic Freedom. We find that a government’s integrity and a country’s trade freedom are associated with lower poverty rates.

Keep in mind that this study is looking at the relationship between free markets and extreme poverty (not the relatively comfortable type of poverty that exists in the United States).

More specifically, the authors were investigating the impact of public policy on people who live on between about $700-$2000 per year. In other words, poor people in poor nations.

And the big takeaway is that capitalism leads to less poverty, but what really makes a difference is to have open trade and less corruption.

The good news is that we know how to get free trade. Just get rid of protectionist policies.

The bad news is that corruption in government is a much more challenging topic. Yes, shrinking government would mean less opportunity for graft, but that doesn’t solve the problem of delivering “public goods” in a competent and honest manner.

P.S. Foreign aid makes things worse rather than better.

P.P.S. Click here is you want to learn about poverty reduction in rich nations.

Read Full Post »

Writing last week about the new edition of Economic Freedom of the World, I largely focused on the jurisdictions that got high scores (Hong Kong, Singapore, and New Zealand) and countries that got low scores (Venezuela in last place, of course).

But I also included a chart showing that higher levels of economic liberty are correlated with higher levels of income.

That’s hardly a surprise for anyone who’s compared North Korea and South Korea. Or West Germany and East Germany.

But what about income mobility? Do free markets give low-income people an opportunity to climb the economic ladder?

Some new research from Vincent Geloso of George Mason University and James Dean of West Virginia University answers that question.

Here’s the abstract from their study.

Economic freedom is robustly associated with income growth, but does this association extend to the poorest in a society? In this paper, we employ Canada’s longitudinal cohorts of income mobility between 1982 and 2018 to answer this question. We find that economic freedom, as measured by the Fraser Institute’s Economic Freedom of North America (EFNA) index, is positively associated with multiple measures of income mobility for people in the lowest income deciles, including a) absolute income gain; b) the percentage of people with rising income; and c) average decile mobility. For the overall population, economic freedom has weaker effects.

And here’s the part of the study that I found most interesting.

We learn that labor market freedom is most important.

When focusing on the bottom decile’s average decile mobility (see table 5), we must note this variable only measures upward decile mobility, as those in the poorest decile cannot move down a decile and the upper decile can only move down or stay put. As a result, the effect of economic freedom is likely somewhat understated because of these mathematical boundaries. Nevertheless, we see that greater economic freedom increases the lowest decile’s upward decile mobility. In essence, higher amounts of economic freedom improve the relative gains of those at the bottom of the distribution, allowing them to move to higher deciles. Here, again, we see that the labor market freedom component is key for the nation’s poorest, such that an additional point of labor market freedom allows those beginning in the poorest decile to move up an additional 0.145 deciles… To put that number into perspective, using the differences in economic freedom between Quebec and Alberta (i.e. the lowest and highest economic freedom units in our data) is again useful. The greater labor market freedom of Alberta entails that the poorest Albertans have 0.44 extra deciles of mobility on average than the poorest Quebeckers.

Wonky readers may enjoy the aforementioned Table 5.

The bottom line is that free markets and limited government are the recipe to help poor people climb the economic ladder, not class warfare and redistribution (as I explained here, here, here, and here).

It’s much better to focus on how to make poor people rich rather than trying to make rich people poor.

Read Full Post »

Ten days ago, I shared some data and evidence illustrating how redistribution programs result in high implicit tax rates and thus discourage low-income people from climbing the economic ladder.

Simply stated, why work harder or work more when an additional dollar of income only leads to a net benefit of 10 cents or 20 cents? Or why work harder or work more when you can actually wind up being worse off?

Or why work at all if the governments provides enough goodies?

But don’t ask such questions if you’re in the same room as Helaine Olen of the Washington Post. She is very upset that some people think welfare payments discourage work.

It’s a dangerous myth, this idea that government help causes some people to just loaf off. It’s also untrue. Reminder: Before the pandemic, most working-age people receiving benefits like food stamps worked. They just didn’t earn enough money. …the temporary child tax credit signed into law this year by President Biden demonstrates the opposite. It is an extraordinary success. Almost 90 percent of families with children under age 18 are eligible to receive a monthly check from the federal government through the end of the year. …Many other developed nations offer almost all residents a child allowance of some sort.

If you read the entire column, you’ll notice that she provides very little evidence, particularly considering her very bold assertion that a negative link between redistribution and labor supply is “a dangerous myth.”

Yet we know from the experience of welfare reform in the 1990s that work requirements did boost labor supply.

And don’t forget about the very recent evidence that turbo-charged unemployment benefits encouraged more joblessness.

We also have evidence from overseas showing that there’s a negative relationship between handouts and idleness.

Including research from the Netherlands and the Nordic nations such as Denmark. And the same is true in Canada. And the United Kingdom.

Ms. Olen seems primarily motivated by her support for permanent per-child handouts, as President Biden has proposed.

And she wants us to believe that everyone will continue to work, even if they can get $3000-plus for each kid, along with all the other goodies that are provided by Uncle Sam (often topped up by state governments).

For what it’s worth, I think she admits her real agenda toward the end of her column.

…an argument can be made that the children of the irresponsible deserve more support from us, not less. Children can’t push their parents to get with the work-and-education program. As a result, you’re not “helping” children if you insist on financially punishing their parents for not making an “effort.” …human infrastructure matters too.

In other words, Ms. Olen seems to share Rep. Ocasio-Cortez’s view that money should be given to people “unwilling to work.”

Which is how some of our friends actually view the world. They think there is a right to other people’s money. Which is why they support big handouts, including so-called basic income.

The bottom line is that Biden’s per-child handouts and other expansions of the welfare state clearly would make work less attractive for some people.

Not all people, of course, because it takes time to erode societal capital.

But why would we want a society where a growing number of people think it’s okay to live off of others?

P.S. There is scholarly research that redistribution programs lure older people out of the workforce.

P.P.S. There is also scholarly research showing redistribution programs discourage households from building wealth.

Read Full Post »

Why do folks on the left support punitive policies such as high tax rates and a bigger burden of government?

Some of them are motivated by resentment against those who have achieved success. These are the people who support the hate-and-envy message of politicians such as Bernie Sanders and Elizabeth Warren.

Others folks on the left, by contrast, are motivated by sympathy for the less fortunate.

That’s a noble sentiment. Where they go wrong is in thinking that the economy is a fixed pie. This leads them to the mistaken conclusion that some people are poor because other people are rich.

Maybe I’m overly optimistic, but I think these people can be convinced to support good policy if they learn the facts about how free markets and limited government are a proven recipe for prosperity.

This is why I shared data earlier this year showing how per-capita economic output jumped dramatically once capitalism was allowed starting a couple of hundred years ago.

Today, let’s look at how poor people have been the biggest winners. Professor Max Roser of Oxford University recently shared a profoundly important tweet about the dramatic reduction in global poverty. We see not only that poverty rates have plummeted, but also that falling poverty rates are correlated with increases in per-capita GDP.

In other words, everyone is getting richer. There’s no fixed pie.

As you might expect, regions that are friendlier to capitalism have enjoyed bigger increases in prosperity and bigger reductions in poverty.

The bottom line is that people who care about the poor should be the biggest advocates of free enterprise.

P.S. It’s worth noting that, according to both U.S. data and global data, the big reduction in poverty occurred before welfare states were created.

Read Full Post »

Here are four things to understand about poverty and dependency.

Now let’s add a fifth item.

  • The United States adopted welfare reform in the mid-1990s.

Today’s column examines whether this was a bad development or good development.

We’ll start with a harsh critic.

In his column for the New York Times, Charles Blow wants Democrats to repeal Clinton’s welfare reform.

Clinton’s record, particularly with respect to Black and brown Americans and the poor, was marked by catastrophic miscalculation. …the welfare reform bill, …Clinton promised would “end welfare as we know it.” One of its central provisions was block-grant assistance to the states. …the Center for Budget and Policy Priorities pointed out in 2020, the block grant to states “has been set at $16.5 billion each year since 1996; as a result, its real value has fallen by almost 40 percent due to inflation.” …With the passage of the “American Rescue Plan,” the Democrats, alone, took another major step away from the mistakes of the Clinton legacy by increasing aid to families with children and to workers.

Reading the column, it seems like blacks must have suffered immensely because of the 40 percent reduction in the block grant.

But now let’s consider whether welfare reform was a good thing.

According to the data, the answer is yes. This chart, based on the Census Bureau’s data (specifically Table B-5), shows that the poverty rate for African Americans has declined since welfare reform was enacted.

To be sure, one could argue that the post-welfare reform decline was simply a continuation of a positive trend. But that doesn’t change the fact that there’s certainly no evidence that the 1996 legislation led to bad results.

Moreover, research from the Brookings Institution makes a persuasive case that welfare reform deserves credit for some of the post-1996 progress.

Why? Because it sent a message – both practically and rhetorically – that permanent dependence on Uncle Sam was a bad thing. As a result, more people entered the workforce and poverty dropped.

That seems like a result that should be celebrated.

Unfortunately, Biden’s so-called American Rescue Plan contains big per-child handouts that are not dependent on being in the workforce.

The only silver lining to that dark cloud is that the handouts are only for 2021.

But the pro-redistribution crowd already is clamoring to make that provision a permanent giveaway. To paraphrase Bill Clinton, they want to “restore welfare as we knew it.”

P.S. Based on what I’ve read in his columns, Charles Blow is a hard-core leftist on economic issues. But he’s semi-reasonable on gun rights, so that’s one point in his favor.

P.P.S. Welfare reform is just one example of the good policies that were enacted during the Clinton years.

P.P.P.S. We can learn lessons about welfare and dependency by looking at data from Europe and Canada.

Read Full Post »

My series on poverty and inequality (see here, here, and here) focuses on why we should try to help the poor rather than hurt the rich.

We’ll continue with that theme in Part IV, which begins with this video by Russ Roberts of Stanford University’s Hoover Institution.

Russ makes some great points throughout the video about the importance of creating the conditions for upward mobility.

Here are some of the main takeaways.

  1. The rich are getting richer and the poor are getting richer as well.
  2. Cronyism is bad, especially when it winds up subsidizing the rich.
  3. We should focus on reducing poverty rather than fixating on inequality.

Regarding that final point, my favorite part is when he said that, “Focusing on inequality as something inherently bad can blind us to the problems of poverty. Inequality and poverty aren’t the same thing.  …I’m much more concerned about those at the bottom who are left behind.”

In effect, he was stating his version of the Eighth Theorem of Government. At least the first half of it (he’s probably too nice to impugn the motives of those who focus on inequality).

I also like the fact that he points out the need to get rid of licensing.

And he repeatedly argues that we need to improve the quality of education, though I wish he had explicitly stated that this means we have to replace the government’s failed education monopoly with a choice-based system.

But no need to nit-pick. The video is great, as are his other videos that I have shared over the years (see here, here, here, and here).

P.S. For those who have trouble believing that the poor, middle class, and rich can all simultaneously enjoy rising incomes, click here, here, and here for evidence.

P.P.S. I also think this data from China is very powerful.

P.P.P.S. The people who fixate on inequality favor policies that would make the United States more like Europe, so it’s worth noting that lower-income people in America are usually better off than middle-class people on the other side of the Atlantic.

Read Full Post »

Back in 2014, I shared two videos, one narrated by Prof. Don Boudreaux and the other narrated by Prof. Deirdre McCloskey, making the point that grinding poverty and material deprivation were the norm for most of human history. It wasn’t until capitalism emerged a few hundred years ago that we made the jump from agricultural poverty to industrial prosperity.

I know at least one person who didn’t watch those videos.

Congresswoman Ayanna Pressley isn’t as well known as other members the “The Squad,” especially Alexandria Ocasio-Cortez and Ilhan Omar (jointly featured in this bit of satire), but she deserves some sort of recognition for being totally clueless about economics and history. Indeed, she may even deserve some sort of prize for uttering the year’s most economically illiterate sentence.

The two aforementioned videos illustrate why her statement is nonsensical, but let’s share some updated numbers to illustrate why she is profoundly wrong.

The Our World in Data site, maintained by Max Roser at Oxford University, is a great resource for researchers. If you go to the section on economic growth, you’ll find lots of information and many charts examining what has happened to living standards over long periods of time.

For instance, here’s a look at gross domestic product (GDP) over the past 2000 years. As you can see, per-capita economic output was very low (and very flat) until capitalism emerged in the 1700s and 1800s.

Thanks to capitalism’s emergence (along with the rule of law), we are vastly better off today than our ancestors.

Here’s another look at the data, but let’s focus on just the past 200 years. Yes, the 1800s was the era of the “industrial revolution” and so-called sweatshops, but that was a building block to our current prosperity.

To be fair to Congresswoman Pressley, it’s only the first part of her statement (“poverty is not naturally occurring”) that is grossly inaccurate and economically illiterate.

She then added that poverty “is a policy choice,” presumably because she wants people to believe that more redistribution can make it go away. That part of her statement also is wrong, according to both U.S. data and global data, but not quite as ludicrously erroneous.

Read Full Post »

My late friend Walter Williams was a first-rate economist, an important public intellectual, and a truly great American. He also was an amazing communicator, with an unparalleled ability to make important points in a succinct and easy-to-understand manner.

My favorite Walter quote is about how capitalism enabled positive-sum wealth creation.

Today, though, I want to share Walter’s quote about the simple rules for life that basically eliminate poverty.

Sadly, the current welfare state undermines those rules and instead lures many people into self-destructive behaviors. Choices that are bad for them and bad for society.

  • Have kids out of wedlock? No problem, Uncle Sam will take care of you with a plethora of handouts.
  • Watch TV on the sofa all day rather than work? No problem, Washington will provide you with benefits.

As an economist, I’m especially concerned that redistribution programs discourage employment. That’s bad for the economy. Even more important, it’s very bad for people who get trapped in lives of dependency.

Oh, and let’s not forget that the welfare state also is a big burden on taxpayers.

The reason for highlighting these problems is that Senator Mitt Romney has unveiled a plan (the “Family Security Act”) to have the federal government provide universal child allowances.

The good news is that his plan will mitigate some of the problems with the current system. The bad news is that his proposal will exacerbate other problems.

Here are some excerpts from the Senator’s summary of the proposal.

The Family Security Act would provide a monthly cash benefit for families, amounting to $350 a month for each young child, and $250 a month for each school-aged child. …Promoting marriage; Providing equal treatment for both working and stay-at-home parents; and Reforming and consolidating outmoded federal programs, including by fully paying for the new proposal….a new national commitment to American families by modernizing and streamlining antiquated federal policies into a monthly cash benefit. …The bill consolidates overlapping and often duplicative federal policies into direct support for families. …deficit-neutral.

That description sounds nice, and the proposal would be beneficial in some ways.

Most notably, there would not be high implicit marginal tax rates on work (a big problem in the current system) since people would get the child allowances regardless of employment status.

But there are some serious drawbacks to the plan. Here are four things that cause concern.

First, it increases the burden of government.

Senator Romney (as well as proponents of the plan such as the Niskanen Center) highlight the fact that the plan is “deficit neutral.” But that doesn’t tell us whether the plan increases or reduces the size and scope of the federal government.

Unfortunately, if you take a close look at the Senator’s summary, it’s clear the proposal would be a net increase in the burden of spending.

Here’s the relevant table, which ostensibly shows Romney’s new spending along with the “spending offsets” that make the plan deficit neutral.

For what it’s worth, I’m disappointed that the Senator (his staff?) chose to be dishonest. Three of the “spending offsets” are actually measures that would increase tax revenue (circled in red).

And when you fix that dodgy bit of accounting, Romney’s plan would add more than $45 billion per year to America’s fiscal burden.

Second, why would anyone think it’s a good idea to copy Europe?

According to an article from HuffPost, “The U.S. is one of the only developed countries that doesn’t pay parents a child benefit or child allowance. Romney’s proposal shows there is bipartisan support for the policy.”

This is an accurate observation, but it’s hardly persuasive. Yes, European nations generally send people money simply because they have children.

But why on earth would we want to copy nations where living standards are far below American levels? Heck, poor people in America tend to be more prosperous than middle-class people in Europe.

By the way, some like Romney’s plan because they think it will boost marriage rates and fertility rates (i.e., lure people into having more children). Seems like that might be theoretically true, but the data show that European birth rates are very low, significantly below American levels.

In other words, don’t hold your breath waiting for more marriages and more children.

Third, it undermines federalism by giving Washington a bigger role rather than smaller role.

I’ve argued that the so-called War on Poverty has been very bad news. We have a Byzantine system of handouts that require an army of bureaucrats to administer dozens of handouts that subsidize bad behavior.

It’s created dependency and the data show it actually has had a negative impact on the trend of poverty reduction and self sufficiency (same thing has happened in other nations as well).

The right approach is to get Washington out of the business of income redistribution. We’re far more likely to get good outcomes if we let states decide (and learn from each other on) how best to reduce poverty.

Fourth, it is akin to a “basic income” that may have a very corrosive impact on societal capital.

I was very opposed to Andrew Yang’s plan to provide universal handouts, in large part because I feared it would undermine personal independence, the work ethic, the spirit of self reliance, and other traits that are critical for a successful society. And I also didn’t trust (for good reason) Yang’s claim that his scheme would replace other redistribution programs.

Well, Romney’s proposal is like a starter version of a basic income, but with the handouts based on the number of children.

I fear this will enable some people to decide they can drop out of the labor force.

Scott Winship of the American Enterprise Institute shares my concerns.

The Romney proposal would take us back to the bad old days in key ways, and policymakers are playing Russian roulette with low-income families’ wellbeing. …some people (including future people) who would choose single parenthood or non-work except that the current safety net makes it unaffordable would be able to afford these choices under child allowances. For them, child allowances are allowances for behavior that would be expected to hurt their own long-term prospects and, more importantly, the wellbeing of their children.

I’ll conclude by observing that Romney’s plan is nowhere near as bad as Congresswoman Ocasio-Cortez’s scheme for universal handouts.

But that’s hardly the test for good legislation. For those who prefer smaller government, less dependency, and less centralization, Romney’s plan is bad news.

Read Full Post »

My recent three-part series (here, here, and here) explained why policy makers should seek to reduce poverty rather than inequality.

I want to expand on that point today by showing why growing the pie is more important than how it is sliced.

I’ve previously opined on why economic growth is important, showing that the United States today would be almost as poor as Mexico if our rate of economic growth since 1895 was just one-percentage point less than it actually was.

Moreover, I also showed in that 2017 column how much smaller increments of additional growth over time can mean thousands of dollars of additional income for an average household.

And, the previous year, I shared two excellent videos from Marginal Revolution University while writing about Hong Kong’s remarkable jump from poverty to prosperity.

For today’s column, I want to expand on this point using the economic growth page from Max Roser’s great site, Our World in Data. We’ll start with this chart showing how per-capita economic output dramatically increased a few hundred years ago.

This kind of data won’t be news to regular readers. I’ve already shared great videos from Deirdre McCloskey and Don Boudreaux that make the same point about the explosion of prosperity in the modern era.

And if anyone somehow thinks this growth doesn’t matter, Roser’s page shows that there are countless ways of graphing the relationship between economic output and good outcomes, such as how long we live, child mortality, access to electricity, hunger, and literacy.

The bottom line is that we are unimaginably rich compared to prior generations, largely thanks to the rule of law, expanded trade, and limited government.

That recipe for growth and prosperity works anywhere and everywhere it is tried. Here’s another chart showing how other parts of the world are being to prosper thanks to economic liberalization.

I want to cite two additional charts from Roser’s page.

First, here’s a chart showing productivity rates in selected nations. Why is this important? Because economic prosperity is basically driven by how much we work and how productive we are.

There are all sorts of interesting things embedded in the above chart.

Our final chart shows the importance of convergence.

Once again, there are some important observations embedded in the above chart.

  • Very poor nations such as Botwsana and China can enjoy meaningful gains with partial economic liberalization.
  • Western nations can enjoy more prosperity over time, but they won’t catch the United States so long as they are burdened with too much government.
  • Singapore shows that full convergence is not only possible, but also that laissez-faire countries can even surpass the United States.

P.S. I can’t resist recycling my “never-answered question” in hopes of getting any of my left-leaning friends to cite a single example of their policies producing mass prosperity.

Read Full Post »

Ethical people, regardless of ideology, should be motivated by an empathetic desire to help the poor rather than a spiteful thirst to punish the rich.

That was the message in Part I and Part II of this series. That’s also today’s message, and we’ll start with this video.

There’s a lot of information in this video, broken down into five thematic points.

  1. Profit (earned through voluntary exchange) is good, while plunder (obtained through government coercion) is bad.
  2. Because people are different, it is important to distinguish between equality of opportunity and equality of outcomes.
  3. People don’t understand inequality, and that leads many of them to overlook the important problem of poverty.
  4. We are getting richer over time, meaning that the middle class is only disappearing because some are becoming rich.
  5. Thanks to the spread of pro-market policies, the entire world is becoming more prosperous with better life outcomes.

For today’s column, let’s focus on item #3 and I want to specifically take this opportunity to explain why we should be aware of how a type of data known as the “Gini coefficient” is used (and sometimes misused).

By way of background, the Gini coefficient measures the distribution of income in a society. As seen in this illustration from Wikipedia, a high coefficient means some people have a lot more income than others and a low coefficient means most people have similar levels of income.

I’ve never been a big fan of the Gini coefficient for three reasons.

First, it’s often used by folks on the left who want higher taxes and more redistribution. Though that’s actually an indictment of how the coefficient is misused.

Second, it doesn’t tell us whether inequality is the result of something good (some people getting rich by providing especially valuable goods and services) or the result of something bad (some people grabbing undeserved loot thanks because of bailouts, subsidies, protectionism, industrial policy, and cronyism).

Third, it does not tell us whether a society is poor or prosperous.

Regarding that final point, Professor Davies pointed out in the video that the most equal nations in the world are Sweden and Afghanistan.

But having similar Gini coefficients is utterly meaningless because it turns out that the similar scores are for radically different reasons – i.e., people in Afghanistan are equally impoverished and people in Sweden are equally prosperous.

And I can’t resist pointing out that Sweden’s superior results are surely correlated with the fact that Swedes enjoy far higher levels of economic liberty (Sweden is #22 and Afghanistan is #136 according to the Heritage Foundation’s Index of Economic Freedom).

You could also do a comparison between nations with very different Gini coefficients.

The United States, for instance, is much more “unequal” than Afghanistan. But I can’t imagine anyone in America wanting to trade places. After all, almost everyone in the U.S. is far richer than almost everyone in Afghanistan.

Or, if you prefer comparing developed nations, I’ve previously noted that poor people in the United States have the same amount of income as middle-class people in nations with lower levels of inequality.

I’ll close with one final bit of data that shows why Gini coefficients should be viewed with caution. Here’s another visual from the Wikipedia page, this one showing how world inequality increased substantially between 1820 and 2002.

Was that increase in inequality a bad outcome?

Of course not. It was simply a result of the Western world becoming rich because of limited government and the rule of law.

And now that developing nations are finally shifting to market-oriented policies, their incomes also are increasing (which, as a side effect, means global inequality is decreasing).

In other words, we should pay attention to the recipe for growth and prosperity, not the Gini coefficient.

P.S. While I’m not a fan of the Gini coefficient, the so-called trade deficit will always be my least favorite statistic.

Read Full Post »

I began yesterday’s column with a short clip of me explaining why we should focus on reducing poverty, not reducing inequality.

Here’s a more thorough discussion of the same topic.

The video makes three central points, all of which are very sound.

  1. The economy is not a fixed pie, the rest of us don’t become poor when someone else becomes rich.
  2. In a free society, there will be unequal outcomes because we have all make different choices in life.
  3. Fixating on the irrelevant issue of inequality distracts from addressing the real problem of poverty.

I want to focus on #3 because it’s very distressing that some folks on the left are more interested in hurting the rich rather than helping the poor.

Indeed, some of them are so motivated by spite that they even advocate for policies that will hurt poor people so long as rich people are hurt even more.

I normally try to avoid sounding judgemental, but that’s morally reprehensible.

The decent thing to do is figure out the policies that will help people climb the economic ladder.

With that in mind, here are some highlights from a recent FEE column by Gonzalo Schwarz. He begins with the common-sense observation that it’s best to focus on upward mobility.

…economic mobility, poverty, and income inequality…are not the same, and the policy responses to address them vary. …the income inequality narrative has come to dominate our current public policy discourse, especially in the United States. …The rich are getting richer, but the poor are getting richer too… Policies that aim to remove the barriers faced by people looking to climb the income ladder should be rigorously discussed and pursued.

He then points out that policies to reduce inequality often backfire.

Schwarz cites the minimum wage as an obvious example since it is a recipe for joblessness when politicians mandate pay levels that exceed the value of many low-skill workers.

But my interest in public finance leads me to share this excerpt.

Policy solutions aimed at reducing income inequality will not necessarily positively impact those looking to escape poverty… Quite often, these goals can come into conflict. …A…popular public policy “solution” to address income inequality is to raise the corporate income tax (CIT) and use the proceeds to fund government programs… A recent Harvard Business School working paper…find that a reduction in state corporate income taxes increases real investment, a key driver of economic growth. This is consistent with data from the Organisation for Economic Cooperation and Development (OECD), which published a wide-ranging 2008 paper that found that taxes on income tend to hamper economic growth significantly more than other tax instruments.

Schwarz’s conclusion is spot on.

Pursuing an agenda focused on boosting upward social mobility is more conducive to the discovery of the barriers in the way of human flourishing and wealth creation. Breaking down these barriers, both artificial and natural, is the best way to ensure that each and every person has the opportunity to achieve their American Dream. Certainly, we don’t need more income inequality to achieve broader prosperity but chasing the inequality red herring puts that goal at risk.

I’ll add my two cents to this discussion by noting that President John F. Kennedy was right to observe that a rising tide lifts all boats.

Data from the Census Bureau shows that all income groups tend to rise and fall together.

In other words, if you’re hurting the rich, you’re probably hurting the poor as well. And vice-versa.

And if you’re enacting policies that help the rich, then incomes for everyone else are probably rising as well.

P.S. Regular readers already know this, but I’ll make the should-be obvious point for any new readers that there are some types of government policy (bailouts, subsidies, protectionism, industrial policy, cronyism, etc) that produce unjust forms of inequality.

In other words, it’s good when people become rich by providing the rest of us with goods and services we value, but it’s not good for them to get rich by climbing into bed with politicians.

Read Full Post »

I have a couple of cameos in a new left-leaning documentary film, Race to the Bottom. I shared a clip two day ago with my views on corporate tax and the Laffer Curve.

Today, here’s what I said about the left’s mistaken views on inequality.

The fundamental problem is that I think some of our friends on the left are primarily motivated by disdain for the rich.

Indeed, their envy and resentment is so strong that they’re happy to support policies that hurt the poor, so long as the rich suffer a disproportionate amount of harm.

Consider this sarcastic visual.

I hope this visual greatly exaggerates the problem, but I’ve previously shared substantive research suggesting that the folks on the left are fixated on punishing success.

That agenda does not produce good results.

In a thorough article for Reason, David Henderson of the Hoover Institution explores the issues of poverty and inequality.

Most of what is framed as a problem of inequality is better conceived as either a problem of poverty or a problem of unjustly acquired wealth. …It’s important to distinguish the concepts of inequality and poverty. …Many people who worry about income inequality want to tax higher-income people more. Given what economists know about the harmful effects from raising already high marginal tax rates even higher, tax increases could certainly reduce measured inequality—because they would cause higher-income people to reduce their taxable income by working less, by taking more pay in the form of untaxed fringe benefits, or by investing more in municipal bonds, whose interest is not taxable by the feds. Of course, none of this would make lower-income people better off. Indeed, to the extent that higher taxes discourage capital accumulation, they slow the growth of worker productivity. One of the main ways to increase worker productivity is to increase the amount of capital per worker. With a slower growth rate of capital, worker productivity will grow more slowly—and so will real wages. This makes lower-income people worse off than they would have been.

Henderson uses Lydon Johnson as an example of how some people use government favoritism to line their pockets.

But he wisely notes that any inequality that arises from “unjustly acquired wealth” is a symptom of the real problem of cronyism.

Great wealth, meanwhile, is a problem only to the extent that it is unjustly extracted. Government favoritism to politically powerful people may increase income and wealth inequality, as it did in the case of Lyndon Johnson and his wife. But it is the government favoritism, not inequality per se, that is the true problem.

As a quick aside, Lyndon Johnson almost certainly ranks as one of America’s worst presidents (along with failures such as Hoover, Roosevelt, Nixon, and Wilson).

And, having read Henderson’s article, I now have an additional reason to despise LBJ.

I’ll close by recycling my Eighth Theorem of Government, which is simply another way of expressing my oft-made point that we should try to improve life for the poor rather than worsen life for the rich.

Indeed, I sometimes think this theorem is a good way of discerning who is a good person and who is a bad person.

Regarding the latter, we should recognize that some people are simply misguided. These are the folks who actually think that there’s a fixed amount of income and wealth, so they mistakenly believe that if someone like Bill Gates gets rich, the rest of us somehow lose.

Smart folks on the left know that’s not true, so I give them credit for that, but I also think they are reprehensible for being motivated by a desire to hurt the rich, even when that means the rest of us suffer as well.

The bottom line is that market-driven growth is good for everyone, especially the poor.

P.S. The most accurate political analysis of inequality came from Margaret Thatcher.

P.P.S. Here’s the world’s best-ever tweet about inequality.

P.P.P.S. For more wonky readers, I suggest this data and this data about China and this data about the world.

Read Full Post »

Regular readers know that I give Trump mixed grades on economic policy.

He gets good marks on issues such as taxes and regulation, but bad marks in other areas, most notably spending and trade.

Which is why I’ve sometimes asserted that there has been only a small improvement in the economy’s performance under Trump compared to Obama.

But I may have to revisit that viewpoint. The Census Bureau released its annual report yesterday on Income and Poverty in the United States. The numbers for 2019 were spectacularly good, with the White House taking a big victory lap.

Here are the three charts that merit special attention.

First, we have the numbers on inflation-adjusted median household income. You can see big jumps for all demographic groups.

Next, here’s a look at whether Americans are getting richer or poorer over time.

As you can from this chart, an ever-larger share are earning high incomes (a point I made last month, but this new data is even better).

Last but not least, here’s the data on the poverty rate.

Once again, remarkably good numbers, with all demographic groups enjoying big improvements.

We’ll see some bad news, of course, when the 2020 data is released at this point next year. But that’s the result of coronavirus.

So let’s focus on whether Trump deserves credit for 2019, especially since I got several emails yesterday from Trump supporters asking whether I’m willing to reassess my views on his policies.

At the risk of sounding petulant, my answer is no. I don’t care how good the data looks in any particular year. Excessive government spending is never a good idea, and it’s also never a good idea to throw sand in the gears of global trade.

But perhaps we should rethink whether the positive effects of some policies are stronger and more immediate while the negative effects of other policies are weaker and more gradual.

I’ll close with two cautionary notes about “sugar high” economics.

For what it’s worth, we’re not going to resolve this debate because coronavirus has been a huge, exogenous economic shock.

Though if (or when) the United States ever gets to a tipping point of too much debt, there may be some retroactive regret that Trump (along with Obama and Bush) viewed the federal budget as a party fund.

Read Full Post »

Older Posts »