Feeds:
Posts
Comments

Posts Tagged ‘Demographics’

Many nations face a slow-motion fiscal crisis because of demographics.

To be more specific, politicians last century created welfare states and social-insurance systems that take money from workers in order to provide pensions and health care to old people.

Those decisions were misguided (compared to market-based approaches), but the math sort of worked. After all, everyone assumed there would be population growth, meaning there would always be enough future workers to support future retirees.

But the world has changed. Dramatically.

Let’s look at some data from a column in the New York Times by Dean Spears, who teaches at the University of Texas.

We’ll start with this chart showing that the world’s population will peak in 2085 and then dramatically decline.

Why will the world’s population shrink?

Because birthrates have plummeted. Many nations already have reached “below-replacement fertility” and others will reach that level in the near future.

There’s nothing wrong with lower levels of fertility, of course. Families should be as big or small as people want them to be.

But lower levels of fertility have a profound impact on social-insurance systems, as explained in Part I and Part II.

Let’s go to the Population Pyramid website and examine two countries.

We’ll start with the United States, since nearly 80 percent of my readers are American. As you can see, the USA had a population pyramid back in 1964, meaning plenty of working-age people and not that many old people to subsidize.

But that ratio is dramatically different in 2023 and it will change even more by 2050. With very grim fiscal consequences.

Let’s also take a look at Italy, since it is often viewed as a nation facing big demographic challenges.

The most shocking takeaway is that the population pyramid from 1964 is morphing into an upside-down pyramid.

So what can politicians do in response? There are three options.

  1. They can try to cajole or bribe people to have more kids (i.e., more future taxpayers), but those policies don’t seem to be very effective – even in place such as Hungary.
  2. They can impose massive tax increases on lower-income and middle-class households, which is the approach that is implicitly embraced by Trump and Biden.
  3. They can shift to retirement systems based on private savings, like AustraliaChileSwitzerlandHong KongNetherlands, the Faroe IslandsDenmarkIsrael, and Sweden.

The right answer should be obvious, though some politicians want to make the crisis worse.

Read Full Post »

The burden of federal spending today is too high, diverting resources from the productive sector of the economy and sapping America’s economic vitality.

Unfortunately, today’s bad news about excessive government spending will become tomorrow’s terrible news.

The problem is entitlement programs.

When politicians created programs such as Medicare, Medicaid, and Social Security, they did not understand (or did not care) about what might happen if people started living longer and/or having fewer children.

These demographic changes are profoundly important because they translate into an ever-growing burden of government spending. Simply stated, the United States is becoming a society with more and more people expecting benefits from the government and fewer and fewer taxpayers to pay for those goodies.

The Center for Freedom and Prosperity has just released a three short studies to explain this problem. Authored by Robert O’Quinn, who has held senior positions in both the executive and legislative branches, this three-part series will make you better informed than most so-called budget experts in Washington.

Part I of the three-part series is a primer on the federal budget. It explains all sorts of wonky topics such as the differences between “mandatory spending” and “appropriations.” Readers will learn about the importance of “budget reconciliation” and “federal debt held by the public.” This paper does not look at policy choices, but readers will learn about the process of making fiscal policy (something I explained with far less detail back in 2018).

Part II of the three-part series a primer on federal spending, revenue, and red ink. Readers will learn how federal spending and revenue have changed over time (hint: both have increased, but spending has grown at the fastest rate). The paper explains the economic impact of spending, taxes, and deficits. For those who don’t have time to read the study, here’s the most important thing to understand.

Federal outlays are growing significantly faster than the U.S. economy, while federal receipts are growing slightly faster than the U.S. economy. Consequently, federal budget deficits and federal debt held by the public are widening as a percent of GDP. …the key problem is the growing burden of spending. Replacing debt-financed spending with tax-financed spending would leave the nation’s fiscal burden unchanged. Or it might make a bad situation even worse if politicians increase spending because of an expectation of additional revenue.

Part III of the three-part series is a primer on entitlement programs. It explains that entitlements are responsible for America’s growing burden of government spending. Readers will learn about the fiscal consequences of Medicare, Medicaid, and Social Security. Everyone should read this report, but for those of you with limited time, this chart is the most important thing to understand. You can see the burden of different spending categories in 2000, 2023, and 2054, and the problem areas are quite obvious.

All three studies are primarily designed to inform readers about basic facts so they have a real-world understanding of America’s deteriorating fiscal outlook.

I’ll conclude this column, though, by making a very important point about public policy. Simply stated, the United States will not be able to issue endless amounts of government debt.

As a result, this means that the nation will have to close the huge long-run gap between spending and revenue by making an unavoidable choice between massive tax increases and genuine entitlement reform.

Because of their opposition to entitlement reform, politicians such as Joe Biden and Donald Trump prefer giant tax increases. And because there are not enough rich people to finance big government, the Biden-Trump tax increases will target lower-income and middle-class households.

Read Full Post »

In my recent interview with John Stossel, I explained that America’s entitlement programs are unsustainable because of demographic change.

Our population pyramid is turning into a population cylinder, so there will not be enough working-age taxpayers in the future to finance all the benefits promised to the elderly. Not even close.

This inevitably and unavoidably means one or more of the following options.

Given those choices, entitlement reform is the only sensible path. Both for the United States and for other nations.

Some readers may think I’m exaggerating in order to push a libertarian agenda. So let’s look at some analysis from non-libertarian sources.

We’ll start with some excerpts from a recent report by the St Louse Federal Reserve Bank. Authored by Amy Smaldone and Mark L.J. Wright, it warns that the collapse in fertility is going to be a major problem for tax-and-transfer welfare states.

…the era of rapid population growth is coming to an end. …the world’s population will peak at around 10.5 billion people later this century before beginning to decline. …China’s population is expected to rapidly decline, ending the century around 800 million. Europe’s population has plateaued at approximately three-quarters of a billion people and will decline below 600 million by the end of the century, while the U.S. population is expected to level off at around 400 million. …The slowdown in population growth is due to a collapse in childbirth around the world. …the total fertility rate (TFR)—which represents the expected number of births over a woman’s life…for the world as a whole has fallen from about 5 in 1950 to around 2.3 today. Current TFRs are well below the “replacement rate” (or level needed to keep the population constant) of 2.1 in European countries (where they average 1.5), as well as in China (1.2), South Korea (0.9) and Japan (1.3)… Declining fertility and increased lifespans have resulted in a rapidly aging population. The figure below plots the median age of the population—the age at which half of the people are younger and half are older—around the world. As recently as 1973, half of the world’s inhabitants were under age 21. By the end of the 21st century, more than half will be middle-aged or elderly (40 or older). …the world as a whole will need to contend with a declining share of young workers. It is likely that pension and health care benefits will come under pressure with a shrinking tax base to pay for them.

I’ll add an editorial comment. It’s not “likely” that pension and health care benefits will come under pressure. That’s a given.

To understand why it’s a given, here’s a chart from the report.

As you can see, the average age is going to dramatically increase in all parts of the world.

The U.K.-based Economist also wrote about this topic in its latest issue. It also concludes that changing demographics could lead to fiscal crises.

Across much of the world the fertility rate, the average number of births per woman, is collapsing. Although the trend may be familiar, its extent and its consequences are not. …The largest 15 countries by GDP all have a fertility rate below the replacement rate. That includes America and much of the rich world, but also China and India… a shrinking population creates problems. …The obvious one is that it is getting harder to support the world’s pensioners. …whereas the rich world currently has around three people between 20 and 64 years old for everyone over 65, by 2050 it will have less than two. The implications are higher taxes, later retirements, …and, possibly, government budget crises.

Once again, I’ll add an editorial comment. It’s not that budget crises will “possibly” happen. They will happen.

However, I’ll conclude with a bit of optimism for the United States.

Greece’s fiscal crisis (starting in 2009) was a teachable moment. Republicans actually realized it was a warning sign and took a more-serious approach to the entitlement issue, supporting budgets with genuine Medicaid reform and Medicare reform.

Unfortunately, that reformist energy was blunted by Obama and it then largely evaporated under Trump.

But something similar may happen again. Other nations (probably led by Italy) are going to suffer a fiscal crisis in the not-too-distant future. And when that happens, I hope it will be another learning experience for American lawmakers.

Maybe, just maybe, they’ll then decide to do what’s best for the country.

P.S. For more information about the demographic change and entitlement crisis, click here and here.

Read Full Post »

I discussed Italy’s looming fiscal crisis on Monday and then argued against a potential bailout on Tuesday.

Today, let’s focus on the rest of Europe.

I gave a presentation yesterday in Brussels about “Public Finances in the Eurozone” and used the opportunity to explain that governments are too big in Europe and to warn that demographic changes were going to lead to an even-bigger burden of government in the future.

My assessment is very mainstream, at least with regards to what will happen to national budgets in European nations.

A study from the Organization for Economic Cooperation and Development, authored by Yvan Guillemette and David Turner, examines the long-run fiscal position of member nations.

It warns that government debt levels will increase dramatically if they don’t change current policies.

… secular trends such as population ageing and the rising relative price of services will keep adding pressure on government budgets. Without policy changes, maintaining current public service standards and benefits while keeping public debt ratios stable at current levels would increase fiscal pressure in the median OECD country by nearly 8 percentage points of GDP between 2021 and 2060, and much more in some countries. …governments will need to re-assess long-run fiscal sustainability in the context of higher initial government debt levels…when considering expenditure pressures associated with ageing…, the OECD structural primary balance would deteriorate rapidly and net government debt would more than double as a share of GDP by 2050 (Figure 12).

Here is the aforementioned Figure 12. As you can see, both deficits (left chart) and debt (right chart) are driven by the cost of age-related entitlement programs.

The report also explains that the increase in red ink is being caused by a bigger burden of government spending.

Under a ‘business-as-usual’ hypothesis, in which no major reforms to government programmes are undertaken, public expenditure is projected to rise substantially in most countries… Public health and long-term care expenditure is projected to increase by 2.2 percentage points of GDP in the median country between 2021 and 2060… Public pension expenditure is projected to increase by 2.8 percentage points of GDP in the median country between 2021 and 2060… Other primary expenditures are projected to rise by 1½ percentage points of GDP in the median country between 2021 and 2060 (Figure 13, Panel A). This projection excludes potential new sources of expenditure pressure, such as climate change adaptation.

Here’s Figure 13, mentioned above. Notice the projected increases in spending in most European nations.

So what’s the best response to this slow-motion fiscal disaster?

Since more government spending is the problem, you might think the OECD would recommend ways to restrain budgetary expansion.

But that would be a mistake. As is so often the case, OECD bureaucrats think giving politicians more money is the best approach.

The present study…uses an indicator of long-run fiscal pressure that is premised on the idea that governments would seek to stabilise public debt ratios at projected 2022 levels by adjusting structural primary revenue from 2023 onward. … all OECD governments would need to raise taxes in this scenario to prevent gross government debt ratios from rising over time… The median country would need to increase structural primary revenue by nearly 8 percentage points of GDP between 2021 and 2060, but the effort would exceed 10 percentage points in 11 countries.

To be fair, the authors acknowledge that there might be some complications.

Raising taxes…appears feasible in some countries…, in other countries it may present a substantial challenge. In Belgium, Denmark, Finland and France, for instance, structural primary revenue is already around 50% of GDP… Pushing mainstream taxes on incomes or consumption further up, even by only a few percentage points of GDP, may be politically difficult and fiscally counter-productive if it means reaching the downward-sloping segment of the Laffer curve… Lundberg…identifies five OECD countries where top effective marginal tax rates (accounting for income, payroll and consumption taxes) are already beyond revenue-maximizing levels (Austria, Belgium, Denmark, Finland and Sweden). Thus, if taxes are to rise, it might be necessary to look to other bases, such as housing, capital gains, inheritance or wealth. Recent international efforts to establish a minimum global corporate tax could also enable more revenue to be raised from corporate taxes.

I’m happy that the study acknowledges the Laffer Curve, though that is not much of a concession since even Paul Krugman agrees that it exists.

And even when OECD bureaucrats admit that it may be unwise to increase some taxes, their response is to suggest that other taxes can be increased.

Sigh.

Now you understand why I’ve argued that the OECD may be the world’s worst international bureaucracy. Especially since OECD bureaucrats get tax-free salaries while urging higher taxes on the rest of us.

Read Full Post »

Last month, I shared a chart from a study published by the European Central Bank.

It showed which European nations were in the unfortunate position of facing big future spending increases (the vertical axis) combined with already-high levels of government debt (the horizontal axis).

The bottom line is that Italy, Portugal, France and Belgium face a very difficult fiscal future.

And Estonia (at least relatively speaking) is in the best shape.

Today we are going to augment those ECB numbers by looking at some data from the OECD’s recent report on Estonia.

Here’s a chart showing how the burden of government spending is going to increase in various nations between now and 2060.

Slovakia, Spain, Norway, and the Czech Republic have the biggest problem.

Lithuania is in the best shape, surprisingly followed by Greece (I assume because that nation already hit rock bottom, not because of good policy).

I also highlight the United States, which will have to face the challenge of above-average spending increases.

But if you want to know which nation will be the next to suffer fiscal collapse, you also need to know whether (or the degree to which) it has the capacity – or “fiscal space” – to endure a bigger burden of government spending.

James Capretta addressed that topic in an article for the Bulwark.

Which governments have exercised budgetary restraint in recent years, even while confronting sequential global crises? Which have been more profligate? And what do the differences portend for their differing abilities to handle an era when servicing debt may be more expensive than it has been in many years? …Accuracy…requires assessing both assets and liabilities. …The Organization for Economic Cooperation and Development…’s most comprehensive measure of fiscal resilience is the “financial net worth” of the reporting countries, which includes the main sources of accumulated liabilities (especially public debt) along with financial assets owned by governments.

And here’s a chart showing how developed nations (with the exception of oil-rich Norway) have been spending themselves into a fiscal ditch.

Here are some of Capretta’s observations.

Among the twenty-seven OECD countries that reported data every year from 1995 to 2020, the average deterioration in their net financial position, weighted by population size, was equal to 48 percent of GDP. …Several countries stand out for the steepness of their declines. Japan’s net financial position was -20 percent of GDP in 1995, and in 2020 it was -129 percent of GDP—in other words, in just 25 years it worsened by over 100 percent of the country’s annual GDP. Similarly, the United Kingdom experienced a serious deterioration, with a net financial position in 2020 equal to -109 percent of GDP. In 1995, it was -26 percent. …France, Greece, Italy, and Spain are regularly criticized for their uneven approaches to fiscal discipline. The OECD data showing a substantial deterioration of their net financial positions over the last quarter century provides more evidence that each of these countries needs to take further steps to lower the risk of a fiscal crisis in future years.

The United States obviously is not in good shape, though I think the OECD’s methodology is imperfect.

Yes, America will have to deal with a fiscal crisis if we don’t figure out a way of controlling spending, but I suspect many other countries will reach that point before the U.S. (with Italy quite likely being the next to go belly up).

P.S. At the risk of repeating advice from previous columns, genuine entitlement reform is the only solution to America’s long-run spending problem, ideally enforced by a Swiss-style, TABOR-style spending cap.

Read Full Post »

What’s the most depressing chart in the world?

If you believe in limited government and you’re looking back in time, this example or this example are good candidates.

But if we’re looking into the future, this chart from a new study by the European Central Bank is very sobering.

And it’s a depressing chart because it doesn’t matter whether you believe in big government or small government. That’s because this chart shows a dramatic shift in population demographics.

Simply stated, Europe’s welfare states are in deep trouble because over time there will be fewer and fewer workers to pay taxes and more and more old people expecting benefits.

Here’s what the ECB experts, Katalin Bodnár and Carolin Nerlich, wrote about their findings.

The euro area, like many other advanced economies, has entered an era of drastic demographic change. …Declining birth rates and rising life expectancy are causing the number of pensioners to increase relative to workers. In the next one and a half decades, this trend will be amplified as the sizeable baby boom generation enters retirement and the cohort of workers shrinks. …The old-age dependency ratio is projected to reach almost 54% by 2070… If left unaddressed, population ageing will pose a burden on public finances in the euro area, given the relatively strong role of publicly financed pension and health care systems. Debt sustainability challenges might arise from mounting ageing-related public spending, which will be particularly a concern in high debt countries.

That last sentence in the above excerpt should win a prize for understatement of the year.

Many of Europe’s welfare states already are on the verge of crisis. And as demographics change over time (findings replicated in the European Commission’s Ageing Report), they will go from bad to worse.

Here’s a breakdown of how the “age dependency ratio” will change in various nations.

By the way, if you look at the right side of Chart 4, you’ll see Japan’s horrible numbers as well as a worrisome trend for the United States.

Most people focus on how demographic change will lead to more debt.

I think it’s more important to focus on the underlying problem of government spending.

This next chart combines both. The vertical axis shows the increase in age-related government spending while the horizontal axis shows debt levels.

The bottom line is that countries in the top-right quadrant are in deep trouble. Especially in the long run (though Italy could go belly-up very soon).

The ECB report does suggest ways to address this looming crisis.

To safeguard against the adverse economic and fiscal consequences of population ageing, there is a need to build-up fiscal buffers during good economic times, to improve the quality of public finance and to implement growth-enhancing structural reforms. …Further pension reforms are needed that encourage workers to postpone their retirement.

Don’t hold your breath waiting for any of these things to happen. Building up “fiscal buffers” means running surpluses today to offset deficits tomorrow. But European nations are running big deficits because of excessive spending today, so there will be no maneuvering room in the future.

P.S. Here’s some comedy (and more comedy) about Europe’s fiscal mess.

P.P.S. It is possible to reduce large debt burdens, so long as governments simply restrain spending.

Read Full Post »

In the make-believe country of Libertaria, there is no such thing as Social Security or any other type of government-mandated retirement policy.

In the real world, however, most nations have created “pay-as-you-go” retirement schemes based on taxing young workers to give benefits to old retirees.

That’s the bad news.

The good news is that a growing number of nations have created personal retirement accounts based on private savings. These “funded” systems are designed to replace and/or augment the government programs.

People who study these issues often refer to “three pillars” that represent the various potential sources of retirement income.

  1. Payments from mandatory government tax-and-transfer programs like Social Security in the United States (Pillar One).
  2. Payments from mandated private retirement accounts, such as those in places such as Australia and Chile (Pillar Two).
  3. Payments from voluntary private savings, such as the funds put in IRAs or 401(K)s in the United States (Pillar Three).

In our libertarian fantasy world, everyone would use option #3 and there would not be options #1 and #2.

In a libertarian-ish world, everyone would use option #2 with option #1 only as an emergency back-up.

A few days ago, I saw a headline that got me excited. I thought China was joining the libertarian-ish world by shifting from a pay-as-you-go government system to mandatory private savings (going from option #1 to option #2). Here are some excerpts from a Nasdaq report.

The China Security Regulatory Commission (CSRC) announced the launch of the first private pension plan due to anticipated economic challenges with an aging population. …the CSRC said that pension money “can provide more long-term, and stable funds to develop the real economy, via capital markets.” …This program was created to add additional resources for China’s aging population. In 20 years, 28% of China’s population will be more than 60 years old, up from 10% today, according to the World Health Organization.

But as I read more details, I learned that China was keeping its government system and simply adding an option #3.

Public pensions are currently in place in China; both employees and employers have contributed fixed amounts under state pension plans. …Private pensions are seen as an additional program to state pension plans. Employees can contribute up to 12,000 yuan ($1,860) per year. Contributions will be eligible for tax breaks.

Since people already had the ability to save money, this is hardly an earth-shaking development.

To be sure, it seems like Chinese workers will not have their saving subject to any double taxation if they use these new pension vehicles, so I suppose that deserves some applause.

But it would be much more exciting and praiseworthy if the Chinese government (which has been backsliding in recent years) had proposed some something far bolder.

P.S. To understand why I’m not optimistic about China, here’s my summary of the nation’s post-World War II economic history.

P.P.S. And if China takes advice from either the IMF or OECD, I’ll be even less optimistic.

Read Full Post »

My original intent today was to write about Hungary’s economic policy, presumably focusing on the country’s sometimes good and sometimes bad tax policies.

Why Hungary? Because I’m in Budapest for the next stop on the Free Market Road Show.

But I’ve decided to change topics because of this advertisement that I saw as I got off the plane this morning.

This is not just an example of random national boosterism.

There is a demographic problem in Europe, and it’s particularly acute in Eastern Europe.

Simply stated, people are living longer and having fewer kids. And this has very negative implications for modern welfare states.

So Hungarian politicians decided that the best solution was to spend a lot of money to encourage more children.

Has this effort to create a “Family Friendly Hungary” been successful?

In an article for the Catholic Herald, Professor C.C. Pecknold of Catholic University is a fan of the government’s policies.

…one country has seen marriage rates increase by a whopping 43 per cent… Unsurprisingly, with the increase in marriage, …the national birth rate is currently at its highest in 20 years. The country is Hungary. …Hungary’s Minister for the Family, Katalin Novak, explains… “After we won the election in 2010 with a two-thirds majority, we decided to build a family-friendly country and to strengthen families raising children. …a comprehensive family-support system, a family-friendly tax system, a housing program…” The new law…has a new set of pro-family incentives such as a 3,000 euro mortgage reduction for a second child, and a 12,000 euro reduction for a third. Effective in 2020, mothers with 4 or more children will enjoy a lifetime personal tax exemption.

Robert VerBruggen of the Manhattan Institute says these policies are working.

Here are excerpts from his article published by Law & Liberty.

The experience of Hungary is…instructive… Pronatal policy works, but you have to go big. …the country was spending 5 percent of its GDP on family support, including massive housing subsidies for families with three kids. …Its more recent efforts include loans of up to $33,000 to married couples that are partly forgiven if they have two kids and fully forgiven if they have three, subsidized fertility treatments, and total exemption from income taxes for women with four kids. Hungary is strongly advancing the message that fertility is a good thing and spending lots of money to encourage it, to an extent that would probably be hard to match in the U.S. The much-heralded result has been a “total fertility rate” of about 1.6 children per woman in 2021, a number not seen since the 1990s and an increase of more than a fifth since the 2000s, when the rate fluctuated around 1.3. …Hungary’s income-tax exemption for women with four kids and subsidies restricted to married couples

Lyman Stone of the Institute for Family Studies, writing for National Review, has a mixed view of the Hungarian government’s approach.

Hungary’s overt effort to boost birth rates…is an extraordinary experiment in demographic policy, and one with enormous political ramifications. …it is vital to understand what Hungary’s population policies actually are, and what effects they are having on Hungarian society. …First, in 2015, came CSOK, a program that subsidized credit for home loans for couples having three kids. Then came related programs subsidizing education, minivans, home renovations, and other expenses. Then there was an income-tax program: Women who had four or more children would be exempt from income taxes. Most recently, there’s a “baby loan,” worth over $30,000, which couples can apply for after getting married, and which is forgiven in tranches as they have children. Unfortunately, however, fertility in Hungary has barely budged. …since the financial incentives for a second child were over four times as generous as those for a first child, and for three or more children they were another four times more, Orbán’s government expected a big increase in third or subsequent births. But that isn’t what happened. …in Hungary big families got rarer. …CSOK was a flop. Hungarian fertility rates performed no better than, indeed somewhat worse than, the fertility rates of nearby countries.

As you read these numbers, don’t forget that Hungarians are much poorer than Americans (notwithstanding nonsensical analysis from the OECD).

In other words, $30,000 is a very significant amount of money.

And since economics teaches us you get more of things that are subsidized, Stone points out that fertility is increasing.

But there is some good news: The latest addition to Hun­gary’s suite of baby policies actually seems to be working. Beginning in 2019, Hungarian newlyweds under a certain age and without prior children could apply for a loan with an extremely heavily subsidized interest rate and with payments deferred. As the couple had children, chunks of the loan would be forgiven, so that if they had three children within ten years, they would have gotten a $35,000 cash grant with no strings attached (beyond, of course, having babies). Births in Hungary jumped upwards nine months after this program rolled out… it is similar in principle to the generous baby bonuses that existed at various times in Australia and Quebec, which are widely known to have increased birth rates.

By the way, there’s a critical difference between what is happening in Hungary and the per-child handouts that Biden is proposing in the United States.

Financial support for married childbearing may have actually improved family stability. Notably, the share of children born to unmarried mothers fell from 48 percent in 2015 to just 30 percent in 2020, an extraordinary decline.

So what’s the bottom line?

I’m not a fan of government subsidies for child-bearing, jut as I’m not a fan of onerous fiscal policies that discourage families from having kids.

For what it’s worth, nations generally have not been successful in boosting fertility. But, then again, I doubt any country has been as aggressive as Hungary.

I’ll close with one semi-dour observation.

Let’s assume that Hungary’s pro-natalist policies deserve credit for boosting the fertility rate from 1.3 to 1.6. That seems impressive, but it’s still well short of the replacement rate of 2.1 children per woman.

As such, there’s still a desperate need for genuine entitlement reform (including in the United States) regardless of whether a government tries to subsidize bigger families.

Read Full Post »

One can be against war with Russia, against Ukrainian membership in NATO, and even be skeptical about NATO’s continued existence, but still cheer for Ukraine as it defends itself from Putin’s aggression.

There are even some peaceful steps that the western nations can take to punish the Russian government.

I’ve already written about sanctions against Russia’s oligarchs.

Today, let’s consider how immigration policy can be used to penalize Russia.

We’ll start with the observation that Russia is demographically declining. This is true for many nations, but Russia is in especially bad shape.

As you can see, Russia’s population pyramid has turned into a population cylinder.

The combination of falling birthrates and increasing life expectancy is very damaging to any nation with a tax-and-transfer welfare state.

Working age population will be less than 60% of total population at year 2051. Total population reaches its peak in 1993 at 148,373,584. The elderly population will account for 25.24% of Russian Federation’s population in 2100, population aging is serious.

So how can the countries such as the United States take advantage of Russia’s grim Demographics?

Simple, just invite lots of young, educated Russians to emigrate.

To some extent, this already is happening, as explained in an article for Wired.

Confronted with the likelihood of crippling sanctions, a plummeting ruble, and a country turning aggressively inwards, Aleks made it to the airport with his wife and hopped on a plane to Georgia, where he has some relatives. He was among the first Russian technology workers to make a run for neighboring countries at the outset of the Ukrainian war, but he soon realized he would by no means be the last. Over the past few weeks, throngs of fellow Russian techies have joined him… According to RAEK, a Russian technology trade group, between 50,000 and 70,000 tech workers have already fled Russia, and 70,000 to 100,000 more could leave in April.

As you might expect, the Russian government is trying to discourage emigration.

Here are excerpts from an article in the Washington Post by Joseph Menn.

Russian officials are trying to stem the brain drain, dropping the tax on tech company profit to zero, offering reduced-rate mortgages for their employees, and pledging that information workers will not be conscripted before age 27, according to Borenius, a Finnish law firm. That promise backfired among some workers who have grown so distrustful of government that they feared it meant they would be drafted, said a Russian-born principal at a global investment firm that extracted its few Moscow employees.

The United States easily can counter Russia’s efforts.

James Freeman of the Wall Street Journal wants to allow lots of Ukrainians into America, but also dissident Russians.

…the president and the vice president…are missing out on a huge opportunity to do good in the world and to do well for the United States. …the United States is still only willing to accept a tiny fraction of those fleeing the war zone. …With the region now in flames, not all of the potential new Americans are ready to come here. …Private firms in various countries are already on the hunt for talent. And the available talent eager to live in peace includes Russians… Wharton finance professor Nikolai Roussanov has been noting the brain drain from Vladimir Putin’s Russia.

Heck, we don’t need to limit the invitation to dissidents. We can open the door to economic refugees as well.

There presumably are millions of young and ambitious Russians who would eagerly grab the opportunity to escape Putin’s dirigiste economy.

After all,Russia ranks a lowly #100 in the most recent edition of Economic Freedom of the World. and does even worse (#113) in the most recent edition of the Index of Economic Freedom.

And every young person who leaves would exacerbate Russia’s demographic imbalance.

By the way, this isn’t merely an issue of foreign policy.

It’s quite likely that an influx of Russians would be good for America’s economy.

Russian-Americans are not included in this chart, but I would be very surprised if they were not among America’s high-earning immigrant communities.

I realize that immigration is a divisive issue in the United States. But I assume that opposition is much lower for populations that are likely to earn high incomes and create jobs rather than rely on government handouts.

So it would be a win-win situation. The emigrating Russians would have a chance to become wealth-creators in America (win #1) and the Russian government would lose productive members of its population (win #2).

Actually, it would be a win-win-win situation since America’s economy would benefit from a more vibrant private sector (win #3).

P.S. To ensure that win #3 actually happens, it would be nice to keep Russian immigrants from getting ensnared in America’s dependency-creating refugee system.

P.P.S. Ukraine also suffers from bad economic policy. If Russia ultimately succeeds in taking over the country, the U.S. should welcome escaping migrants, especially if they are young and educated. One would have to imagine that they would have an anti-socialist mindset, much like Cubans and Venezuelans who also have escaped to the United States.

Read Full Post »

It’s impossible to predict when another pandemic will strike.

But there’s one future crisis that we already know about, and I recently spoke about that issue to the Liberty International World Conference in Medellin.

At first, I wasn’t planning to share this video, particularly since I covered much of the same material in a speech back in January.

But then I saw a story in Yahoo Finance that includes this very sobering chart about how the burden of government spending will climb in G-7 nations over the next four decades.

The main takeaway is that aging populations and poorly designed tax-and-transfer programs (entitlements) are a recipe for long-run fiscal crisis in almost all developed nations.

That includes the United States. The four-decade outlook for America isn’t as bad as it is in nations such as France and Japan, but government will grow more than the fiscal burdens in Canada, Germany, and the United Kingdom.

And here are some details from the story.

The Covid-19 pandemic may have bloated public debt…, but that’s nothing compared to the fiscal difficulties brewing in the coming decades, the OECD said. …states will face rising costs, particular from pensions and health care. To maintain public services and benefits while stabilizing debt in that environment, governments would have to raise revenues by nearly 8% of gross domestic product, the OECD said. In some countries, including France and Japan, the size of the challenge would amount to more than 10% of output, and the economists didn’t even account for new expenditures such as climate change adaptation.

If you want to dig into the details, you can click here to read the underlying report from the Organization for Economic Cooperation.

I think the following excerpts are particularly relevant. As you can see, the problem is demographics, which leads to more spending for entitlement programs such as health and pensions.

And, assuming politicians decide to address the issue with revenues, this implies massive tax increases.

Public health and long-term care expenditure is projected to increase by 2.2 percentage points of GDP in the median country between 2021 and 2060… These projections are based on a pre-pandemic spending baseline, so any permanent increase in health spending in response to experience with COVID-19…would come in addition. Public pension expenditure is projected to increase by 2.8 percentage points of GDP in the median country between 2021 and 2060… Other primary expenditures are projected to rise by 1½ percentage points of GDP… This projection excludes potential new sources of expenditure pressure, such as climate change adaptation. …OECD governments would need to raise taxes in this scenario to prevent gross government debt ratios from rising over time… The median country would need to increase structural primary revenue by nearly 8 percentage points of GDP between 2021 and 2060, but the effort would exceed 10 percentage points in 11 countries.

Most interesting, the two authors of the OECD study point out that are some major problems with the tax “solution.”

The results of this section do not imply that taxes will, or even should, rise in the future. The fiscal pressure indicator is simply a metric serving to quantify and illustrate the fiscal challenge facing OECD governments. Raising taxes is only one of many possible avenues to meet this challenge. …Pushing mainstream taxes on incomes or consumption further up, even by only a few percentage points of GDP, may be politically difficult and fiscally counter-productive if it means reaching the downward-sloping segment of the Laffer curve.

I’m especially impressed that they acknowledge the Laffer Curve (the nonlinear relationship between tax rates and tax revenue that the Biden Administration wishes away).

P.S. The real solution is entitlement reform, and here’s the explanation for how to do it in the United States.

P.P.S. As I’ve regularly noted, the economists who work at the OECD often produce very solid analysis. The problem with that bureaucracy is that it has very statist leadership, which is why the OECD’s policy agenda includes anti-growth policies such as big tax increases and tax harmonization.

Read Full Post »

Let’s look today at one of main arguments for Biden’s tax-and-spend agenda.

A column in the New York Times, authored by Spencer Bokat-Lindell, suggests that the United States needs to increase government spending on child care to “shrink the gap” with other nations.

The main evidence for this proposition is a chart showing the United States at the bottom.

The obvious goal is to convince readers that the United States is doing something wrong.

And that comes across in the text of the article.

If you’re active on social media there’s a decent chance you came across this chart…about how much less the U.S. government spends on young children’s care than other rich countries. The infrastructure and family plan that President Biden proposed and that’s now being negotiated in Congress is an attempt to shrink the gap through four key policies: a federal paid family and medical leave program, an extension of the child tax credit (in the form of a monthly payment) that debuted this year, subsidized day care, and universal pre-K.

But why is it bad to be at the bottom of this list when all the nations above the U.S. have lower living standards?

I’ve repeatedly made the point that we don’t want to “catch up” to nations that have lower levels of prosperity.

But maybe this isn’t just about living standards.

The article also suggests that childcare subsidies are needed to avert demographic decline.

…Why does the United States have such an exceptional approach to family and child care benefits…? European and Latin American countries began enacting these policies…the end of World War II accelerated the process, particularly in Europe… “Part of it had to do with fears of demographic decline…the need to recover from those years and to ensure that there was a strong work force going forward,” Siegel told the BBC.

For what it’s worth, I agree that demographic decline is a major issue.

Falling birth rates and increased life expectancy are a very worrisome combination for government budgets.

Which leads to the hypothesis that childcare subsidies can help deal with this problem by enabling higher levels of fertility.

That’s theoretically possible, I’ll admit, but we certainly don’t see it in the data. Here’s the chart from the New York Times, which I’ve augmented by showing fertility rates.

As you can see, the United States has a higher fertility rate than almost every other nation on the list, which certainly suggests that childcare subsidies are not an effective way of encouraging more babies.

Moreover, U.S. fertility of 1.71 is higher than the OECD average of 1.61.

And when you compare the United States to peer nations (“OECD rich nations” and “EU-15 nations”), the fertility gap is even larger, 1.71 to 1.52.

One moral of the story is that government handouts are not an effective way of increasing fertility.

And the other moral of the story is that it’s not a good idea to copy nations that are economically weaker.

Read Full Post »

As a libertarian, I don’t care if couples have zero children or 10 children.

But as an economist, I’m horrified that big changes in demographics are going to lead to fiscal crises thanks to poorly designed entitlement programs.

Simply stated, modest-sized welfare states are sustainable if more and more new taxpayers enter the system to finance benefits for a burgeoning population of old people.

But that’s not happening any more. In most nations, traditional population pyramids are becoming population cylinders because of falling birthrates and increasing longevity.

That’s the bad news.

The good news is that there is growing awareness the demographic changes are happening. Indeed, Damien Cave, Emma Bubola and have a big article on population decline in the New York Times.

All over the world, countries are confronting population stagnation and a fertility bust, a dizzying reversal unmatched in recorded history that will make first-birthday parties a rarer sight than funerals, and empty homes a common eyesore. Maternity wards are already shutting down in Italy. Ghost cities are appearing in northeastern China. Universities in South Korea can’t find enough students, and in Germany, hundreds of thousands of properties have been razed, with the land turned into parks. …Demographers now predict that by the latter half of the century or possibly earlier, the global population will enter a sustained decline for the first time. …The strain of longer lives and low fertility, leading to fewer workers and more retirees, threatens to upend how societies are organized — around the notion that a surplus of young people will drive economies and help pay for the old. …The change may take decades, but once it starts, decline (just like growth) spirals exponentially. With fewer births, fewer girls grow up to have children, and if they have smaller families than their parents did — which is happening in dozens of countries — the drop starts to look like a rock thrown off a cliff. …according to projections by an international team of scientists published last year in The Lancet, 183 countries and territories — out of 195 — will have fertility rates below replacement level by 2100.

Plenty of interesting data, though remarkably little focus on the fiscal implications. Sort of like writing about 1943 France with almost no reference to World War II.

In any event, the article takes a closer look at the challenges in certain nations., including South Korea.

To goose the birthrate, the government has handed out baby bonuses. It increased child allowances and medical subsidies for fertility treatments and pregnancy. Health officials have showered newborns with gifts of beef, baby clothes and toys. The government is also building kindergartens and day care centers by the hundreds. In Seoul, every bus and subway car has pink seats reserved for pregnant women. But this month, Deputy Prime Minister Hong Nam-ki admitted that the government — which has spent more than $178 billion over the past 15 years encouraging women to have more babies — was not making enough progress.

I was struck by the statement from the Deputy Prime Minister that his nation “was not making enough progress”?

That’s a strange way of describing catastrophic decline in birthrates, as noted in the article.

South Korea’s fertility rate dropped to a record low of 0.92 in 2019 — less than one child per woman, the lowest rate in the developed world. Every month for the past 59 months, the total number of babies born in the country has dropped to a record depth.

Maybe, just maybe, government handouts are not the way to boost birthrates.

I’ll conclude by noting that the real problem is tax-and-transfer entitlement programs, not low birth rates.

Both Singapore and Hong Kong have extremely low birth rates, for instance, but they aren’t facing a huge fiscal crisis because they have very small welfare states and workers are obliged to save for their own retirement.

Other Asian jurisdictions, however, made the mistake of copying Western nations, meaning entitlement programs that become mathematically impossible when populations pyramids become population cylinders (or even upside-down pyramids!).

In addition to South Korea, Japan also faces a major challenge.

And the situation is very grim in Europe, even though birth rates haven’t fallen to the same degree (though the numbers is some Eastern European nations are staggeringly bad).

P.S. The United States isn’t far behind.

P.P.S. We know the answer to this crisis, but far too many politicians are focused on trying to make matters worse rather than better.

P.P.P.S. You can read my two-part series on this topic here and here.

Read Full Post »

There are many compelling economic arguments against entitlement programs.

Since I’m a libertarian, I also have moral concerns about tax-and-transfer programs.

Today, though, let’s address the big problem of entitlements and demographics, especially with regards to social insurance programs that transfer money from young people to old people (most notably Social Security and Medicare).

But I’ll start by acknowledging that demographics doesn’t have to be a problem. When nations first created such programs, they generally had “population pyramids” featuring a few old people, lots of working-age people (i.e., taxpayers), and then an even greater number of children (future workers and taxpayers).

As illustrated by this image, entitlement programs can be sustainable with that type of demographic profile.

But there’s been a big shift in demographics in developed nations.

Simply stated, we’re living longer and having fewer kids. In some sense, population pyramids are becoming population cylinders.

And this creates major challenges for entitlement programs because instead of there being many workers supporting just a few retirees, you wind up with “old-age dependency ratios” that require very onerous tax burdens (or very high levels of government borrowing).

I’ve already written how this is a big problem for the United States.

Indeed, I periodically cite long-run forecasts from the Congressional Budget Office to warn about the worrisome fiscal implications.

And I’ve also noted that Japan is in serious trouble.

Today, let’s look at some recent data to show that Europe is another part of the world where this problem is acute.

The European Commission published its 2021 Ageing Report late last year and there are three visuals that deserve attention.

First, here’s a look at the European Union’s population cylinder (or maybe an upside-down pyramid).

And here’s a table that compares the number of old people with the working-age population in 2019, 2045, and 2070.

At the bottom of the table, I’ve circled in red the averages for the eurozone (nations using the single currency) and the entire European Union. From the perspective of fiscal policy, these are horrific numbers.

But there are numbers that are even worse.

Our final visual is a table showing the economic dependency ratio, which the European Commission defines as “… the ratio between the total inactive population and employment. It gives a measure of the average number of individuals that each employed person ‘supports’ economically.”

Once again, I’ve circled the averages at the bottom of the table.

The bottom line is that most European nations already have a stifling fiscal burden, yet it’s all but certain that there will be even higher taxes and more government spending in the near future.

Which means more economic stagnation for Europe (and those of us in America face that possibility as well).

At the risk of stating the obvious, there is a solution to both Europe’s woes and America’s woes. Simply stated, there needs to be genuine entitlement reform.

That means “pre-funding,” which is the jargon for mandatory private savings, presumably augmented by some form of safety net.

Singapore is probably the world’s leading example for mandatory savings, while AustraliaDenmarkChileSwitzerlandHong KongNetherlandsFaroe Islands, and Sweden are a few of the many other jurisdictions that have fully or partially shifted to systems based on real savings.

Read Full Post »

A few days ago, I shared some slides from a presentation to an e-symposium organized by Trends Research in Abu Dhabi.

Here’s a video of my presentation, which includes 16 visuals to drive home the point that the world is facing a demographic/entitlement crisis.

Today, I want to share five more visuals to underscore the severity and magnitude of this catastrophe.

But before we look at the charts, I’ll start by saying this isn’t a fast-developing problem. It’s taken several decades to get where we are now and most nations probably have several decades before an actual crisis materializes.

Though what’s already happened in Greece (and what’s presumably about to happen in Italy) should underscore the seriousness of this issue.

This issue is global, as illustrated by this chart showing the staggering shift that will happen to the world’s population. Simply stated, there are going to be lots and lots of old people, but no concomitant increase in the number of children.

It’s not just that there’s not a corresponding increase in the number of children.

The real story is that birthrates are plummeting.

The data for Europe is particularly sobering.

Here’s a look at some other nations that face big fertility declines.

By the way, there’s absolutely nothing wrong with families deciding they want fewer children.

But it does create a big fiscal problem because governments have tax-and-transfer entitlement programs that were created when everyone thought there would always be ever-larger generations.

But that’s not happening now, which explains why the world is going from eight workers per retiree to four workers per retiree.

That’s the global data. For many developed regions, such as Europe, the situation is far more challenging.

And the United States isn’t far behind.

I’ll close by observing that there’s actually a very simple solution to this problem. We need genuine entitlement reform.

Sadly, that definitely didn’t happen in the past four years in the United States. And it also won’t be happening in the next four years.

P.S. Hong Kong and Singapore have very low birth rates and very long lifespans, but those jurisdictions are in reasonably good shape because they didn’t make the mistake of imposing western-style welfare states.

P.P.S. Some have argued that the demographic problem can be solved by having government-created incentives for fertility. At the risk of understatement, I’m skeptical of that approach.

Read Full Post »

I’ve written many times about demographic change and the implications for public policy – both in the United States and around the world.

Simply stated, it will be increasingly difficult to maintain tax-and-transfer entitlement programs in societies where people are having fewer children and people are living longer.

I’m raising this issue because I spoke on this topic earlier today at an e-symposium organized by Trends Research in Abu Dhabi, UAE. Here’s a slide with my main message.

Why is it bad news from an economic perspective?

As I noted in the next slide, tax-and-transfer entitlement programs for the elderly (most notably Social Security and Medicare in the United States) become harder to finance when there are lots of beneficiaries and too few taxpayers to support them.

So what’s going to happen in various nations when the irresistible force of more beneficiaries meets the immovable object of fewer taxpayers?

In my presentation, I pointed out that there are only three potential solutions.

I explained that higher tax burdens and higher debt levels would not be economically prudent.

The right approach is genuine entitlement reform, but I freely admitted that this “pre-funding” model probably won’t happen.

Here’s the relevant slide.

By the way, Singapore is the role model for pre-funding, but many other nations have adopted that approach for retirement income (such as IsraelDenmarkSwitzerlandHong KongNetherlandsFaroe Islands, and Sweden).

Unfortunately, most nations are heading for a demographic iceberg (including the U.S.) but I fear few of them will enact the reforms that are needed to avert a bad outcome.

Read Full Post »

There are many reasons to be depressed about Italy.

Bad policy is part of the problem, of course, but this chart shows that the country also is facing a demographic crisis. The blue lines show that there are now more deaths than births.

The chart comes from a Bloomberg column by Flavia Rotondi and Giovanni Salzano, and they explain some of the adverse consequences of this demographic change.

Italy isn’t just in an economic slump, its population is also sagging, pushing the country into its biggest demographic crisis in more than a century. The number of people in the country fell for a fifth year in 2019, and deaths exceeded births by almost 212,000, the biggest gap since 1918. …Italy already has huge long-term economic challenges, and the population trends, if they continue, are going to make surmounting them even harder. Italy won’t have enough young workers, and funding a rapidly aging population will strain an already stretched fiscal situation. Pension costs now amount to almost 17% off the economy. …“With an aging population and a consistent decrease of workers who pay taxes, our retirement system may go haywire” said Pietro Reichlin, a professor of economics.

Politicians naturally will want to compensate for these changes by raising the tax burden.

But Italy already is at a breaking point because of punitive taxation. Writing for the Foundation for Economic Education, Daniel Di Martino discusses that nation’s dirigiste system.

Italy’s problem, similar to many of its southern European neighbors, is an oppressively high tax burden, irresponsible welfare programs that encourage high measured unemployment and increase the debt, and high levels of regulation. …the share of average wages collected by the Italian government via income and social security taxes is 48 percent, among the highest in the Organization for Economic Co-operation and Development (OECD). In addition, Italy imposes a value-added tax of 22 percent on most goods and services, one of the highest in Europe. Plus, Italy’s corporate, capital gains, gift, and myriad other taxes are passed on to individuals and borne directly by workers. …At the same time, Italy’s complex regulations are a barrier to starting or continuing productive activities. A study by economist Raffaela Giordano of the Bank of Italy concluded that the main reason behind Italy’s underperformance was burdensome regulations and corrupt and inefficient government structure.

Adam O’Neal makes similar points about bad policy in a column for the Wall Street Journal.

Even before the pandemic, Italy hadn’t recovered fully from the 2008-09 financial crisis. Unemployment hovered around 10% in 2019. Adjusting for inflation, the average Italian worker earned the same as he did 20 years ago. Italian banks were Europe’s weakest. …What ails Italy? …Italy’s greatest challenge is a gargantuan government that destroys wealth as efficiently as the private economy creates it. …In 2018 government revenue was 42% of GDP, nearly 8 points above the Organization for Economic Cooperation and Development average. Yet profligate outlays—Rome spent 16.2% of GDP on public pensions in 2015—brought debt to about 135% of GDP last year.

The net effect of all this misguided policy is that Italy’s economy is moribund.

In his column for Bloomberg, Professor Tyler Cowen summarizes the problem.

One striking fact about Italy is that, over the last 20 years, growth in per capita income has been close to zero. …a zero-growth environment cannot be stable forever. …If the pie doesn’t grow, eventually it becomes harder to sustain productive activity… Aging is another reason economic growth is necessary. …many countries (including Italy) have expensive pension systems. Someone has to pay the bill, and without innovation and economic growth, taxes will have to rise. That in turn discourages work, pushing people into untaxed black-market activity, necessitating higher tax rates, and the vicious cycle starts again.

And when you combine bad demographics and bad policy, that not only means stagnation in the short run, it also could mean fiscal crisis in the long run.

Except “long run” may be just around the corner.

Desmond Lachman of the American Enterprise Institute warns that an Italian fiscal crisis will make the mess in Greece seem trivial by comparison.

…markets are displaying remarkable complacency toward a rapidly deteriorating Italian political and economic situation. They are doing so in a manner that is painfully reminiscent of how complacent they were in 2009 on the eve of the Greek sovereign debt crisis. This could have major consequences for global financial markets considering that the Italian economy…has around 10 times as much public debt as Greece had at the time of its crisis. …One has to hope that while markets might be turning a blind eye to Italy’s deteriorating economic and political fundamentals, global economic policymakers are not. As experience with the Greek sovereign debt crisis reaffirmed, crises often take a lot longer than one would have thought to occur, but when they do occur they do so at a very much faster rate than one would have expected.

Some people argue that a fiscal crisis can be avoided if the European Central Bank buys up Italy’s government debt.

That certainly can avert a panic, at least for a while, but this approach can cause a different set of problems.

Joseph Sternberg opines for the Wall Street Journal that the European Central Bank’s easy-money policy has backfired by giving politicians in Rome the leeway to postpone desperately needed reforms.

If the ECB had not stepped in as a buyer of government debt, Rome long since would have faced fiscal catastrophe. Only a miracle—or €365 billion in ECB purchases of Italian sovereign debt since 2015—can explain how in recent years a country whose debt has ballooned to 130% of gross domestic product paid nearly the same interest rate as Germany… Even after selling so many sovereign bonds to the central bank, Italy’s banks continue to be large holders of their government’s debt. Such bonds constitute around 10% of Italian bank assets, nearly three times the eurozone average. …Mr. Draghi hoped his interventions would give wayward governments such as in Rome breathing room to overhaul the supply side of their economies—deregulating markets, privatizing state assets, trimming welfare programs and the like. But Rome has mainly slid backward.

While intervention by the European Central Bank isn’t the solution to Italy’s problems (and may actually make problems worse), this is also a good opportunity to make the related point that the euro currency also shouldn’t be blamed for the nation’s stagnation.

I’m not a big fan of the European Union and the crowd in Brussels, but Italy’s challenges overwhelmingly are the fault of policies adopted by Italian politicians.

Indeed, if you look at the data from the most-recent edition of the Fraser Institute’s Economic Freedom of the World, you can see monetary policy isn’t a problem. Instead, the nation’s big impediment to prosperity (highlighted in red) is terrible fiscal policy.

To put this data in perspective, Italy has the next-to-lowest-ranked economy in Western Europe, with only Greece having less economic liberty.

The numbers from the Heritage Foundation’s Index of Economic Freedom tell a very similar story.

If you peruse the data from the most-recent edition of that publication, you’ll see that Italy gets weak scores for its approach to labor issues, the judiciary, and taxes.

But it gets an utterly dismal score (highlighted in red) for government spending.

Sadly, there’s no political party in Italy that wants to solve the problem of excessive spending – even though I explained how it could be done while in Milan many years ago. And without spending restraint, that means it’s almost impossible to adopt pro-growth tax reform.

P.S. No wonder some people in Sardinia want to secede from Italy and instead become part of Switzerland.

P.P.S. Amazingly, a New York Times’ columnist actually argued that the United States should be more like Italy.

Read Full Post »

Before our depressing discussion today about the fiscal impact of entitlement programs (Social Security, Medicare, Medicaid, EITC, Food Stamps, welfare, and Obamacare, etc), here’s a video of how it all began.

I think this is a great introduction to the issue, particularly since you learn how “public choice” (i.e., politicians engaging in self-serving behavior) played a key role in the development of today’s welfare state.

But if you don’t have the time to watch a long video, here are four key things to understand.

  1. Entitlements (budget geeks sometimes use the term “mandatory spending”) are programs that automatically give people money if they meet certain requirements (such as reaching a certain age or having income below a certain level).
  2. Since these programs automatically give people money, they are not part of the annual appropriations process (the “discretionary spending” parts of the budget that are determined on a yearly basis).
  3. Some entitlement programs are “means tested” and designed to funnel money to low-income individuals. This type of spending is sometimes referred to as “unearned benefits.”
  4. Some entitlement programs are “social insurance” since people pay specific tax in exchange for specific benefits. This type of spending is sometimes referred to as “earned benefits” (though in many cases recipient receive much more than they paid).

By the way, there’s one additional thing to understand.

Indeed, it may be the most important thing to understand if you care about America’s fiscal and economic future.

5.  Entitlement programs are a slow-motion fiscal train wreck.

Let’s look at a new study authored by James Capretta of the America Enterprise Institute. He also has some sobering observations on the history of entitlement programs.

The growing expense of entitlement programs has occurred steadily for more than a half century and is reflected in the shifting distribution of federal spending activity. …by the early 1960s, two-thirds of all spending continued to require approval by the House and Senate appropriations committees each year, and less than a third was spent on entitlement programs. … By 2019, nearly two-thirds of all spending in the budget was for entitlement programs, and less than a third went to annually appropriated accounts.

If you prefer this information visually, here are a couple of pie charts from the study.

While there are dozens of entitlement programs, the big three are Social Security, Medicare, and Medicaid.

The largest entitlement programs are Social Security, Medicare, and Medicaid. Together, they now make up nearly half of all federal spending. Their combined growth over the past half century is the primary source of intensifying fiscal pressure. …In 2019, combined federal spending on them was 9.8 percent of GDP, up from 3.7 percent in 1970. CBO expects them to cost 17.2 percent of GDP in 2050, which is almost equal to the average annual revenue collected by the federal government from 1970 to 2019.

And here’s how they’ve been consuming ever-larger shares of America’s economic output.

What’s driving this ever-increasing fiscal burden?

In part, it’s because we have more and more old people and they are living longer.

So what does all this mean?

Capretta points out that uncontrolled entitlement spending may lead to a debt crisis.

I don’t disagree, but I think that’s a secondary concern. The real problem is that government spending will become an ever-larger economic burden. And that will hinder growth whether it’s financed by borrowing or taxes.

Speaking of taxes, here’s the chart from the study that deserves our close attention. It shows the relationship between demographics, benefit generosity, and tax burdens.

Here’s how Capretta describes the relationship.

…for each of the stipulated replacement rates (25, 50, and 75 percent), the tax rate necessary to keep the program solvent rises with increases in the aged dependency ratio. This explains why social insurance taxes in many aging societies have been increased to high levels in recent decades.

I’ve taken the liberty of augmenting the chart to show how these factors interact (though the order of #1 and #2 doesn’t matter).

The bottom line is that the United States is on track to become a high-tax, European-style welfare state if fiscal policy is left on autopilot.

In other words, unless there’s genuine entitlement reform, future Americans will be condemned to lower living standards.

P.S. Here’s some more history. In a column for the American Institute for Economic Research, Richard Ebeling looked at British history to explain how the private sector played a role in social insurance before being displaced by government.

Throughout the 19th century, a primary means for the provision of what today we call the “social safety nets” was by the private sector outside of government. The British Friendly Societies were mutual assistance associations that emerged to provide death benefits for the wives and children of the breadwinner who had passed away. But they soon offered a wide array of other mutual insurance services, including health care coverage, retirement pension programs, unemployment insurance, savings clubs to purchase a family house, and a variety of others. …by the end of the 19th century around two-thirds to three-quarters of the entire British population was covered by one or more of their programs and insurances. The research also discovered that a large majority of the subscribers were in the lower income brackets of the time… What stands out is that these were all private and voluntary associations and exchanges, in which the government paid little or no role.

On a related note, here’s an excellent short video on the English “poor laws” from the 1800s.

P.P.S. In addition to the fiscal burden of entitlement programs, there’s also a major problem in the way these programs discourage work.

Read Full Post »

Despite the fact that Social Security is an ever-increasing fiscal burden with a 75-year cash-flow deficit of nearly $45 trillion, many politicians in Washington have been trying to buy votes with proposals to expand the program (Barack Obama, Hillary Clinton, Bernie Sanders, Elizabeth Warren, etc).

A new working paper from the European Central Bank gives us some insights on what will happen if they succeed.

Authored by Daniel Baksa, Zsuzsa Munkacsi, and Carolin Nerlich, the study look at the long-run impact of related policies in Europe, using Germany and Slovakia as examples.

Here’s their description of the study.

In view of the adverse macroeconomic and fiscal implications of ageing, many European countries have implemented significant pension reforms… More recently, however, the reform progress has stalled, and despite an unchanged demographic outlook, several European countries reversed, or plan to do so, parts of their previously adopted pension reforms. In this paper we offer a framework that allows us to evaluate the macroeconomic and fiscal costs of pension reform reversals. …By using a general equilibrium model with overlapping generations we can account for feedback effects between changes in pension parameters, pension expenditures and macroeconomic variables. …The model is calibrated for Germany and Slovakia.

Before sharing their findings, here’s a look at how demographics are a ticking time bomb for Europe.

The yellow dots are the 2016 numbers for the old-age dependency ratio (the number of people over 65 compared to the 15-64 working-age population) and the red dots show how that ratio will deteriorate by 2070 (the numbers for the United States are similarly grim).

These bad numbers mean that Europe’s economic outlook will worsen over time.

…population ageing has adverse macroeconomic and fiscal implications. …the results show an increase in the public debt-to-GDP ratio by around 100 percentage points until 2070, compared to the initial period, for both Germany and Slovakia. Moreover, real GDP per capita is projected to decline by almost 14% in Germany and 9% in Slovakia, compared to the initial period.

But it’s possible for the numbers to get better or worse, depending on changes to public policy.

…similar to other studies we find evidence that pension reforms help to contain the adverse implications of ageing… In particular, increases in the retirement age appear to help to alleviate ageing pressures most. …we find strong evidence for the presumption that reversals of pension reforms are potentially very costly. In fact, reform reversals would not only result in higher aggregate pension expenditure and public debt-to-GDP ratios, but would in most cases also exacerbate the adverse macroeconomic impact of ageing.

Unfortunately, public policy is now trending in the wrong direction. Here’s what’s been happening in Germany and Slovakia.

Germany recently decided to cap the decline in the benefit ratio and the increase in the contribution rate until 2025 at certain levels, and is considering whether to extend this cap even until 2040. Slovakia decided to break the automatic link between changes in life expectancy and retirement age, by capping the retirement age at 64 years. …in the reversal scenario for Germany we freeze the benefit ratio at its current level of 48% and assume that the contribution rate would not exceed the threshold of 20% until 2040. With this reform reversal scenario we assume that the agreed freeze of the benefits ratio and contribution rate until 2025 will be ex-tended until 2040. In Slovakia, we assume the retirement age to stop increasing from the year 2045 onwards.

And what do they find when countries backtrack on reform?

Here’s what they estimated in Germany.

For Germany, we find that the reform reversal would imply sizeable costs (see Table 6, column “reform reversal”). Specifically, by 2070, the increase in the public debt-to-GDP ratio can be expected to be ceteris paribus almost 60 percentage points higher than under the baseline scenario, as a result of higher pension expenditures, adverse feedback effects and lower contribution rates.

For those interested, here’s Table 6, which I’ve augmented by highlighting in red the most relevant changes. Yes, the debt increases compared to the baseline, but I think it’s equally important (if not more important) to see how young people are hurt and how the burden of government spending goes up.

Now let’s see what the authors found for Slovakia.

…we quantify the fiscal costs of the reform reversal in Slovakia by comparing the debt impact under the reform reversal scenario with that under the baseline scenario. Our results show that such a reform reversal would be very costly. In fact, the increase in the public debt-to-GDP ratio would be more than 50 percentage points higher than the estimated increase of around 100 percentage points of GDP under the baseline scenario (see Table 7).

Here’s Table 7, and again I have highlighted in red the increase in debt as well as the data showing additional harm to young people and a much bigger increase in the burden of government spending.

So what do these findings mean for the United States?

Let’s explain using a homemade infographic. I’ve put four options for Social Security on a spectrum. Here’s what they mean.

  • “Expand Social Security” means more taxes and spending in pay-as-you-go systems that are already costly and out of balance.
  • The “Status Quo” is a typical pay-as-you-go-system (where the United States is now and where Germany and Slovakia were before their reforms).
  • Conventional Reform” means trying to stabilize a pay-as-you-go system by demanding that workers pay more while promising to give them less (what Germany and Slovakia did).
  • The most market-friendly position is “Personal Retirement Accounts,” which transforms creaky pay-as-you-go systems into real individual savings.

Here’s the infographic, including arrows to indicate that some options mean more government and others mean more prosperity.

What Germany and Slovakia did was move from “Status Quo” to “Conventional Reform.” But now they’re backtracking on those reforms and shifting back to the old version of the “Status Quo.”

In other words, a move in the direction of “More Government” and the European Central Bank’s study shows such a step will have negative consequences.

In the United States, by contrast, some folks on the left want America to move from “Status Quo” to “Expand Social Security.”

Like Germany and Slovakia, we’d be moving in the wrong direction. But the damage for the U.S. presumably would be worse because we didn’t first take a step in the right direction.

P.S. If you want to learn more about the best option, Australia, Denmark, Chile, Switzerland, Hong Kong, Netherlands, Faroe Islands, and Sweden are a few of the many jurisdictions that have fully or partially shifted to systems based on real savings.

Read Full Post »

Every so often, I share very weird stories about government regulations, from both America and around the world. And when I say weird, I’m not exaggerating.

But we also have some strange examples of tax loopholes.

I’m not talking about corporate jets, which should be characterized as a business expense.

Instead, I’m referring to bizarre examples of income that is arbitrarily exempt from tax.

The weirdest example in the United States is from Nevada (probably because politicians have a conflict of interest).

Today I want to write about a new tax loophole in Poland.

Polish lawmakers have approved a measure that would exonerate most workers under the age of 26 from income taxes… The bill would exonerate workers under the age of 26 from Poland’s 18 percent personal income tax for those whose gross earnings don’t surpass 85,500 zlotys (20,000 euros, $22,500) per year. That level is higher than Poland’s average income… Some two million people could benefit from the measure.

So what’s motivating this example of age-based tax discrimination?

Poland has long been haemorrhaging skilled workers to other EU states where they can find better paying jobs, posing both a long-term demographic risk and short-term problem finding enough labourers to continue the country’s streak of economic growth since the fall of communism in 1989.

I certainly agree that Poland faces a demographic challenge (along with other nations in Eastern Europe), both because of emigration and low birth rates.

And I also agree that Poland’s economy has been relatively successful since escaping the evil of communism.

But I’m not very confident that this policy is the right recipe for continued prosperity.

  • First, I don’t like discrimination in the tax code, whether based on the source of income, the use of income, the level of income, or – in this case – the age at which income is earned.
  • Second, this policy doesn’t affect social insurance taxes and value-added taxes, which are actually the biggest burden for ordinary workers in many Eastern European nations.
  • Third, unless Poland’s government imposes some spending discipline, a tax preference for young people may lead to higher taxes on other groups, thus offsetting any economic benefit.

To be sure, I’m glad Poland is addressing the issue by lowering taxes rather than by creating new programs and subsidies, as we’ve seen in some other European nations.

I’m simply not expecting big results.

P.S. You can click here to peruse other oddball examples of international tax policy.

Read Full Post »

It’s not easy picking the most pessimistic chart about Japan.

The country suffered several decades of economic stagnation following the collapse of a bubble about three decades ago.

That means it’s a bit of a challenge to identify the worst economic numbers.

  • Is it the data on ever-rising levels of government debt?
  • Is it the data on an ever-rising burden of taxation?
  • Or is it the data on an aging population and falling birthrate?

For what it’s worth, I thought the tax data was the most depressing.

But now there’s a new challenger for the grimmest chart.

I’m currently in Japan, where it’s almost bedtime. I just heard a speech from the governor of the Tokyo Prefecture.

As part of her remarks, she shared a slide showing how Japan has plummeted in the IMD competitiveness rankings.

I don’t have her chart, but I found another version with the same data.

And Japan has dropped to #30 in the recently released 2018 version.

By the way, you won’t be surprised to learn that Economic Freedom of the World shows a similar decline.

Japan was ranked in the top-10 back in 1990, but now it’s dropped to #41.

This is not quite as pronounced as Argentina’s drop in the rankings for per-capita GDP, but it’s definitely a sign that something’s gone wrong in the Land of the Rising Sun.

P.S. Japan has a very strong entry in the contest for the world’s most inane regulation.

P.P.S. And if there was a contest for the most ineffective form of government waste, Japan would have a very strong entry for that prize as well.

Read Full Post »

I’m a big fan of many of the economic reforms that have been implemented in Estonia, Latvia, and Lithuania.

All three of the Baltic nations rank highly according to Economic Freedom of the World. Estonia and Lithuania are tied for #13, and Latvia isn’t far behind at #23.

Rather impressive for nations that suffered decades of communist enslavement.

But this doesn’t mean I’m optimistic for the future of these countries.

Simply stated, they need a lot more reform to prepare themselves for demographic decline.

And demographic decline is a huge issue, in large part because young people are moving away. Here are some excerpts from a Bloomberg report.

According to the UN’s Department of Economic and Social Affairs, nine of the world’s countries most at risk of losing citizens over the next few decades are former East bloc nations. Porous borders and greater opportunity in the west have lured people away. …The trend is hitting especially hard in the Baltics. Latvia, with a current population of 1.96 million, has lost about 25 percent of its residents since throwing off Soviet control in 1991. The U.N. predicts that by 2050, it will have lost an additional 22 percent of its current population…and by 2100, 41 percent. In Estonia, with a population of 1.32 million, the U.N. foresees a 13 percent decline by 2050 and a 32 percent drop by 2100. And in Lithuania, the current population of 2.87 million is expected to drop by 17 percent by 2050. By 2100, it will have lost 34 percent. …Latvian demographer Mihails Hazans said that, as of 2014, one in three ethnic Latvians age 25 to 34 — and a quarter of all Latvians with higher education — lived abroad.

Part of the issue is also fertility.

Here’s a chart from the World Bank showing that all three Baltic nations are way below the replacement rate.

The combination of these two factors helps to explain this map.

As you can see, the Baltics don’t quite face the same challenges as Moldova.

But that’s the only silver lining in these grim numbers.

By the way, people should be free to emigrate.

And women should be free to choose how many children to have.

But when a country also has a welfare state and – over time – there are more and more old people and fewer and fewer young taxpayers, that’s a recipe for some sort of Greek-style fiscal crisis.

Fortunately, there is a solution to this problem.

The Baltic nations need to copy Hong Kong. Fertility rates are even lower there, but the jurisdiction doesn’t face a big long-run fiscal challenge since people mostly rely on private savings rather than tax-and-transfer welfare states.

P.S. One of the reasons I like the Baltic nations is that they cut spending (actual spending cuts, not fake DC-style reductions in planned increases) when they were hit by the global financial crisis last decade.

P.P.S. Even better, Paul Krugman wound up beclowning himself by trying to blame Estonia’s 2008 recession on spending cuts that occurred in 2009.

Read Full Post »

When I give speeches on the importance of public policy, I frequently share data showing that pro-market nations are relatively prosperous when compared to countries with statist policies.

One of the most dramatic examples is South Korean prosperity versus North Korean deprivation.

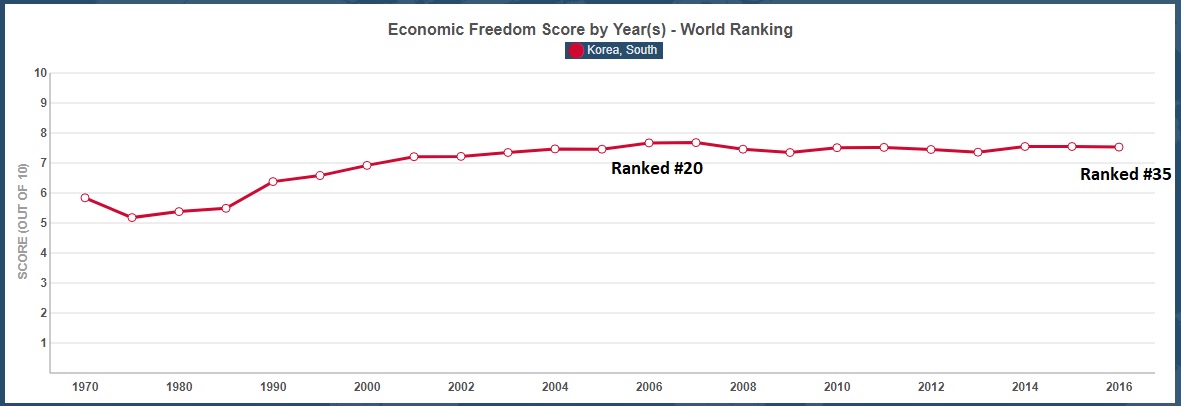
It’s not that South Korea is perfect. After all, it only ranks #35 according to Economic Freedom of the World.

But that’s enough economic liberty to be in the “most free” category. And this helps to explain why South Korean living standards have climbed dramatically compared to the economic hellhole of North Korea (and you see something similar if you compare Venezuela and South Korea).

I’m definitely not the only person to notice the difference between the two Koreas. Here are some excerpts from one of Richard Rahn’s columns in 2017.

In 1960, South Korea and North Korea were similar in their poverty. Now, 50-plus years later, South Korea has a per-capita income more than 20 times that of North Korea, at approximately $38,000 per year, which is higher than that of Spain or Italy. South Koreans have gone from a per-capita income in 1970 that was about 10 percent of the average American to almost 70 percent today. …Koreans in both the North and South come from the same genetic stock, speak the same language, and occupy adjoining pieces of land with much of the same topography and limited natural resources. North Korea is the ultimate consequence of socialism, which always contains the seeds of its own destruction. Socialism goes against human nature, requiring its government to become increasingly authoritarian — North Korea being Exhibit A.

But Richard also warned that South Korea can’t rest on its laurels.

While economic growth per year averaged more than 9 percent from 1963 to 1990, it has now slowed down and last year was only 2.8 percent…a sharp drop from earlier decades. There is too much unneeded and counterproductive regulation, including the lack of ease of creating new businesses, barriers to imports and inward foreign investment. By any measure, South Korea has been a great success, but probably not as much as it could have been or can be if it followed more of a classic free trade and more limited-government model as practiced by Hong Kong and others. The country is increasingly exhibiting the disease of most other rich, developed democracies by allowing itself to be slowly seduced into the promise of more government services and attendant regulation, rather than the tougher and more competitive policies that created the wealth. Will South Korea avoid the stagnation of Japan and much of Europe? The jury is still out.

The jury may still be out, but there is growing evidence that South Korea is heading in the wrong direction because the nation’s relatively new President in increasing the burden of government.

Here are some passages from a report in the Japan Times.

Moon Jae-in began his second full year as South Korea’s president with a reminder of what didn’t work in the first — namely his economic policies. …The self-styled “jobs president” has seen his once sky-high poll numbers tumble… Moon, a progressive, was swept into office in 2017 promising a reversal from the conglomerate-focused economic agenda of ousted President Park Geun-hye. But his plan to raise the minimum wage 11 percent disappointed… More than three-quarters of the 30 experts surveyed by Bloomberg News last month predicted that employment growth would slow this year, in part because of the wage hike. …In a speech at his news conference Thursday, Moon…pledged to improve the safety net…and fix what he described as “the worst forms of polarized wealth and economic inequality in the world.” …More than half of South Koreans surveyed in another Gallup poll last month said that the administration needed “to focus on economic growth, rather than income distribution.”

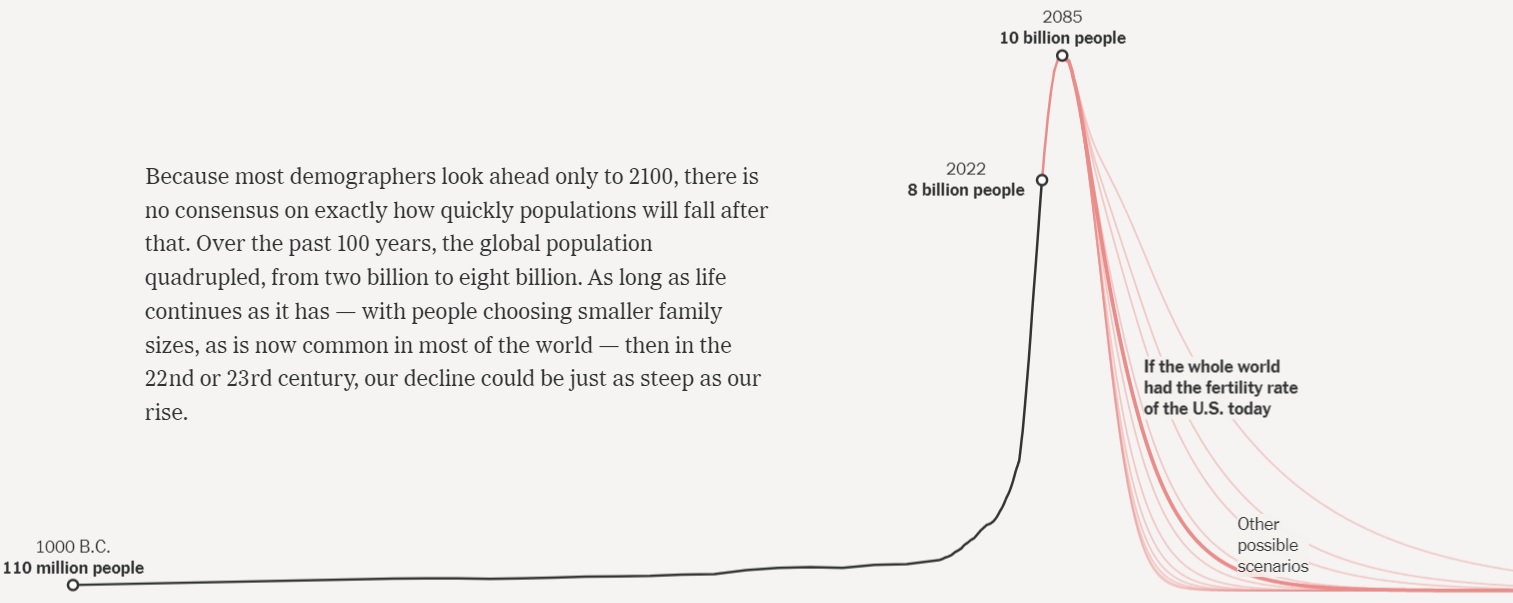
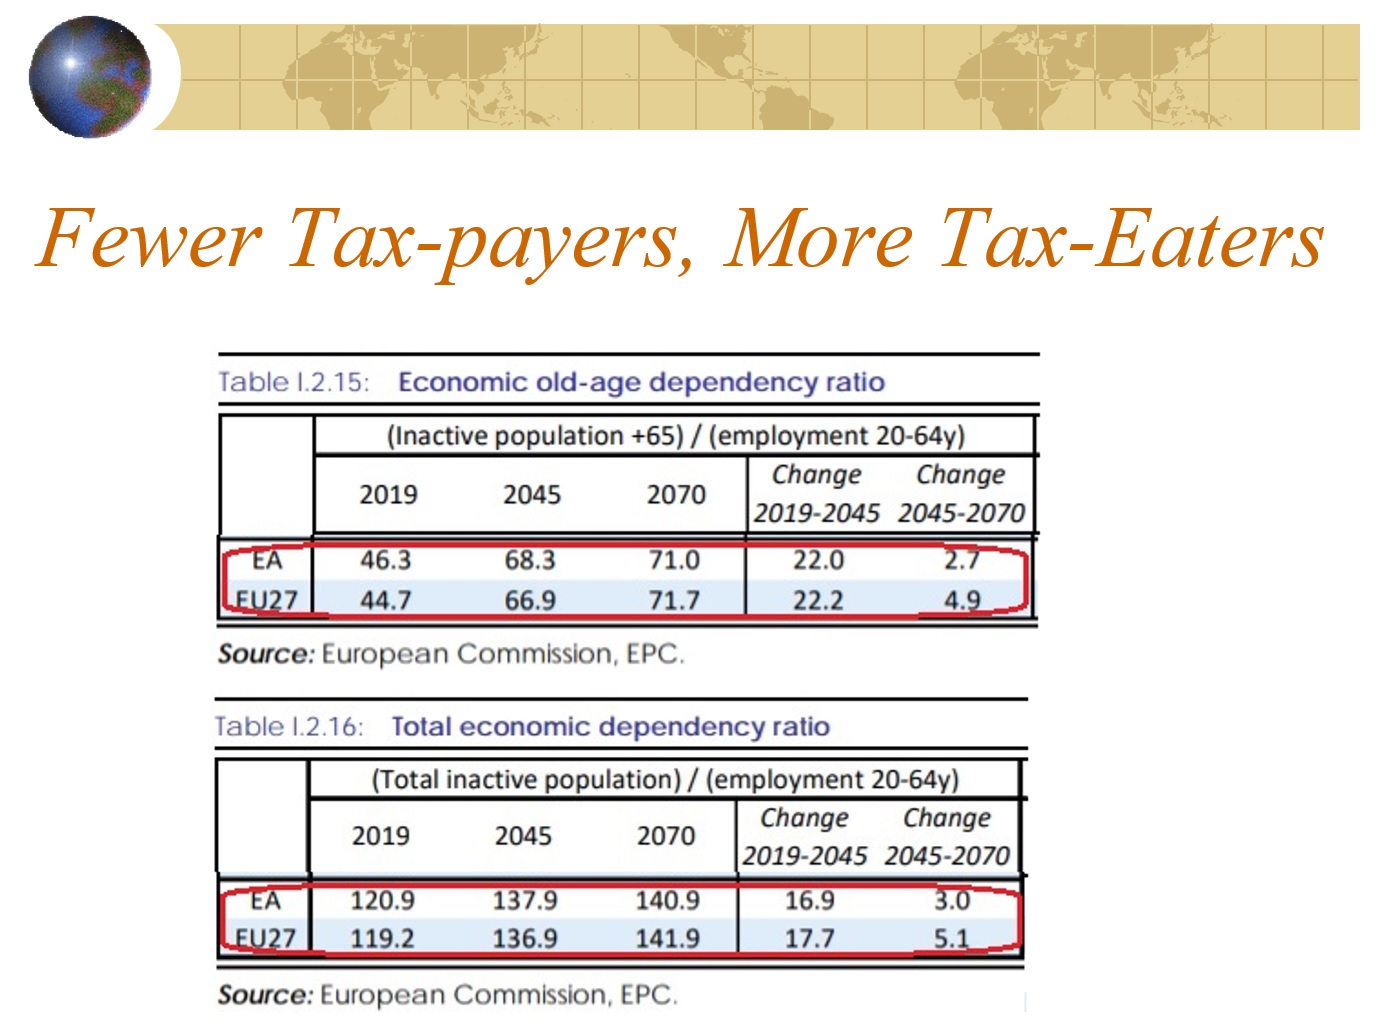
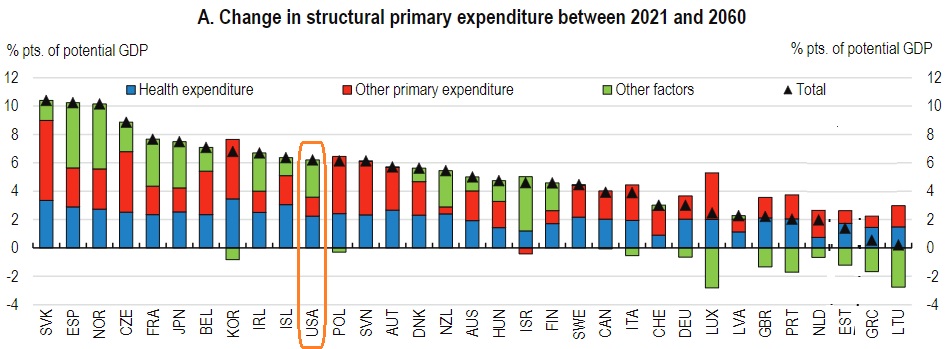
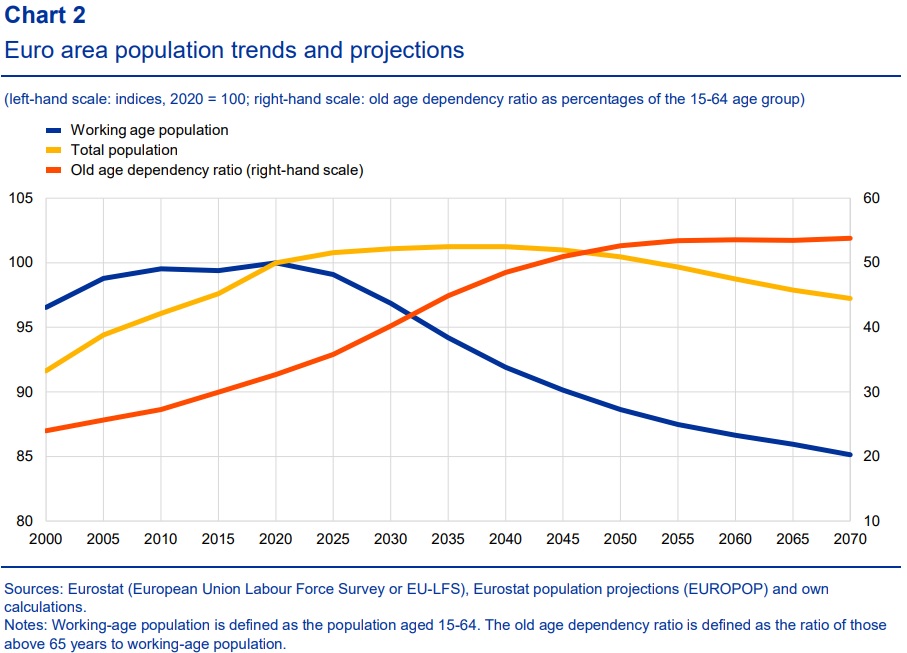
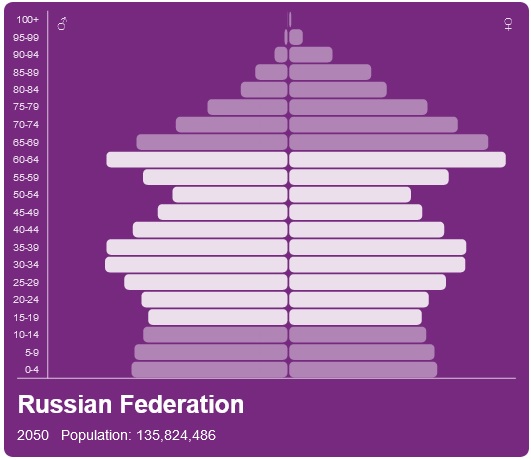
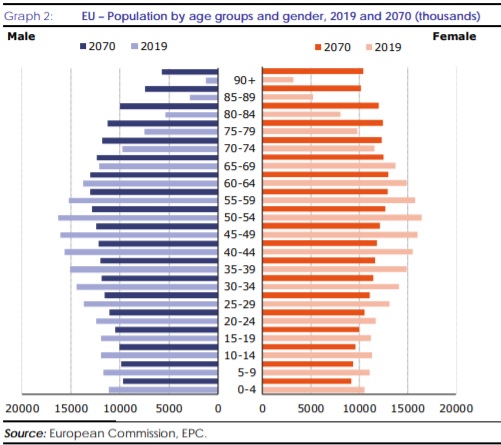
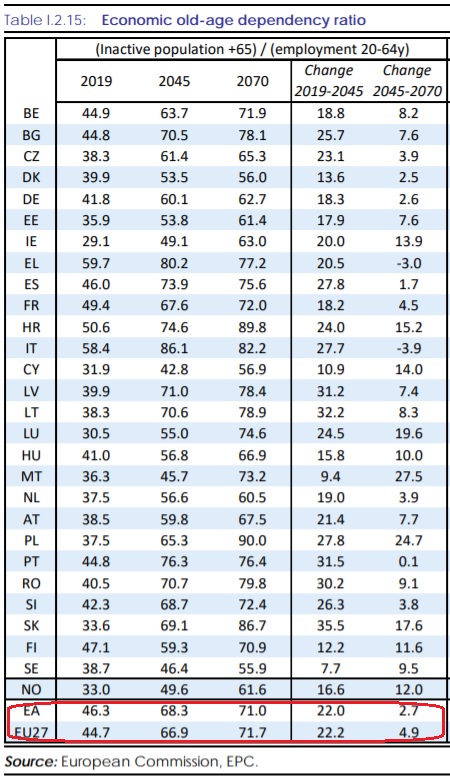
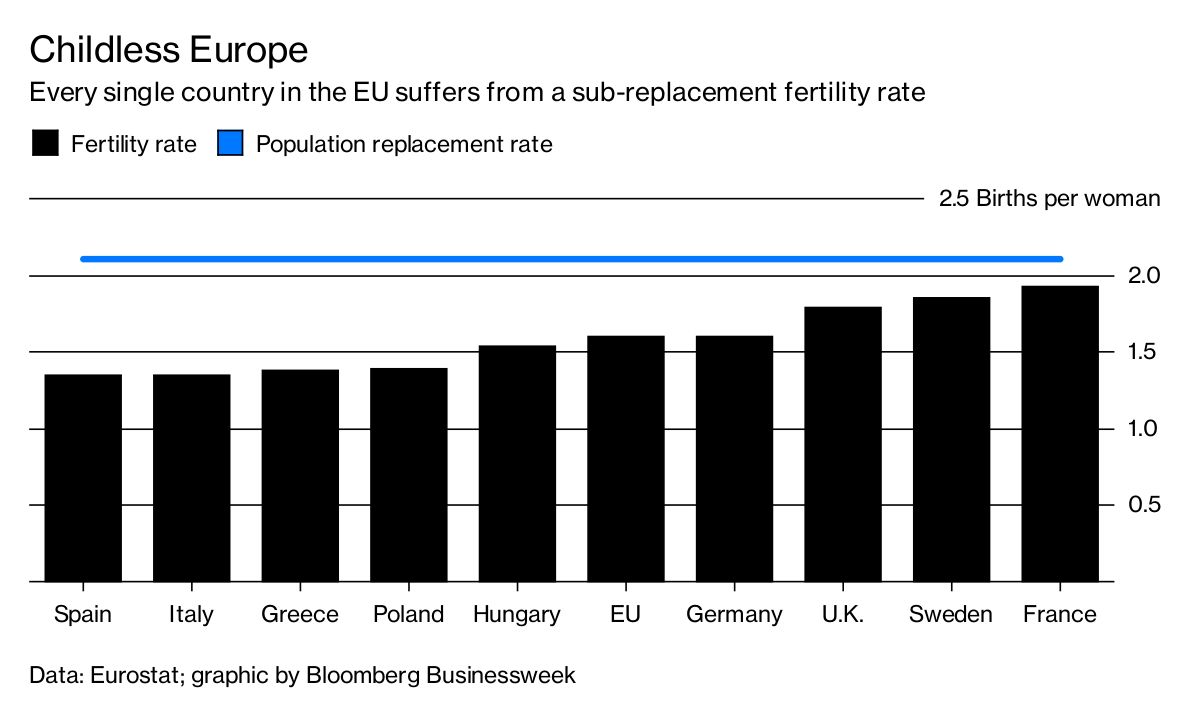
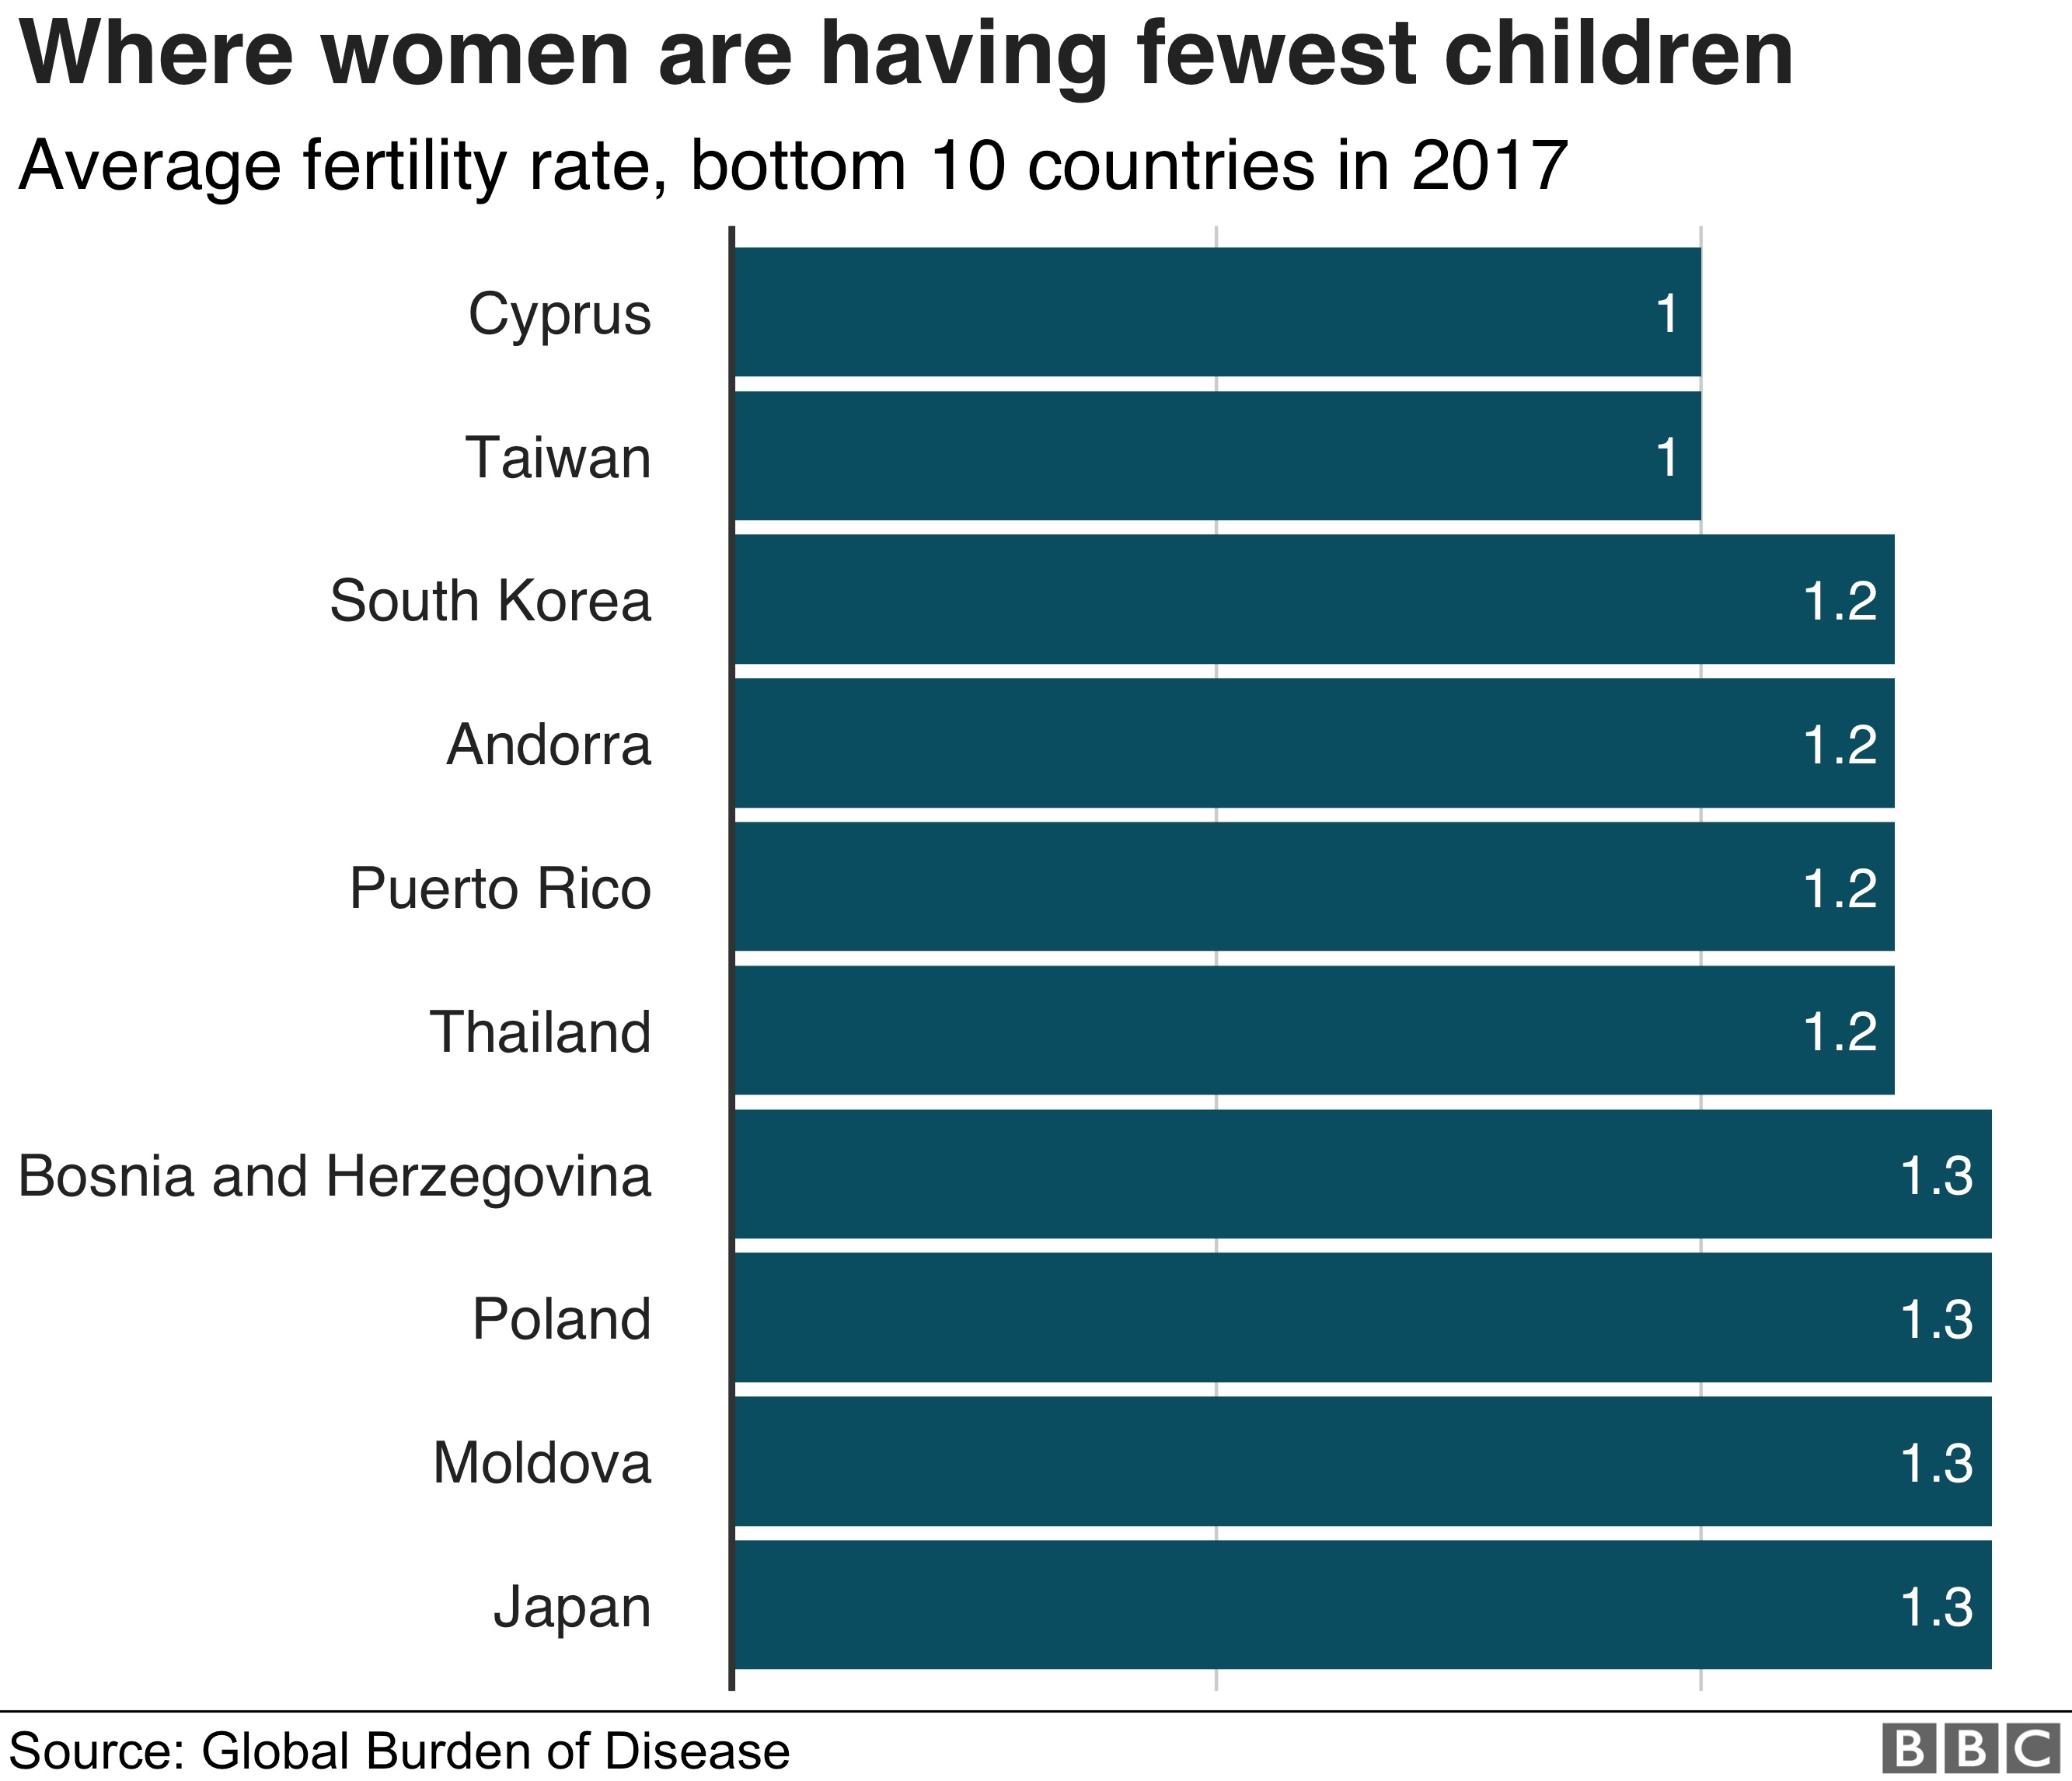
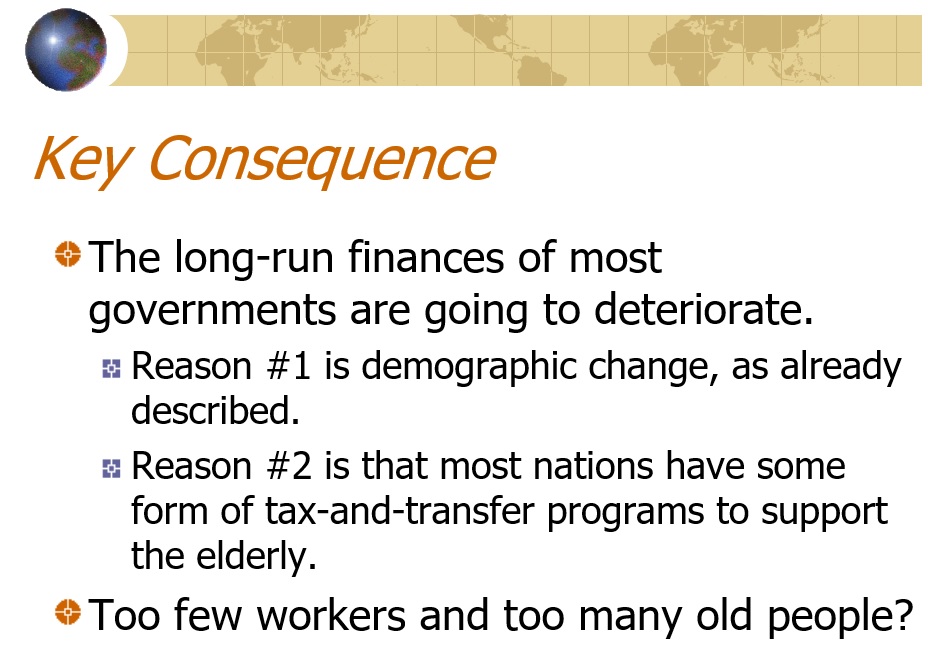
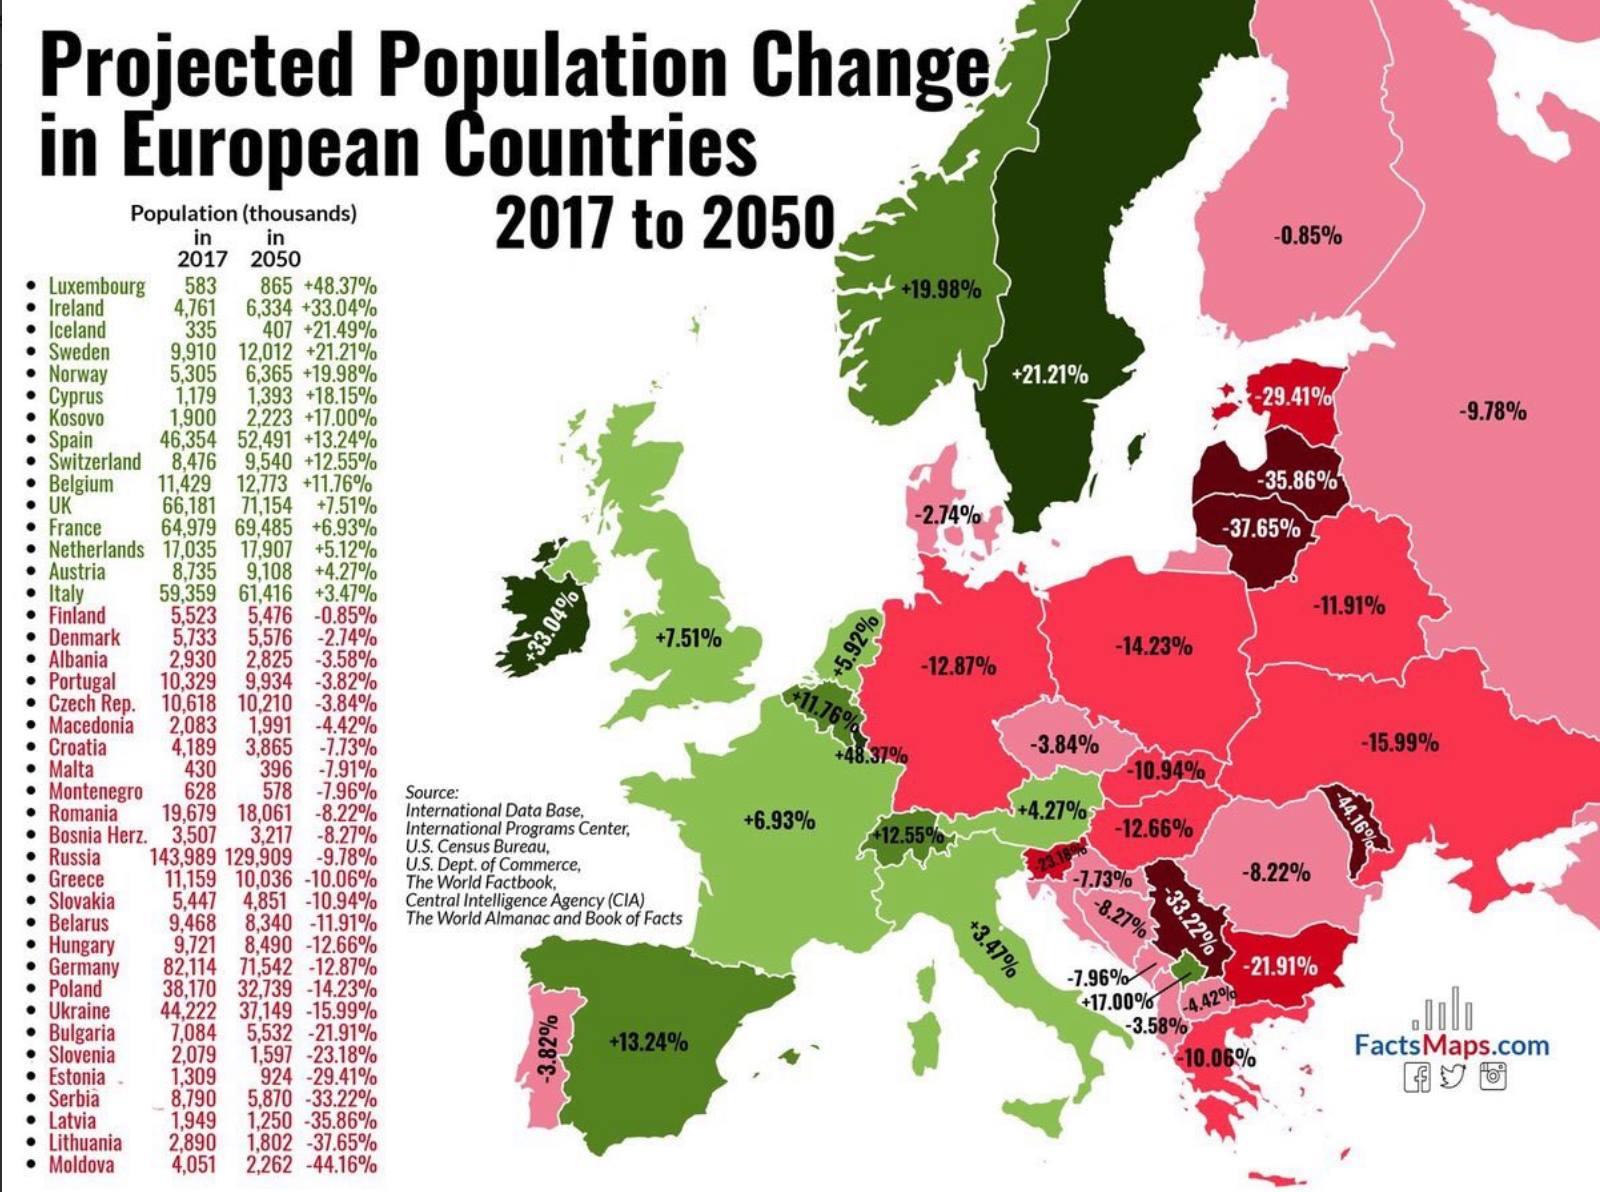
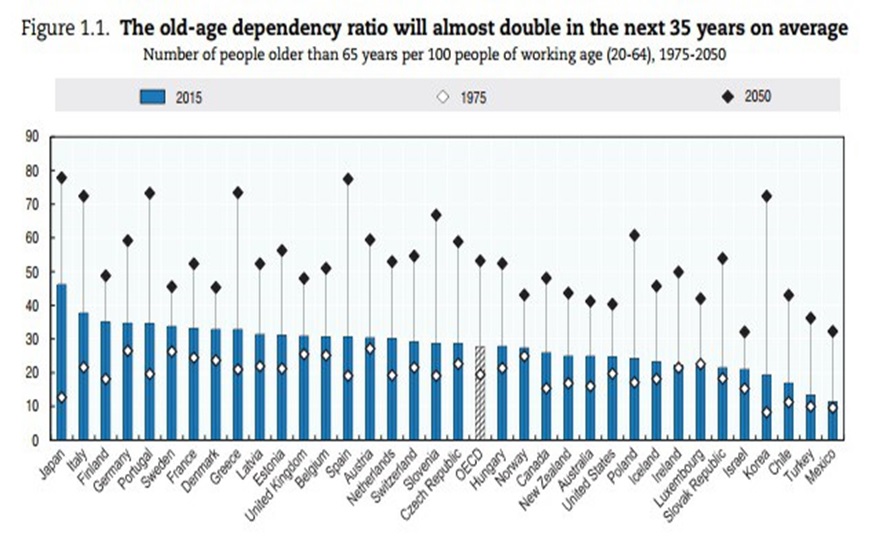
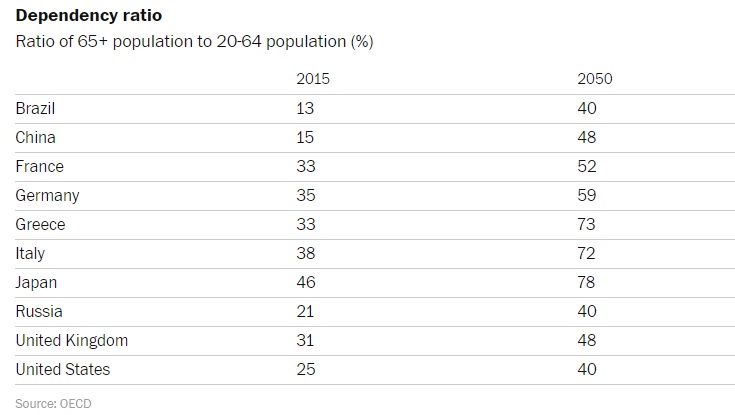
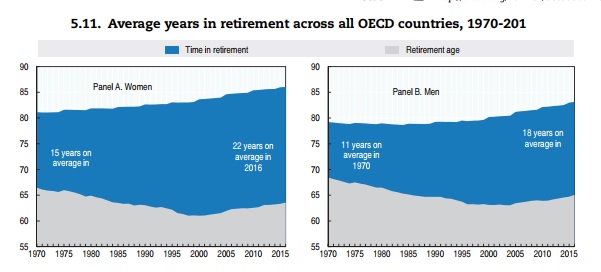
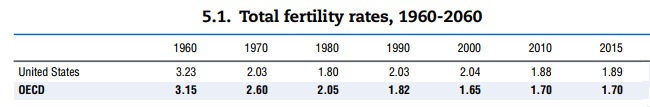
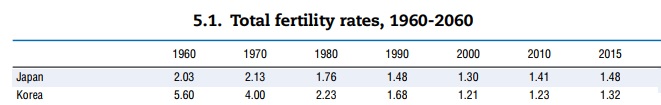
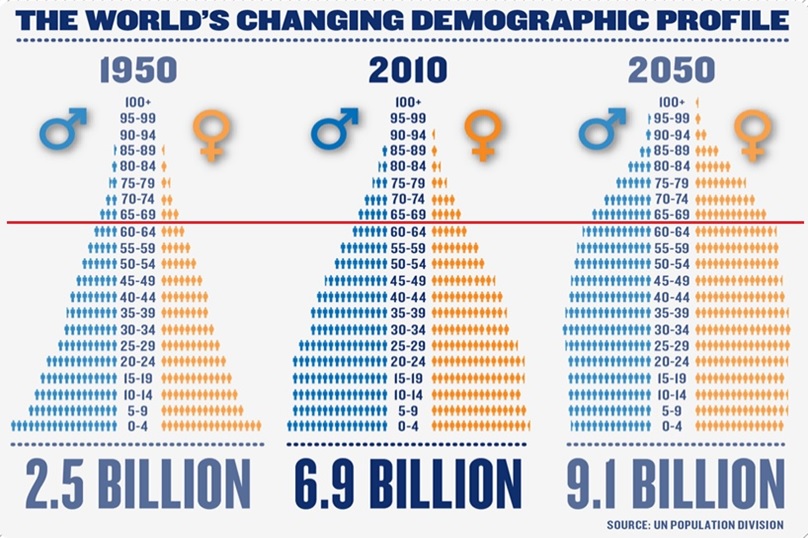
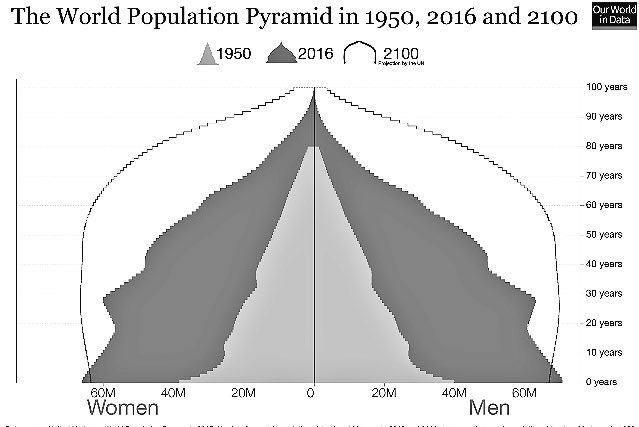
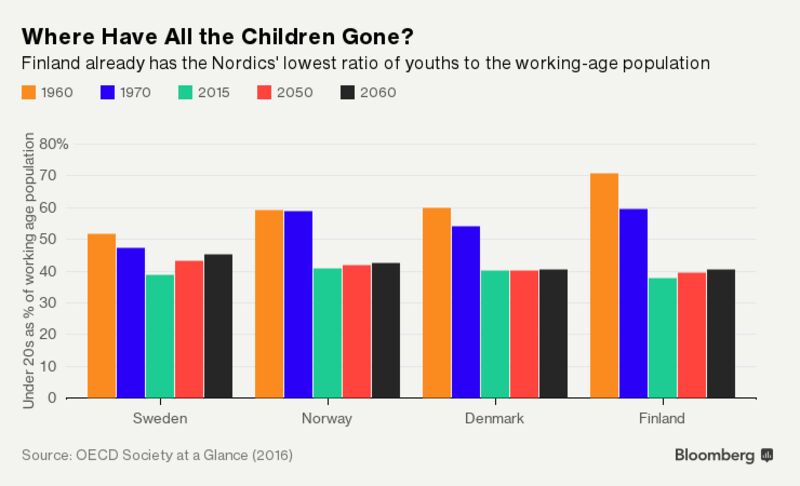
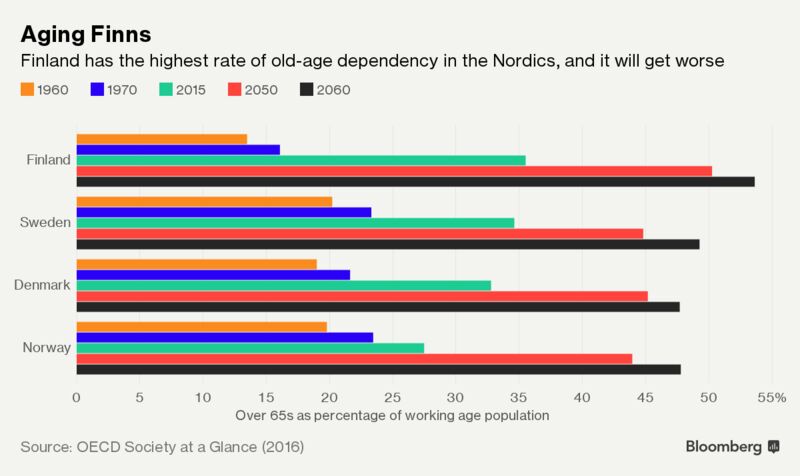
By the way, the article doesn’t even mention that South Korea faces a major demographic challenge.

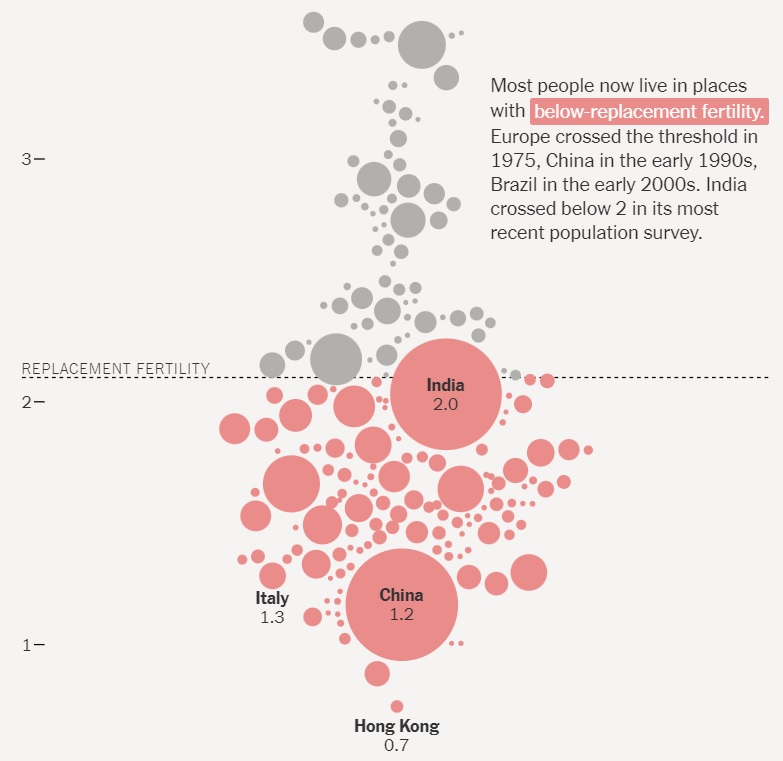
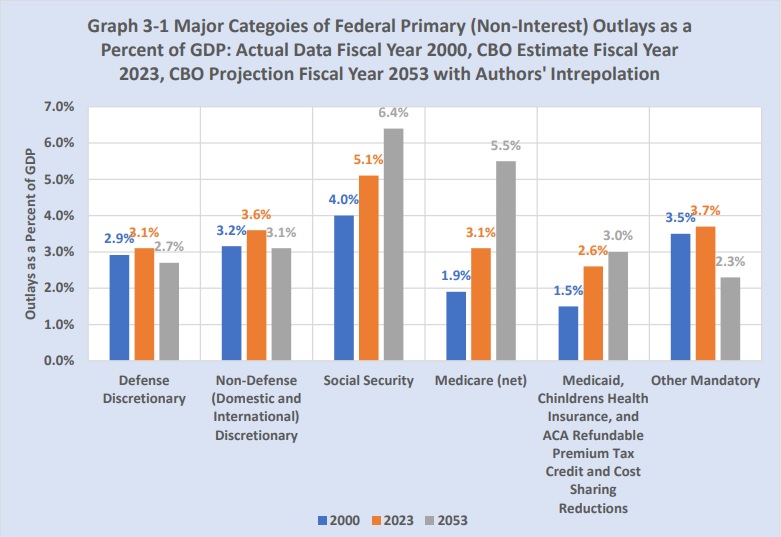
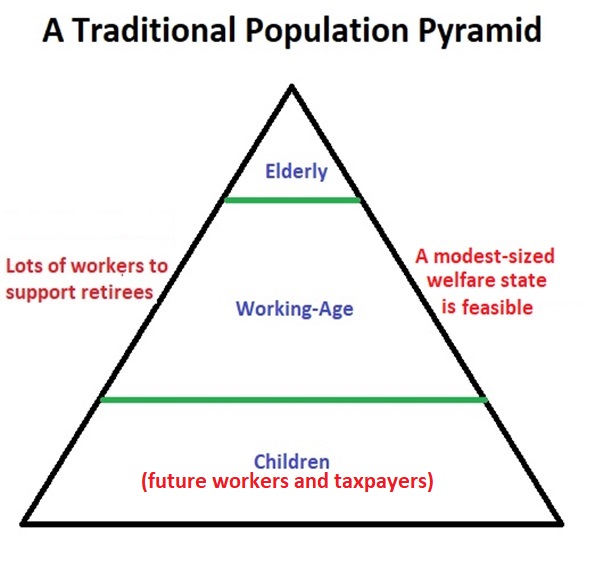
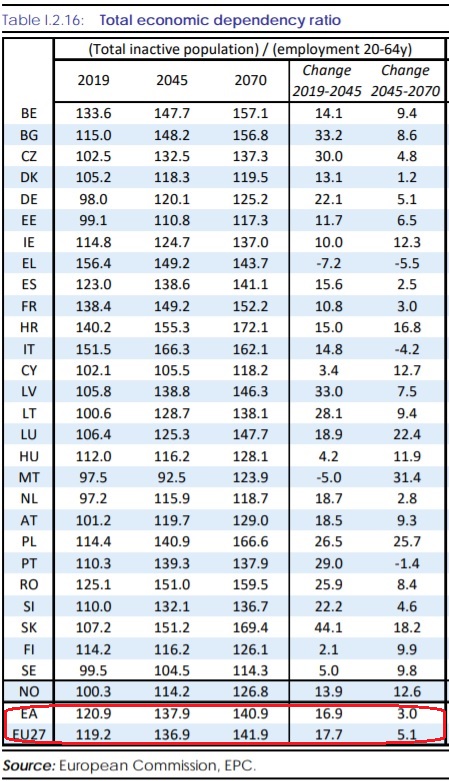
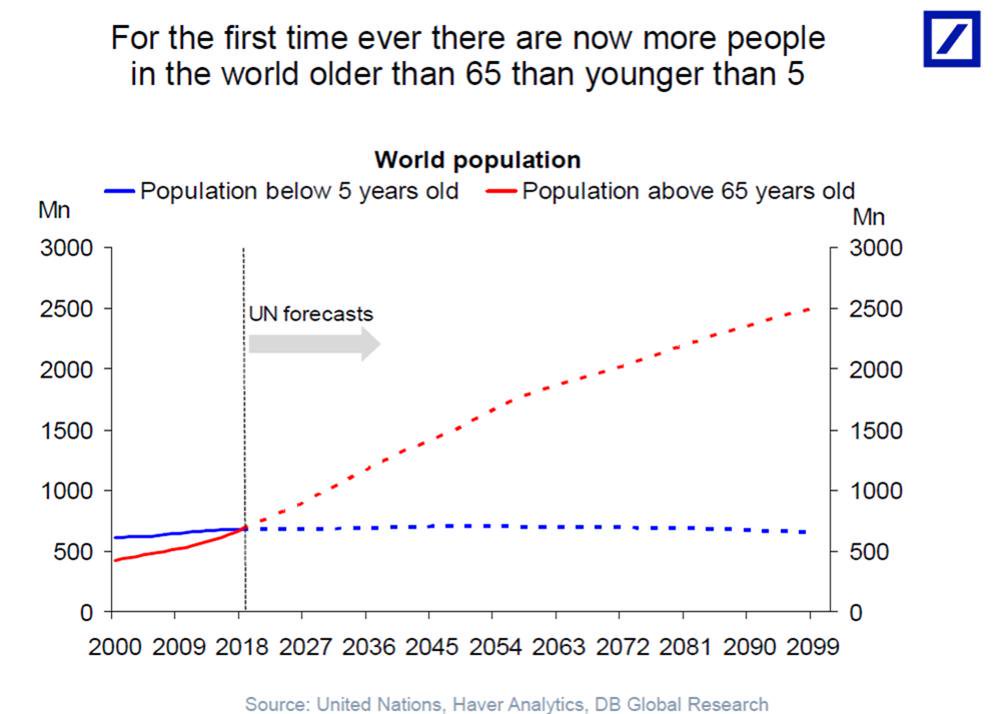
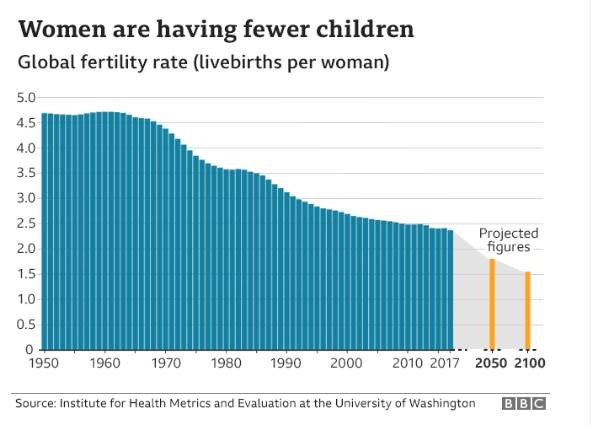
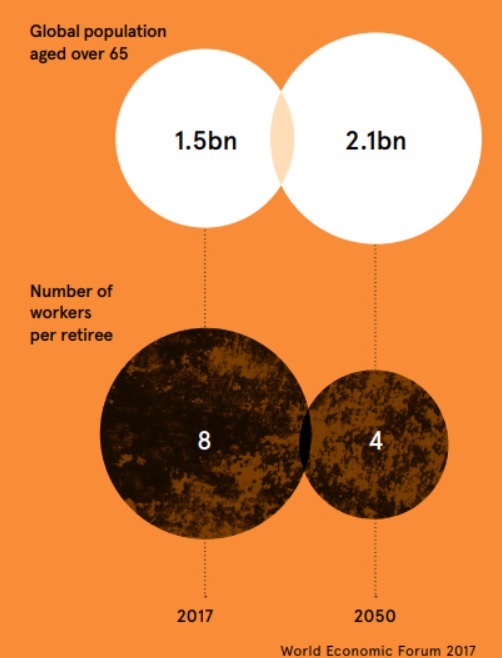
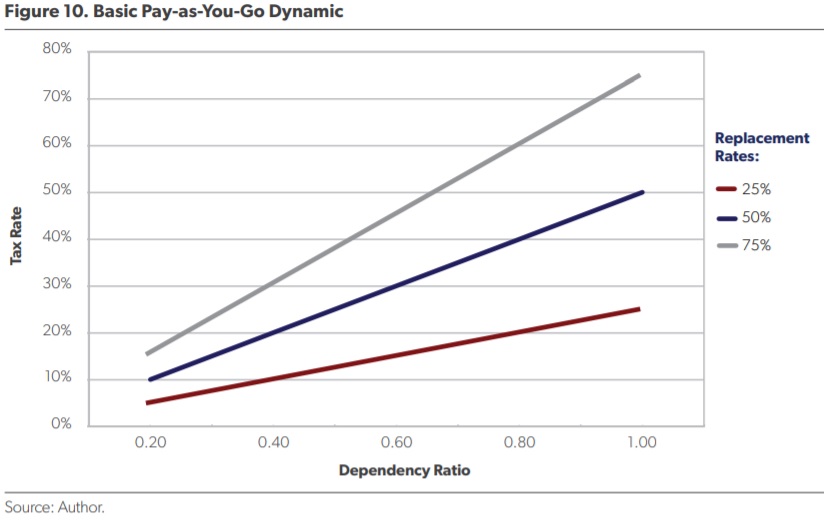
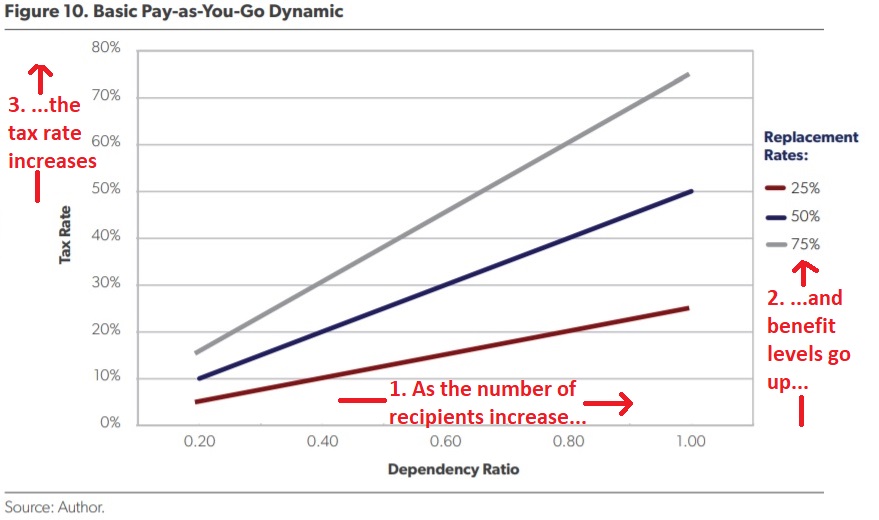
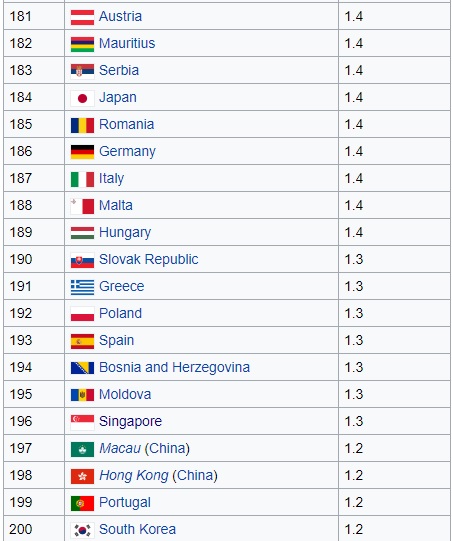
It has a catastrophically low fertility rate, which means that the tax-and-transfer welfare state will become increasingly unaffordable as the ratio of workers to recipients shifts in the wrong direction.

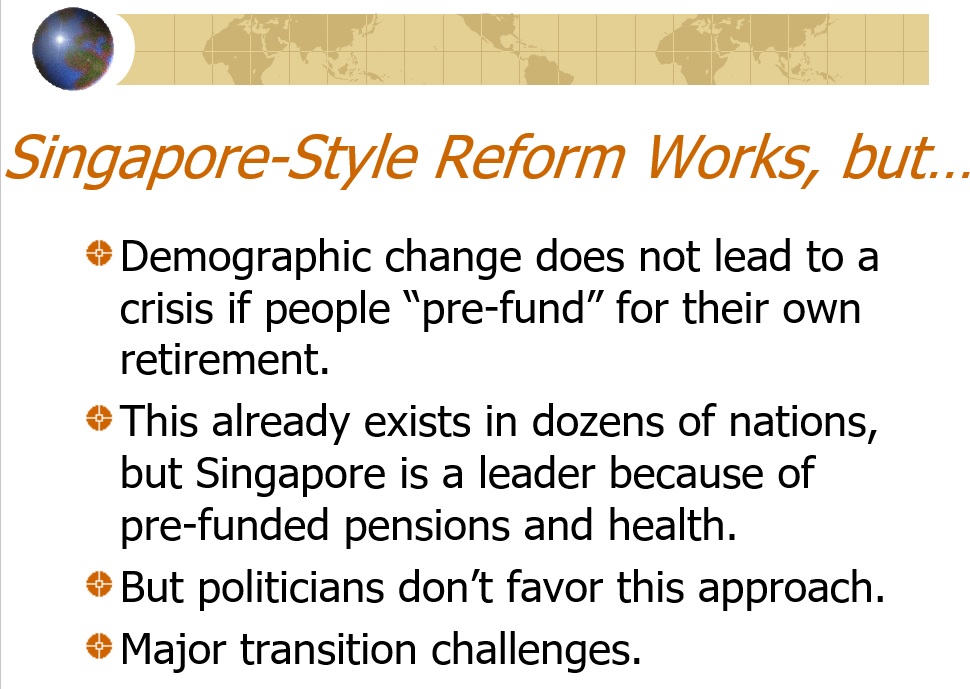
Entitlement reform is the sensible answer to this problem (see Hong Kong, for example).

But that’s obviously not happening under President Moon. Indeed, he wants to make matters worse by expanding the welfare state.

Some people in South Korea realize that demographics are a problem for their nation.

The U.K.-based Express looks at their attempted solution.

Seoul’s Dongguk and Kyung Hee universities say the courses on dating, sex, love and relationships target a generation which is shunning traditional family lives. …as part of the course, students have to date three classmates for a month each. …The course has expanded to Kyong Hee university, which offers “Love and Marriage” classes and Inha university in Incheon, a specialist engineering college, where students can now sign up to lessons on prioritising success and love. In 2016 the number of marriages hit its lowest since 1977, according to data from the government agency Statistics Korea. …The crude marriage rate – the annual number of marriages per 1,000 people – was 5.5 last year, compared with 295.1 when statistics began in 1970. Seoul has spent about £50 billion trying to boost the birth rate.

I’m skeptical of this approach, regardless of how much money the government spends.

Policy makers should focus instead on things they can control, such as fiscal policy and regulatory policy.

And this is why South Korea’s lurch to the left is so disappointing. Politicians are making things worse rather than better.

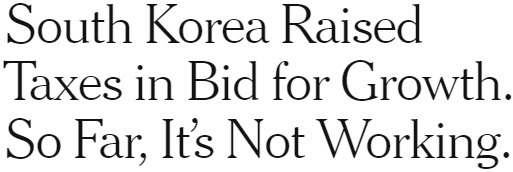
Even the New York Times is reporting that Moon’s statist agenda isn’t working.

Under President Moon Jae-in, South Korea has raised taxes and the minimum wage in the name of economic growth. So far, it hasn’t worked out as planned. Growth has slowed, unemployment has risen and small-business owners…are complaining. …With his progressive policies, President Moon is trying to tackle some of the same economic problems that plague the United States and much of the developed world. They include a widening wealth gap, slower growth and stagnant wages. …South Korea’s troubles suggest the limits of the state in solving economic problems, especially without addressing the underlying structural issues. …After his election in May 2017, Mr. Moon undertook a sharp shift in economic policy. He supported higher wages, tighter restrictions on working hours and greater welfare spending, funded by tax increases on companies and high-income earners. …Mr. Moon has paid a steep political price for his agenda. His approval rating has plummeted from 84 percent in mid-2017 to 45 percent in the most recent Gallup poll. …The 2019 budget represents the sharpest increase in spending in a decade… The minimum wage has also gone up again for 2019, by 11 percent.

More taxes, more spending, more regulation, and more intervention. Who does Moon think he is, Barack Obama or Richard Nixon?

On a serious note, it surely says something that even the New York Times is forced to acknowledge that statist policies backfire.

Let’s close by looking at how South Korea’s economic freedom score has evolved over time. As you can see, there was a lot of economic liberalization between 1975-2005. That’s the good news.

The bad news is that economic liberty has declined since the mid-2000s.

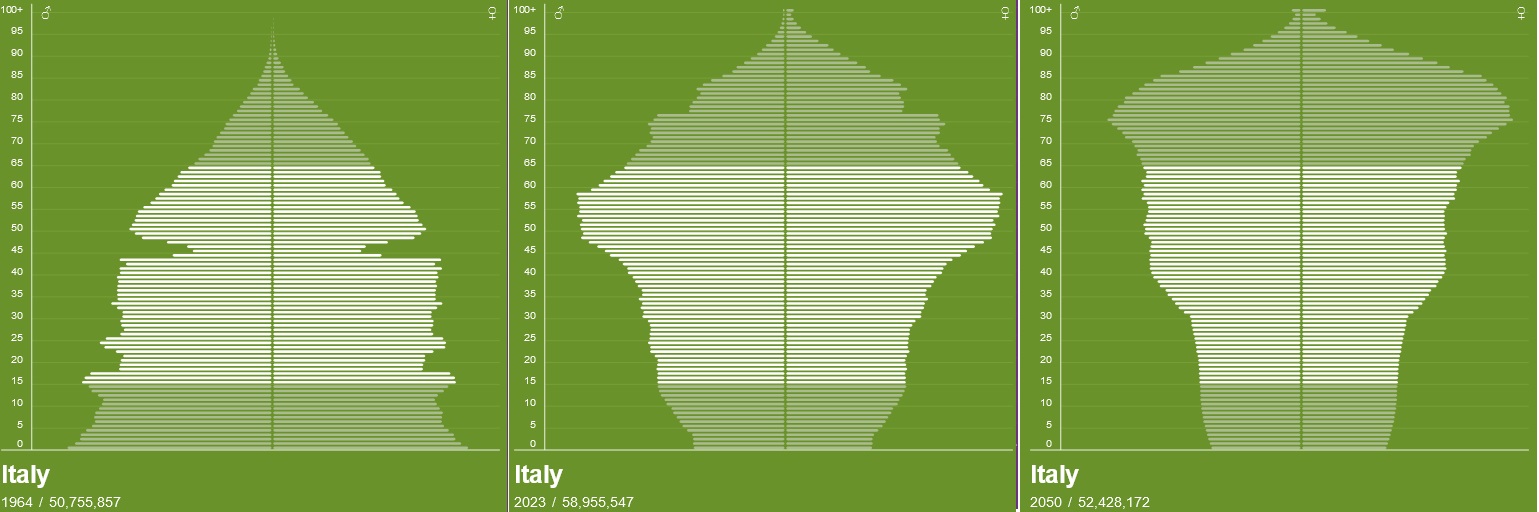
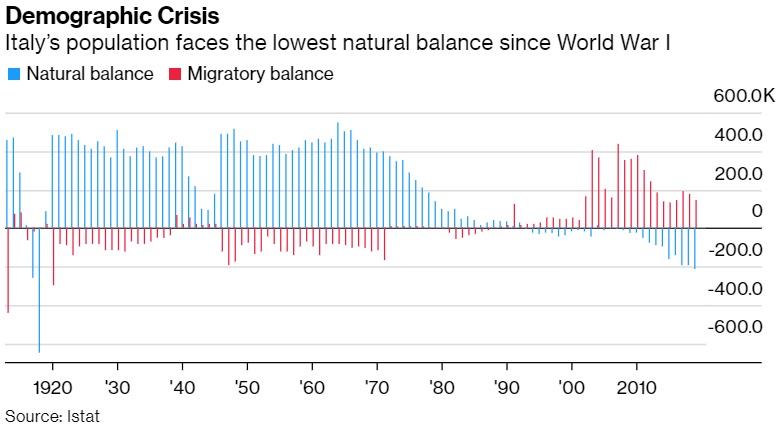
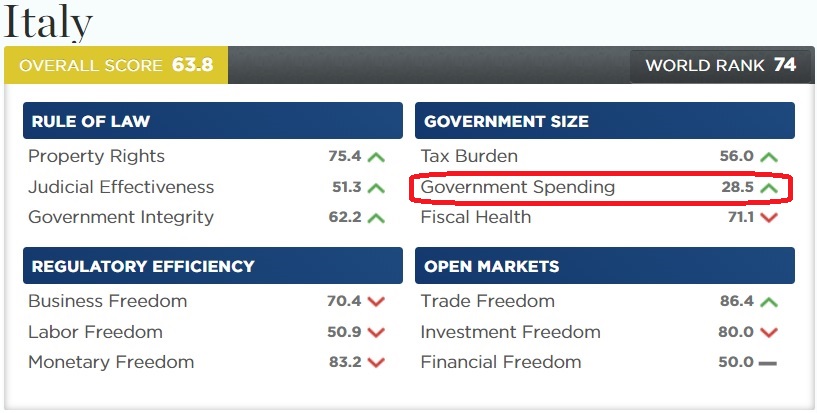
The drop is modest, at least in absolute terms. But it’s also important (as I explained when looking at Italy) to look at relative competitiveness.

South Korea’s current score of 7.53 isn’t that much lower than its 7.67 score in 2006. But that slight drop, along with pro-reforms steps that other nations have taken, means that South Korea is now ranked #35 instead of #20.

And the current scores are based on policy in 2016, before Moon moved South Korea in the direction of more statism. This doesn’t bode well.

P.S. I’m not expecting South Korea to become another Hong Kong or Singapore, but it should at least seek incremental progress rather than incremental deterioration. Taiwan is a good example of that approach.

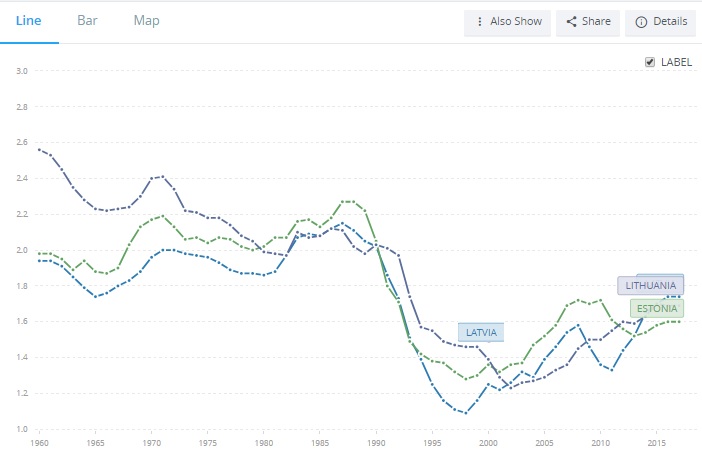
July 29, 2021 Addendum: Here’s a chart showing that both South Korea and Taiwan have easily out-performed the world average in recent decades.

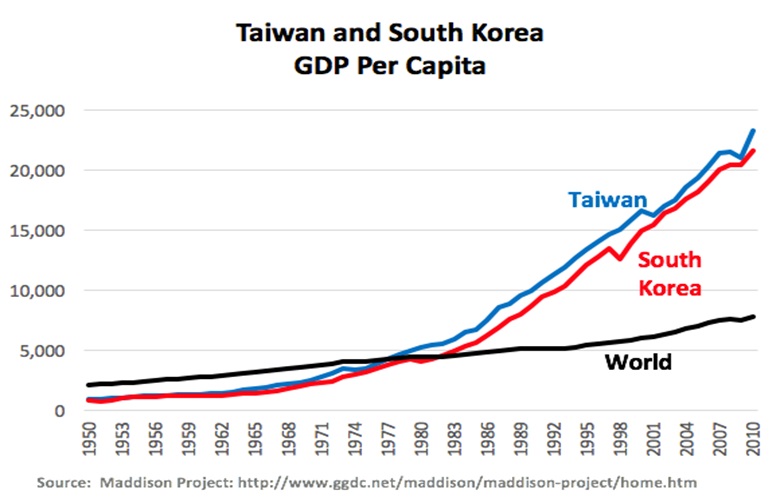
The key question, of course, is whether they will follow the right policies and get continued good performance in the future.

Read Full Post »

The world is in the middle of a dramatic demographic transition caused by increasing lifespans and falling birthrates.

One consequence of this change is that traditional tax-and-transfer, pay-as-you-go retirement schemes (such as Social Security in the United States) are basically bankrupt.

The problem is so acute that even the normally statist bureaucrats at the Organization for Economic Cooperation and Development are expressing considerable sympathy for reforms that would allow much greater reliance on private savings (shifting to what is known as “funded” systems).

Countries should introduce funded arrangements gradually… Policymakers should carefully assess the transition as it may put an additional, short-term, strain on public finances… Tax rules should be straightforward, stable and consistent across all retirement savings plans. …Countries with an “EET” tax regime should maintain the deferred taxation structure… Funded, private pensions may be expected to support broader economic growth and accelerate the development of local capital markets by creating a pool of pension savings that must be invested. The role of funded, private pensions in economic development is likely to become more important still as countries place a higher priority on the objective of labour force participation. Funded pensions increase the incentive to work and save and by encouraging older workers to stay in the labour market they can help to address concerns about the sustainability and adequacy of public PAYG pensions in the face of demographic changes.

Here’s a chart from the OECD report. It shows that many developed nations already have fully or partly privatized systems.

By the way, I corrected a glaring mistake. The OECD chart shows Australia as blue. I changed it to white since they have a fully private Social Security system Down Under.

The report highlights some of the secondary economic benefits of private systems.

Funded pensions offer a number of advantages compared to PAYG pensions. They provide stronger incentives to participate in the labor market and to save for retirement. They create a pool of savings that can be put to productive use in the broader economy. Increasing national savings or reallocating savings to longer-term investment supports the development of financial markets. …More domestic savings reduces dependency on foreign savings to finance necessary investment. Higher investment may lead to higher productive capacity, increasing GDP, wages and employment, higher tax revenues and lower deficits.

Here’s the chart showing that countries with private retirement systems are among the world leaders in pension assets.

The report highlights some of the specific nations and how they benefited.

Over the long term, transition costs may be at least partially offset by additional positive economic effects associated with introducing private pensions rather than relying solely on public provision. …poverty rates have declined in Australia, the Netherlands and Switzerland since mandatory funded pensions were introduced. The initial transformation of Poland’s public PAYG system into a multi-pillar DC approach helped to encourage Warsaw’s development as a financial centre. …the introduction of funded DC pensions in Chile encouraged the growth of financial markets and provided a source of domestic financing.

For those seeking additional information on national reforms, I’ve written about the following jurisdictions.

At some point, I also need to write about the Singaporean system, which is one of the reasons that nation is so successful.

P.S. Needless to say, it would be nice if the United States was added to this list at some point. Though I won’t be holding my breath for any progress while Trump is in the White House.

Read Full Post »

I wrote last month about a new book from the Fraser Institute about demographics and entrepreneurship.

My contribution was a chapter about the impact of taxation, especially the capital gains tax.

At a panel in Washington, I had a chance to discuss my findings.

If you don’t want to watch an 11-minute video, my presentation can be boiled down to four main points.

1. Demographics is destiny – Other authors actually had the responsibility of explaining in the book about the importance of demographic change. But it never hurts to remind people that this is a profound and baked-in-the-cake ticking time bomb.

So I shared this chart with the audience and emphasized that a modest-sized welfare state may have been feasible in the past, but will be far more burdensome in the future for the simple reason that the ratio of taxpayers to tax-consumers is dramatically changing.

And it goes without saying that big-sized welfare states are doomed to collapse. Think Greece and extend it to Italy, France, Japan, and other developed nations (including, I fear, the United States).

2. Entrepreneurship drives growth – Capital and labor are the two factors of production, but entrepreneurs are akin to the chefs who figure out news ways of mixing those ingredients.

For all intents and purposes, entrepreneurs produce the creative destruction that is a prerequisite for growth.

3. The tax code discourages entrepreneurship – The bulk of my presentation was dedicated to explaining that double taxation is both pervasive and harmful.

I shared my flowchart showing how the American tax code is biased against income that is saved and invest, which discourages entrepreneurial activity.

And then showed the capital gains tax burden in developed countries.

The U.S. is probably even worse than shown in the above chart since our capital gains tax is imposed on inflationary gains.

4. The United States need to be more competitive – Last but not least, I pointed out that America’s class-warfare tax policies are the fiscal equivalent of an “own goal” (soccer reference for World Cup fans).

And this chart from my chapter shows how the United States, as of mid-2016, had the highest combined tax rate on capital gains when including the effect of the capital gains tax.

That’s the bad news. The good news is that the Trump tax cuts did produce a lower corporate rate. So in the version below, I’ve added my back-of-the-envelope calculation of where the U.S. now ranks.

But the bottom line is still uncompetitive when looking at the tax burden on investment.

And never forget that this ultimately backfires against workers since it translates into lower pay.

P.S. The Wall Street Journal produced an excellent description of why capital gains taxation is very destructive.

Read Full Post »

I’ve written over and over again that changing demographics are a very under-appreciated economic development. I’ve also written about why entrepreneurship is a critical determinant of growth.

But I never thought of combining those topics. Fortunately, the folks at the Fraser Institute had the foresight to do just that, having just published a book entitled Demographics and Entrepreneurship: Mitigating the Effects of an Aging Population.

There are chapters on theory and evidence. There are chapters on specific issues, such as taxes, regulation, migration, financial markets, and education.

It’s basically the literary equivalent of one-stop-shopping. You’ll learn why you should be concerned about demographic change. More important, since there’s not much policy makers can do to impact birthrates, you’ll learn everything you need to know about the potential policy changes that could help nations adapt to aging populations.

This short video is an introduction to the topic.

Let’s look at just a few of the highlights of the book.

In the opening chapter, Robert Murphy offers a primer on the importance of entrepreneurship.

…there is a crucial connection between entrepreneurship and economic prosperity. …There is a growing recognition that a society’s economic prosperity depends…specifically on entrepreneurship. …Two of the top names associated with the theory of entrepreneurship are Joseph Schumpeter and Israel Kirzner… Schumpeter famously invoked the term “creative destruction” to describe the volatile development occurring in a capitalist system… Kirzner has written extensively on entrepreneurship…and how…the alert entrepreneurial class who perceive these misallocations before their more complacent peers, and in the process earn pure profits… Schumpeter’s entrepreneur is a disruptor who creates new products first in his mind and then makes them a reality, whereas Kirzner’s entrepreneur is a coordinator who simply observes the profit opportunities waiting to be grasped. …If the goal is maximum economic efficiency in the long run, to provide the highest possible standard of living to citizens within the unavoidable constraints imposed by nature, then we need bold, innovative entrepreneurs who disrupt existing modes of production by introducing entirely new goods and services, but we also need vigilant, alert entrepreneurs who spot arbitrage opportunities in the existing price structure and quickly move to whittle them away.

Murphy describes in the chapter how there was a period of time when the economics profession didn’t properly appreciate the vital role of entrepreneurs.

But that fortunately has changed and academics are now paying closer attention. He cites some of the recent research.

An extensive literature documents the connection between entrepreneurship and economic growth. The studies vary in terms of the specific measure of entrepreneurship (e.g., small firms, self-employment rate, young firms, etc.) and the size of the economic unit being studied. …Carree et al. (2002) look at 23 OECD countries from 1976 to 1996. …They “find confirmation for the hypothesized economic growth penalty on deviations from the equilibrium rate of business ownership… An important policy implication of our exercises is that low barriers to entry and exit of businesses are necessary conditions for the equilibrium seeking mechanisms that are vital for a sound economic development” …Holtz-Eakin and Kao (2003) look at the birth and death rates of firms across US states, and find that this proxy for entrepreneurship contributes to growth. Similarly, Callejón and Segarra (1999) look at manufacturing firm birth and death rates in Spain from 1980 to 1992, and conclude that this measure of “turbulence” contributes to total factor productivity growth. …Wennekers and Thurik (1999) use business ownership rates as a proxy for “entrepreneurship.” Looking at a sample of 23 OECD countries from 1984 to 1994, they, too, find that entrepreneurship was associated with higher rates of employment growth at the national level.

In a chapter on taxation, Seth Giertz highlights the negative impact of taxes on entrepreneurship, particularly what happens with tax regimes have a bias against saving and investment.

High tax rates discourage both consumption and savings. But, for a given average tax rate, taxes on an income base penalize savings more heavily than taxes on consumption. …a consumption tax base is neutral between the decision to save versus consume. By contrast, an income tax base results in the double taxation of savings. …three major features of tax policy that are important for entrepreneurship. First, capital accumulation and access to capital is essential for innovation to have a big impact. Despite this, tax systems generally tax savings more heavily than consumption….Second, the tax treatment of risk affects incentives for entrepreneurship, since entrepreneurship tends to entail high risk. …progressivity can sometimes discourage entrepreneurship. This is because tax systems do not afford full offsets for losses, making progressivity effectively a tax increase. …Third, tax policy can lead entrepreneurial activity to shift from productive toward unproductive or destructive aims. Productive entrepreneurship tends to flourish when the route to great wealth is achieved primarily through private markets… High taxes reduce the rewards from productive entrepreneurship. All too often, smart, talented, and innovative people are drawn out of socially productive endeavours and into unproductive ones because the private returns from devising an innovative tax scheme—or lobbying government for special tax preferences—are greater than those for building the proverbial better mousetrap.

In a chapter I co-authored with Brian Garst, Charles Lammam, and Taylor Jackson, we look specifically at the negative impact of capital gains taxation on entrepreneurship.

We spend a bit of time reminding readers of what drives growth.

One of the more uncontroversial propositions in economics is that output is a function of labor (the workforce) and capital (machines, technology, land, etc.). Indeed, it is almost a tautology to say that growth exists when people provide more labor or more capital to the economy, or when—thanks to vital role of entrepreneurs—labor and capital are allocated more productively. In other words, labor and capital are the two “factors of production,” and the key for policymakers is to figure out the policy recipe that will increase the quantity and quality of those two resources. …In the absence of taxation, people provide labor to the economy so long as they value the income they earn more than they value the foregone leisure. And they provide capital to the economy (i.e., they save and invest) so long as they value future consumption (presumably augmented by earnings on capital) more than they value current consumption.

And we highlight how entrepreneurs generate the best type of growth.

this discussion also helps illustrate why entrepreneurship is so important. The preceding analysis basically focused on achieving growth by increasing the quantity of capital and labor. Such growth is real, but it has significant “opportunity costs” in that people must forego leisure and/or current consumption in order to have more disposable income. Entrepreneurs, by contrast, figure out how to increase the quality of capital and labor. More specifically, entrepreneurs earn profits by satisfying consumer desires with new and previously unknown or underused combinations of labor and capital. In their pursuit of profit, they come up with ways of generating more or better output from the same amount of labor and capital. This explains why we have much higher living standards today even though we work far fewer hours than our ancestors.

And here’s what we say about the counterproductive impact of capital gains taxation, particularly when combined with other forms of double taxation.

…the effective marginal tax rate on saving and investment is considerably higher than the effective marginal tax rate on consumption. This double taxation is understandably controversial since all economic theories—even Marxism and socialism—agree that capital is critical for long-run growth and higher living standards. …capital gains taxes harm economies in ways unique to the levy. …entrepreneurs play a vital role in the economy since they figure out more efficient ways to allocate labor and capital. …The potential for a capital gain is a big reason for the risk they incur and the effort they expend. Thus, the existence of capital gains taxes discourages some entrepreneurial activity from ever happening. …the capital gains tax is more easily avoidable than other forms of taxation. Entrepreneurs who generate wealth with good ideas can avoid the levy by simply choosing not to sell. This “lock-in effect” is not good for the overall economy… Most governments do not allow taxpayers to adjust the value of property for inflation when calculating capital gains. Even in a low-inflation environment, this can produce perverse results. …taxpayers can sometimes pay tax even when assets have lost value in real terms. …Capital gains taxes contribute to the problem of “debt bias,” which occurs when there is a tax advantage for corporate investments to be financed by debt instead of equity. …Excessive debt increases the probability of bankruptcy for the firm and contributes to systemic risk.

We then cite a lot of academic studies. I strongly encourage folks to peruse that section, but to keep this column manageable, let’s close by looking at two charts that reveal how some nation – including the United States – have uncompetitive tax systems.

Here are long-run capital gains tax rates in developed nations.

By the way, even though the data comes from a 2018 OECD report, it shows tax rates as of July 1, 2016. So not all the numbers will be current. For instance, I assume Macron’s reforms have mitigated France’s horrible score.

Speaking of horrible scores, here are the numbers showing the combined burden of the corporate income tax and capital gains tax. Sadly, the United States was at the top of this list as of July 1, 2016.

The good news is that the recent tax reform means that the United States no longer has the world’s most punitive tax system for new investment.

Though keep in mind that the United States doesn’t allow investors to index capital gains for inflation, so the effective tax rate on capital gains will always be higher than the statutory tax rate.

Read Full Post »

Given Social Security’s enormous long-run financial problems, the program eventually will need reform.

But what should be done? Some folks on the left, such as Barack Obama and Hillary Clinton, support huge tax increases to prop up the program. Such an approach would have a very negative impact on the economy and, because of built-in demographic changes, would merely delay the program’s bankruptcy.

Others want a combination of tax increases and benefit cuts. This pay-more-get-less approach is somewhat more rational, but it means that today’s workers would get a really bad deal from Social Security.

This is why I frequently point out that personal retirement accounts (i.e., a “funded” system based on real savings) are the best long-run solution. And to help the crowd in Washington understand why this is the best approach, I explain that dozens of nations already have adopted this type of reform. And I’ve written about the good results in some of these jurisdictions.

Now it’s time to add Sweden to the list.

I actually first wrote about the Swedish reform almost 20 years ago, in a study for the Heritage Foundation co-authored with an expert from Sweden. Here’s some of what we said about the nation’s partial privatization.

Swedish policymakers decided that both individual workers and the overall economy would benefit if the old-age system were partially privatized. …Workers can invest 2.5 percentage points of the 18.5 percent of their income that they must set aside for retirement. …the larger part-16 percent of payroll-goes to the government portion of the program. …What makes the government pay-as-you-go portion of the pension program unique, however, is the formula used for calculating an individual’s future retirement benefits. Each worker’s 16 percent payroll tax is credited to an individual account, although the accounts are notional. …the government uses the money in these notional accounts to calculate an annuity (annual retirement benefit) for the worker. …the longer a worker stays in the workforce, the larger the annuity received. This reform is expected to discourage workers from retiring early… There are many benefits to Sweden’s new system, including greater incentives to work, increased national savings, a flexible retirement age, lower taxes and less government spending.

While that study holds up very well, let’s look at more recent research so we can see how the Swedish system has performed.

I’m a big fan of the fully privatized portion of the Swedish system (the “premium pension”) funded by the 2.5 percent of payroll that goes to personal accounts.

But let’s first highlight the very good reform of the government’s portion of the retirement system. It’s still a tax-and-transfer scheme, but there are “notional” accounts, which means that benefits for retirees are now tied to how much they work and how much they pay into the system.

A new study for the American Enterprise Institute, authored by James Capretta, explains the benefits of this approach.

Sweden enacted a reform of its public pension system that combines a defined-contribution approach with a traditional pay-as-you-go financing structure. The new system includes better work incentives and is more transparent to participants. It is also permanently solvent due to provisions that automatically adjust payouts based on shifting demographic and economic factors. …A primary objective…in Sweden was to build a new system that would be solvent permanently within a fixed overall contribution rate. …pension benefits are calculated based on notional accounts, which are credited with 16.0 percent of workers’ creditable wages. …The pensions workers get in retirement are tied directly to the amount of contributions they make to the system. …This design improved incentives for work… To keep the system in balance, this rate of return is subject to adjustment, to correct for shifts in demographic and economic factors that affect what rate of return can be paid within the fixed budget constraint of a 16.0 percent contribution rate.

The final part of the above excerpts is key. The system automatically adjusts, thus presumably averting the danger of future tax hikes.

Now let’s look at some background on the privatized portion of the new system. Here’s a good explanation in a working paper from the Center for Fiscal Studies at Sweden’s Uppsala University.

The Premium Pension was created mainly for three purposes. Firstly, funded individual accounts were believed to increase overall savings in Sweden. …Secondly, the policy makers wanted to allow participants to take account of the higher return in the capital markets as well as to tailor part of their pension to their risk preferences. Finally, an FDC scheme is inherently immune against financial instability, as an individual’s pension benefit is directly financed by her past accumulated contributions. The first investment selections in the Premium Pension plan took place in the fall of 2000, which is known as the “Big Bang” in Sweden’s financial sector. …any fund company licensed to do business in Sweden is allowed to participate in the system, but must first sign a contract with the Swedish Pensions Agency that specifies reporting requirements and the fee structure. Benefits in the Premium Pension Plan are paid out annually and can be withdrawn from age 61.

And here’s a chart from the Swedish Pension Agency’s annual report showing that pension assets are growing rapidly (right axis), in part because “premium pension has provided a 6.7 percent average value increase in people’s pensions per year since its launch.” Moreover, administrative costs (left axis) are continuously falling. Both trends are very good news for workers.

Let’s close by citing another passage from Capretta’s AEI study.

He looks at Sweden’s long-run fiscal outlook to other major European economies.

According to European Union projections, Sweden’s total public pension obligations will equal 7.5 percent of GDP in 2060, which is a substantial reduction from the…8.9 percent of GDP it spent in 2013. …In 2060, EU countries are expected to spend 11.2 percent of GDP on pensions. Germany’s public pension spending is projected to increase…to 12.7 percent of GDP in 2060. …The EU forecast shows France’s pension obligations will be 12.1 percent of GDP in 2060 and Italy’s will be 13.8 percent of GDP.

I think 8.9 percent of GDP is still far too high, but it’s better than diverting 11 percent, 12 percent, or 13 percent of economic output to pensions.

And the fiscal burden of Sweden’s system could fall even more if lawmakers allowed workers to shift a greater share of their payroll taxes to personal accounts.

But any journey begins with a first step. Sweden moved in the right direction. The United States could learn from that successful experience.

P.S. Pension reform is just the tip of the iceberg. As I wrote two years ago, Sweden has implemented a wide range of pro-market reforms over the past few decades, including some very impressive spending restraint in the 1990s. If you’re interested in more information about these changes, check out Lotta Moberg’s video and Johan Norberg’s video.

Read Full Post »

I wrote yesterday about “the world’s demographic problem,” citing a new study about the fiscal implications of aging populations. The report was produced by the Organization for Economic Cooperation and Development, which is not my favorite international bureaucracy when they make policy recommendations, but I’ll be the first to admit that the bureaucrats produce some useful statistics and interesting reports.

To be succinct, the basic message of the study is that developed nations (the U.S., Europe, Asia, etc) face a demographic nightmare of increased longevity and falling birthrates.

It’s good that people are living longer, of course, and there’s nothing wrong with people choosing to have fewer kids. But since most governments maintain tax-and-transfer entitlement programs, the OECD report basically warns that those demographic changes have some very grim fiscal implications. In other words, the world’s demographic shift is actually a policy problem.

That’s the bad news.

The good news is that there’s a policy solution.

The aforementioned OECD study (which can be accessed here) is a survey of how retirement income is provided in key nations. So in addition to grim information about fiscally unstable government-run retirement systems we looked at yesterday, the report also has data about the nations that rely – at least to some degree – on private savings.

Let’s start with this helpful flowchart in the report. It illustrates that there are three approaches for the provision of retirement income. The first tier is government-run programs such as the U.S. Social Security system and the third tier is voluntary savings such as IRAs and 401(k)s in America.

For today’s discussion, let’s focus on the second tier. These are the systems that are “funded” with mandatory savings.

And I highlighted (in green) the two private options. In a “defined contribution” system, retirement income is determined by how much is saved and how well it is invested. Workers accumulate a big nest egg and then choose how to spend the money when retired. In a “defined benefit” system, workers are promised a pre-determined level of retirement income and the managers of their pension funds are expected to ensure that enough money will be available.

Yes, public options based on real savings do exist. And they presumably are better than the pay-as-you-go, tax-and-transfer schemes found in the first tier. But it’s also the case that these systems (such as pension funds for state and local bureaucrats) generally don’t work very well.

So now let’s look at another table from the OECD report. It shows nations that have some degree of mandatory private retirement savings, either defined contribution (highlighted in red) or defined benefit (highlighted in yellow). As you can see, there actually are a lot of “privatized” systems.

I’ve actually written about many of these systems, especially the ones in Australia and Chile.

And I have very recent columns on the Dutch and Swiss systems.

A common theme in these columns is that government-run systems are very risky because workers are at the mercy of politicians, who are great at making extravagant promises. But huge unfunded liabilities show that they’re not very good at delivering on those promises.

Nations with funded systems, by contrast, accumulate private savings. That’s not only good for workers, but it’s very beneficial for national economies.

This table from the OECD report shows that Americans and Canadians have managed to save a lot of money, but all of the other nations with pension assets of more than 100 percent of GDP have mandatory funded systems.

When I talk about how the United States would benefit by moving to a private retirement system, people sometimes say it sounds too good to be true.

That’s obviously not the case since other nations have very successful private systems. But there is a catch, as I acknowledged in 2015.

…a big challenge for real Social Security reform is the “transition cost” of financing promised benefits to current retirees and older workers when younger workers are allowed to shift their payroll taxes to personal accounts. Dealing with this challenge presumably means more borrowing over the next few decades.

The appropriate analogy is that shifting to private retirement accounts for younger workers (while protecting current retirees and older workers) would be like refinancing a mortgage. The short-run costs might be higher, but that temporary burden is overwhelmed by the long-run savings. That’s a good deal, at least if the goal is fiscal stability and secure retirement.

Or we can stay with the current approach and become another Greece.

P.S. Social Security reform is especially beneficial for blacks and other minorities.

P.P.S. There is some risk with personal retirement accounts. But I’m not talking about the implications of a falling stock market crash (even a horrible crash would be offset by decades of compounding earnings). Instead, I’m referring to the possibility that future politicians might simply confiscate the money.

Read Full Post »

I gave a speech last night at the University of Texas Arlington on the topic of “Is America turning into Greece? How the growth of government and debt risk creating a dismal future for young Americans.”

Not a very succinct title, I realize, but I wanted to warn students that they are the ones who will suffer if today’s politicians fail to enact genuine entitlement reform. And since I told them I wasn’t expecting reform with Trump in the White House, my message was rather gloomy.

My only good news is that I told students that nations such as Italy, Japan, and France likely would suffer fiscal crises before the you-know-what hit the fan in America.

Though it would have been better if my speech was today. I could have cited this Robert Samuelson column from the Washington Post.

No one can say we weren’t warned. For years, scholars of all shapes and sizes — demographers, economists, political scientists — have cautioned that the populations of most advanced countries are gradually getting older, with dramatic consequences for economics and politics. But we haven’t taken heed by preparing for an unavoidable future. The “we” refers not just to the United States but to virtually all advanced societies. In fact, America’s aging, though substantial, is relatively modest compared with that of many European countries and Japan. …The problem is simple. Low birth rates and increasing life expectancies result in aging populations. Since 1970, average life expectancy at age 60 in OECD countries has risen from 18 years to 23.4 years; by 2050, it’s forecast to increase to 27.9 years — that is, to nearly 90. The costs of Social Security and pensions will explode. …The implication: Unless retirement ages are raised sharply or benefits are cut deeply, more and more of the income of the working-age population will be siphoned off through higher taxes or cuts in other government spending to support retirees.

Here’s a table from the article that shows the radical erosion in the age-dependency ratio for selected nations. To give you an idea what the numbers mean, a ratio of 33 (Greece today) means that each worker is supporting one-third of a retiree while a ratio of 73 (Greece in 2050) means that each worker is supporting three-fourths of a retiree.

The Greek numbers are grim, of course, and Italy and Japan are also in very bad shape.

And it’s worth noting that the ratio in China will rapidly deteriorate.

An article in New Scientist makes a similar observation about dramatic demographic change.

Could the population bomb be about to go off in the most unexpected way? Rather than a Malthusian meltdown, could we instead be on the verge of a demographic implosion? To find out how and why, go to Japan, where a recent survey found that people are giving up on sex. Despite a life expectancy of 85 and rising, the number of Japanese is falling thanks to a fertility rate of just 1.4 children per woman… Half the world’s nations have fertility rates below the replacement level of just over two children per woman. Countries across Europe and the Far East are teetering on a demographic cliff, with rates below 1.5. On recent trends, Germany and Italy could see their populations halve within the next 60 years.

The most sobering information is contained in a new report from my “friends” at the Organization for Economic Cooperation and Development. I’m definitely not a fan of the OECD’s policy work, but it does a good job of collecting apples-to-apples data.

Let’s start with the OECD’s calculations of how the old-age dependency ratio will change in various nations.

It’s not good to have a very tall black line in Figure 1.1, so we can confirm the bad news about Italy, Greece, and Japan. But note that Spain, Portugal, and South Korea also face a grim future. Simply stated, tomorrow’s workers will face an enormous burden.

There are two reasons for these grim numbers.

First, we’re living longer. That’s good news for us, but it’s bad news for the sustainability of tax-and-transfer entitlement programs (i.e., this partially explains why Social Security in the U.S. has a $44 trillion shortfall).

This chart shows that increasing longevity is a big reason why both men and women are spending more years in retirement (though there’s a glimmer of good news since the data shows that we’re no longer retiring at ever-younger ages).

In addition to living longer, we’re also having fewer kids.

This is a big deal because more babies today mean more future taxpayers.

But you can see from this table that birthrates have declined in America, as well as in other developed nations (keep in mind that a fertility rate of 2.1 is needed to keep the native-born population from shrinking).

Even more shocking, check out the demographic data for Japan and South Korea. Birth rates in Japan already had fallen by 1960 and they’re even lower today. But the numbers for South Korea are staggering.

Wow.

I guess it’s now easy to understand this story from South Korea.

Students at two South Korean universities are being offering courses that make it mandatory for them to date their classmates as the country battles to reverse one of the lowest birth rates in the world. Seoul’s Dongguk and Kyung Hee universities say the courses on dating, sex, love and relationships target a generation which is shunning traditional family lives. …She said: ”Korea’s fall in population has made dating and marriage important but young Koreans are too busy these days and clumsy in making new acquaintances.” And as part of the course, students have to date three classmates for a month… Seoul has spent about £50 billion trying to boost the birth rate.

I don’t know what’s the strangest part of the article, the part about having to date your classmates as part of homework (do you get extra credit if the girl gets pregnant?!?) or the part about the government squandering an astounding 50 billion pounds (about 67 billion dollars) on trying to encourage kids (I guess politicians never learn).

Or this story from Japan that brings back painful memories of high school.

Talk about a shrinking population. A survey of Japanese people aged 18 to 34 found that almost 70 percent of unmarried men and 60 percent of unmarried women are not in a relationship. Moreover, many of them have never got close and cuddly. Around 42 percent of the men and 44.2 percent of the women admitted they were virgins. The government won’t be pleased that sexlessness is becoming as Japanese as sumo and sake. The administration of Prime Minister Shinzo Abe has talked up boosting the birthrate through support for child care, but until the nation bones up on bedroom gymnastics there’ll be no medals to hand out. …Boosting the birthrate is one of the coveted goals of the Abe administration, which has declared it will raise the fertility rate from the current 1.4 to 1.8 by 2025 or so.

The bottom line, as Samuelson suggested in his column, is that western nations are facing a baked-in-the-cake demographic-fiscal crisis.

What’s sad is that we know the crisis will happen, but politicians in most nations have no intention of solving the problems.

Read Full Post »

Imagine that we’re in a parallel universe and that you’re the lookout on the Titanic. But in this make-believe world, you have all sorts of fancy radar that allows you to detect icebergs with lots of advance notice. Furthermore, imagine that you detect danger and give lots of warning to the Captain and other officers.

How would you feel if they then decided to ignore your warnings and continued on their course to disaster? You’d probably tear your hair out in frustration.

And that’s a pretty good description of how I feel about the easy-to-predict, visible-to-the-naked-eye, baked-in-the-cake, bound-to-happen fiscal crisis that will occur because of the combination of demographic change and poorly designed entitlement programs.

It’s happening in the United States. It’s happening in Europe. It’s happening in Asia. Heck, this is a worldwide problem.

Simply stated, welfare states were created back when everyone assumed that there would always be a “population pyramid,” which means relatively few old people (who collect a lot of money from entitlement programs) at the top, plenty of workers (also known as taxpayers) in the middle, and lots of children (i.e., future taxpayers) at the bottom.

In that world, a modest-sized welfare state isn’t a good idea, but at least it is mathematically sustainable.

Today, by contrast, such a welfare state is a problem because we’re living longer and having fewer children.

And in the future, that kind of welfare state is a recipe for a Greek-style fiscal crisis because demographic trends will be even less favorable. To be blunt, there won’t be enough people pulling the wagon compared to the mass of people riding in the wagon.

At the risk of beating a dead horse, here’s some additional data on this global problem. We’ll start with this look at how the population pyramid is becoming a population cylinder. The key thing to notice is the growth of the over-65 cohort.

And here’s a different way of looking at the same data, but stretching out to 2100.

I didn’t add a red line at age 65, but it’s easy to see that the number of older people will dramatically increase without a concomitant increase in the number of working-age people who are expected to pay the taxes to finance pensions and health care.

So what’s all this mean? Here’s a sobering thought from Prospect.

The ageing populations of the advanced economies and the larger emerging ones combines with past falls in the birth rate to mean that the share of total world population who are of prime working age has been falling since 2012. After a four-decade rise, the trend has reversed with that fall projected to last throughout the 2020s, 2030s and 2040s. A slower-growing global workforce will be a big challenge for the global economy.

A “big challenge” may win the prize for understatement.

Bloomberg has a column on the implications of this massive demographic shift. Notice the data on the number of workers per retiree in various nations.

Rising dependency ratios — or the number of retirees per employed worker — provide one useful metric. In 1970, in the U.S., there were 5.3 workers for every retired person. By 2010 this had fallen to 4.5, and it’s expected to decline to 2.6 by 2050. In Germany, the number of workers per retiree will decrease to 1.6 in 2050, down from 4.1 in 1970. In Japan, the oldest society to have ever existed, the ratio will decrease to 1.2 in 2050, from 8.5 in 1970. Even as spending commitments grow, in other words, there will be fewer and fewer productive adults around to fund them.

The bottom line is that there are enormous unfunded liabilities.

Arnaud Mares of Morgan Stanley analyzed national solvency, or the difference between actual and potential government revenue, on one hand, and existing debt levels and future commitments on the other. The study found that by this measure the net worth of the U.S. was negative 800 percent of its GDP; that is, its future tax revenue was less than committed obligations by an amount equivalent to eight times the value of all goods and services America produces in a year. The net worth of European countries ranged from about negative 250 percent (Italy) to negative 1,800 percent (Greece). For Germany, France and the U.K., the approximate figures were negative 500 percent, negative 600 percent and negative 1,000 percent of GDP.

Wow, it’s depressing that the long-run outlook for the United States is worse than it is for some of Europe’s most infamous welfare states. Though I guess we shouldn’t be totally surprised since I’ve already shared similarly grim estimates from the IMF, BIS, and OECD.

I’ll close with some (sort of) good news.

Notwithstanding some of the estimates I’ve shared, America actually is in better shape than these other nations. If we enact genuine entitlement reform, ideally sooner rather than later, the long-run numbers dramatically improve because spending and debt no longer would be projected to rise so dramatically (whereas government already is an enormous burden in Europe).

This isn’t idle theory. Policymakers don’t have much control over demographics, but they can reduce the fiscal impact of demographic change by adopting better policy.

To cite the most prominent examples, jurisdictions such as Hong Kong and Singapore have very long lifespans and very low birthrates, yet their public finances don’t face nearly as much long-run pressure because they never made the mistake of setting up western-style welfare states.

The solution, therefore, is for America and other nations to copy these successful jurisdictions by replacing tax-and-transfer entitlements with systems based on private savings.

P.S. For what it’s worth, I’m not overflowing with optimism that we’ll get the reforms that are needed with Trump in the White House.

Read Full Post »

The world’s best welfare state arguably is Finland.

Yes, the burden of government spending is enormous and the tax system is stifling, but the nation gets extremely high scores for rule of law and human liberty. Moreover, it is one of the world’s most laissez-faire economies when looking at areas other than fiscal policy.

Indeed, depending on who is doing the measuring, Finland ranks either slightly above or slightly below the United States when grading overall policy.

Yet even the best welfare state faces a grim future because of demographic change. Simply stated, redistribution programs only work if there is a sufficiently large supply of new taxpayers to finance promised handouts.

And that supply is running dry in Finland. Bloomberg reports that policymakers in that nation are waking up to the fact that there won’t be enough future taxpayers to finance the country’s extravagant welfare state.

Demographics are a concern across the developed world, of course. But they are particularly problematic for countries with a generous welfare state, since they endanger its long-term survival. …the Aktia Bank chief economist said in a telephone interview in Helsinki. “We have a large public sector and the system needs taxpayers in the future.” …According to the OECD, Finland already has the lowest ratio of youths to the working-age population in the Nordics. …And it also has the highest rate of old-age dependency in the region. …The situation is only likely to get worse, according to OECD projections.

Here are a couple of charts showing dramatic demographic changes in Nordic nations. The first chart shows the ratio of children to working-age adults.

And the second charts shows the population of old people (i.e., those most likely to receive money from the government) compared to the number of working-age adults.

As you can see, the numbers are grim now (green bar) but will get far worse by the middle of the century (the red and black bars) because the small number of children today translates into a small number of working-age adults in the future.

To be blunt, these numbers suggest that it’s just a matter of time before the fiscal crisis in Southern Europe spreads to Scandinavia.

Heck, it’s going to spread everywhere: Western Europe, Eastern Europe, Asia, the developing world, Japan and the United States.

Though it’s important to understand that demographic changes don’t necessarily trigger fiscal and economic problems. Hong Kong and Singapore have extremely low fertility rates, yet they don’t face big problems since they are not burdened by western-style welfare states.

By the way, the article also reveals that Finland’s government isn’t very effective at boosting birthrates, something that we already knew based on the failure of pro-natalist government schemes in nations such as Italy, Spain, Denmark, and Japan.

Though I’m amused that the reporter apparently thinks government handouts are a pro-parent policy and believes that more of the same will somehow have a positive effect.

Finland, a first-rate place in which to be a mother, has registered the lowest number of newborns in nearly 150 years. …the fertility rate should equal two per woman, Schauman says. It was projected at 1.57 in 2016, according to Statistics Finland. That’s a surprisingly low level, given the efforts made by the state to support parenthood. …Finland’s famous baby-boxes. Introduced in 1937, containers full of baby clothes and care products are delivered to expectant mothers, with the cardboard boxes doubling up as a makeshift cot. …Offering generous parental leave…doesn’t seem to be working either. …The government has been working with employers and trade unions to boost gender equality by making parental leave more flexible and the benefits system simpler.

Sigh, a bit of research would have shown that welfare states actually have a negative impact on fertility.

The bottom line is that entitlement reform is the only plausible way for Finland to solve this major economic threat.

P.S. Since the nation’s central bank has published research on the negative impact of excessive government spending, there are some Finns who understand what should be done.

Read Full Post »

Older Posts »