Feeds:
Posts
Comments

Archive for the ‘Marginal Tax Rate’ Category

In past columns on the topic of basic income, most of my attention has focused on how universal handouts would undermine the work ethic.

To be succinct, I fear that a non-trivial share of the population would exit the labor force if they received a big chunk of guaranteed money from government.

But there’s another side to the fiscal equation, which is the tax burden would be needed to finance a basic income.

Thanks to some research from Germany, we have at least one answer to that question.

But I suspect that most people won’t like the results, which were put together by a team led by Professor Frank C. Englmann of the Institute of Economics and Law (IVR) at the University of Stuttgart.

…introducing a UBI that guarantees a livelihood while eliminating social benefits (e.g., unemployment benefits, old age security, and family allowance) would considerably simplify the German social system and greatly reduce the administrative burden. However, compared with the legal status in 2021, state transfer payments would have to be greatly increased. “According to our calculations, public expenditure on a living UBI would be up to EUR 900 billion. Considerable tax increases would be necessary in order to finance this,” says Professor Frank C. Englmann of the IVR. If the state introduced a flat tax of 66.1% for all citizens, a UBI of EUR 1,000 per month for adults and EUR 500 for children could be financed. …Compared with the status quo, there would be a considerable redistribution.

I like the flat tax, but I’ve always assumed a low tax rate.

Needless to say, a flat tax of 66.1 percent would be absurdly destructive.

How many people – either in Germany or any other nation – would choose to work when faced with such punishment? Especially when instead they could sit on a couch all day and collect a basic income?

No wonder Swiss voters overwhelmingly rejected the idea in a 2016 referendum.

P.S. Joe Biden at one point understood the downsides of universal payments. Given his support for per-child handouts, he’s obviously since moved in the wrong direction.

Read Full Post »

Last week, I wrote about Biden’s proposed budget, focusing on the aggregate increase in the fiscal burden.

Today, let’s take a closer look at his class-warfare tax proposals. Consider this Part VI in a series (Parts I-V can be found hereherehere, here, and here), and we’ll use data from the folks at the Tax Foundation.

We’ll start with this map, which shows each state’s top marginal tax rate on household income if Biden’s budget is enacted.

The main takeaway is that five state would have combined top tax rates of greater than 50 percent if Biden is successful in pushing the top federal rate from 37 percent to 39.6 percent.

At the risk of understatement, that’s not a recipe for robust entrepreneurship.

While it is a very bad idea to have high marginal tax rates, it’s also important to look at whether the government is taxing some types of income more than one time.

That’s already a pervasive problem.

Yet the Tax Foundation shows that Biden wants to make the problem worse. Much worse.

His proposed increase in the corporate tax rate is awful, but his proposal to nearly double the tax burden on capital gains is incomprehensibly foolish.

I guess we should be happy that Biden didn’t propose to also increase the 40 percent rate imposed by the death tax.

But that’s not much solace considering what Biden would do to American competitiveness. Here’s our final visual for today.

As you can see, the president wants to make the US slightly worse than average for personal income taxes, significantly worse than average for the corporate income tax, and absurdly worse than average for taxes on capital gains and dividends.

I’ll close by observing that some of my leftist friends defend these taxes since they target the “evil rich.”

I have a moral disagreement with their view that people should be punished simply because they are successful investors, entrepreneurs, or business owners.

But the bigger problem is that they don’t understand economics. Academic research shows that ordinary workers benefit when top tax rates are low, and there’s even more evidence that workers are hurt when there is punitive double taxation on saving and investment.

Read Full Post »

Marginal tax rates (how much you are taxed for earning additional money) have a big impact on incentives to engage in productive activity such as work, saving, investment, and entrepreneurship.

This is why governments should keep tax rates at modest levels.

But as you can see from this map from the Tax Foundation, European governments generally cannot resist the temptation to impose onerous top tax rates on investors, entrepreneurs, business owners, and other successful taxpayers.

Congratulations to Hungary for having the lowest rate, followed by Estonia, the Czech Republic, and Slovakia.

And “congratulations” to Denmark for having the highest top tax rate, followed by France, Austria, and Spain.

At this point, a few caveats are necessary. A nation’s top income tax rate is important, but it’s not the only thing that matters for tax policy.

  • It’s also important to look at social insurance (payroll) taxes, particularly if they apply to all income.
  • It’s also important to look at the level of “double taxation” on income that is saved and invested.
  • It’s also important to look at VATs, which increase the wedge between pre-tax income and post-tax consumption.

Needless to say, other economic policies also matter. A nation might have a good tax system but very dirigiste policies in other areas. Or vice-versa.

For instance, even though Hungary has the lowest top tax rate on personal income and Denmark has the highest, there’s actually more overall economic liberty in Denmark.

Some readers may be wondering how the United States compares to the European nations shown in the above map.

The good news (relatively speaking) is that the top tax rate in the United States is 42.9 percent, so that’s lower than the average in Europe.

The bad news is that the US would have the highest tax rate if Biden’s budget was approved.

However, the top income tax rate in the United States can vary substantially depending on state.

A resident of New York or California, for instance, will face a much higher top tax rate than a resident of a zero-income-tax state such as Texas or Florida.

The same thing is even more true in Switzerland, where top tax rates vary substantially.

A successful taxpayer in Zug pays a top tax rate of 22.22 percent, less than half as much as a similar taxpayer in Geneva.

I’ll close by noting that this map is another example of the advantages of genuine federalism.

When the central government is small and most government takes place at the state and local level (or, in the case of Switzerland, at the cantonal and municipal level), there is more diversity, choice, and jurisdictional competition.

That type of federalism still exists in Switzerland, but unfortunately is eroding in the United States.

Read Full Post »

It usually is not fun writing about public policy, given my libertarian sentiments.

After all, politicians have a natural tendency to expand their powers and diminish our liberties.

So where there is occasional good news, I like to relish the moment.

For instance, I’ve been getting immense enjoyment from the progress on school choice over the past couple of years. Particularly the enactment of state-wide choice programs in West Virginia, Arizona, Iowa, and Utah.

Another area were we’ve seen big progress is state tax rates. I’ve also written about that topic, showing earlier this month how average top personal income tax rates have declined in recent years.

Today, let’s let a couple of maps tell the same story.

Here’s the Tax Foundation’s new map showing top personal tax rates for 2023. At the risk of stating the obvious, it’s best to be grey. But if you’re not grey, it’s good to be a lighter color and bad to be a darker color.

Now compare that map to the 2021 version. You’ll easily notice more dark-colored states.

But since the color schemes for the maps are not exactly the same, the best thing to compare numbers for specific states.

You’ll see some states have made huge progress, most notably Arizona and Iowa, but also incremental progress in most states.

By contrast, only a few states have moved in the wrong direction, most notably Massachusetts (thanks to a terrible referendum last November) and New York.

As you might expect, given the chance to “vote with their feet,” people and businesses are moving from high-tax states to low-tax states.

Yet that’s not stopping politicians in some high-tax states from agitating to push policy even further in the wrong direction. A very strange form of slow-motion economic suicide.

Read Full Post »

The economics of tax policy is largely the economics of incentives. When governments impose high tax rates on something, you get less of that thing.

My left-leaning friends acknowledge this is true, but only selectively. They openly agitate for higher taxes on things like tobacco (or sugar, or energy) and they correctly argue that higher tax rates will lead to less smoking.

As a libertarian, I don’t want to control other people’s lives, so I’m not a big fan of such taxes, but the underlying economic analysis is correct.

Unfortunately, my friends on the left often forget economic analysis when looking at tax rates on productive behaviors such as work, saving, investment, and entrepreneurship.

It is also important to realize that not all taxes are created equal. Whether politicians are cutting taxes or increasing taxes, the economic consequences will vary depending on the details.

For instance, even though I just stated that I don’t favor higher “sin taxes,” raising the tax burden on things like cigarettes will do less economic damage than increasing marginal tax rates on labor and capital.

There are also good and not-so-good ways of lowering taxes, and we have an example of this from Michigan.

As reported by Craig Mauger and Candice Williams of the Detroit News, there’s a big budget surplus in Michigan and politicians are debating whether to reduce the rate of the state’s flat tax or to give one-time tax rebates. Here are some excerpts from the story.

Michigan Gov. Gretchen Whitmer and the Democratic leaders of the Legislature are preparing a sweeping tax relief proposal they say will reduce tax bills by more than $1 billion and include rebate checks that could be issued directly to residents. The Friday agreement focuses on a plan to ease taxes on retirement income, boost a tax credit for low-wage workers and issue “inflation relief checks” in place of a potential cut in the state’s personal income tax, which was expected to be triggered by growing revenues, according to a source familiar with the plan. …as the state sits on a surplus of more than $9 billion, Republicans in the House and Senate have called for a broad tax cut for Michiganians and the preservation of the potential automatic drop in the personal income tax rate, which is being caused by language in a 2015 law. That policy tied the income tax, currently at 4.25%, to revenues for the state’s general fund. …based on preliminary fiscal year 2022 revenue figures, the revenue trigger would be activated and lower the income tax rate for the 2023 tax year from 4.25% to 4.05%. …“The Democrats’ proposal is a head fake intended to hide their attempt to rob Michigan taxpayers of an income tax cut in favor of funding a corporate welfare slush fund — prioritizing big corporations over Michigan families,” said Sarah Anderson, executive director of the Michigan Freedom Fund.

Michigan Democrats want more than rebates. They also favor “an exemption for public pensions” and “economic development subsidies for businesses.”

At the risk of stating the obvious, a lower rate for the flat tax will be far more beneficial to the state than one-time rebates and special favors for bureaucrats (who already enjoy higher compensation than workers in the private sector).

And a lower rate on the flat tax also would be far preferable to special handouts for businesses (which inevitably translates into corrupt cronyism).

I’ll close with a final point about overall fiscal policy. The Michigan tax fight is also a spending fight. Democrats are focusing on tax rebates in part because they are a one-off event. They’ll return some money to taxpayers this year, but there are no long-run savings.

By contrast, a cut in the state’s flat tax produces long-run savings for people. As the story noted, “Rebates are typically one-time spending bursts, while cuts in the income tax rate usually are kept in place for multiple years.”

Needless to say, politicians who want to spend more money prefer one-time rebates over permanent tax cuts.

P.S. Pursuing sub-optimal tax policy is not just a left-wing problem. Some folks on the right favor things such as child credits. That kind of tax cut will reduce tax liabilities for families, but those families quite likely would be better off in the long run with growth-oriented reductions in marginal tax rates on labor and capital.

Read Full Post »

I wrote in both 2021 and 2022 about states enacting lower tax rates.

And that includes several states (Iowa, Idaho, Arizona) adopting flat taxes.

Today, let’s quantify these developments. Our friends at the Tax Foundation just published a chart showing how top tax rates at the state level have declined since 2010.*

The decline is not enormous, but it’s encouraging to see a downward trend (particularly if the alternative is an upward trend!).

Will we see further progress this year? Yes, notwithstanding last November’s terrible ballot initiative in Massachusetts, there are already some pre-approved reductions in tax rates. So the average will fall in 2023 and 2024.

After that, my fingers will be crossed.

But I am confident that we will see continued migration from high-tax states to low-tax states. And this will happen for two reasons.

  • First, some people will move because they are tired to paying high tax rates, especially since they live in states that do a rotten job of providing basic services (high tax burdens generally get diverted to bureaucrat salaries and pensions).
  • Second, other people might not earn enough to directly care about high tax rates, but they nonetheless will move because low-tax states create more jobs and offer greater opportunities for economic advancement.

Let’s close with some speculation about what might happen in the future.

I’m guessing that folks on the left don’t like this shift to lower tax rates at the state level, much as they didn’t like the global shift to lower tax rates after Ronald Reagan and Margaret Thatcher instigated a virtuous cycle of tax competition about 40 years ago.

In the case of global tax competition, high-tax nations have been using the OECD as a vehicle to curtail the shift to better tax policy. The OECD pressured so-called tax havens with financial protectionism and is now pressing governments to increase corporate tax burdens.

Unsurprisingly, global tax rates are now creeping upwards.

Is it possible that there will be similar efforts inside the United States?

I hope not. I can’t imagine sensible states like Texas and Florida agreeing to any sort of state tax cartel.

And I also don’t think there’s any immediate threat of Congress imposing a Washington-created cartel.

But it doesn’t hurt to be vigilant. Remember, the great thing about tax competition is that it pressures politicians to do the right thing when they generally would prefer to do the wrong thing.

*The “mean” is the average of all 50 states and the “median” is the rate in the state that is lower than half the states and higher in half the states.

Read Full Post »

Back in 2009, I narrated a video about the downsides of class-warfare tax policy.

But if you don’t want to spend eight minutes watching the video (or 14 minutes watching this video), here’s a visual that summarizes why high tax rates discourage people from engaging in productive behavior.

The most important thing to understand is that a high marginal tax rate (i.e., the tax rate on earning more money) has a big effect on incentives to work, save, invest, and be entrepreneurial.

But how big is that effect?

Let’s review some new research from Professor Charles Jones.

The classic tradeoff in the optimal income tax literature is between redistribution and the incentive effects that determine the “size of the pie.” …However, what is in some ways the most natural effect on the size of the pie has not been adequately explored. …To the extent that top income taxation distorts…innovation, it can impact not only the income of the innovator but also the incomes of everyone else in the economy. …High incomes are a prize that partly motivates entrepreneurs to turn basic insights into a product or process that ultimately benefits consumers. High marginal tax rates deter this effort and therefore reduce innovation and overall GDP. …For example, consider raising the top marginal tax rate from 50% to 75%. …the change raises about 2.5% of GDP in revenue before the behavioral response. In the baseline calibration…, this increase in the top tax rate reduces innovation and lowers GDP per person in the long run by around 7 percent. …even redistributing the 2.5% of GDP to the bottom half of the population would leave them worse off on average: the 7% decline in their incomes is not offset by the 5% increase from redistribution. In other words, raising the top marginal rate from 50% to 75% reduces social welfare…the rate that incorporates innovation and maximizes the welfare of workers is much lower: the benchmark value is just 9%.

Here’s a table from the study showing how the optimum tax rate is very low if the goal is to help workers and society rather than politicians.

If you want more evidence, there’s a never-ending supply.

But if we want to be concise, start with this list.

Heck, higher tax rates can even hurt your favorite sports team.

P.S. Joe Biden wants people to think that it’s patriotic to pay more tax, though he exempts himself with clever tax planning.

Read Full Post »

Motivated in part by an excellent graphic that I shared in 2016, I put together a five-column ranking of state personal income tax systems in 2018.

Given some changes that have since occurred, it’s time for a new version. The first two columns are self explanatory and columns 3 and 5 are based on whether the top tax rate on households is less than 5 percent (“Low Rate”) or more than 8 percent (“Class Warfare”).

Column 4, needless to say, is for states where the top tax rate in between 5-8 percent.

The good news is that the above table is better than the one I created in 2018. Thanks to tax competition between states, there have been some improvements in tax policy.

I recently wrote about Louisiana’s shift in the right direction.

Now we have some good news from the Tarheel state. The Wall Street Journal opined today about a new tax reform in North Carolina.

The deal phases out the state’s 2.5% corporate income tax between 2025 and 2031. …The deal also cuts the state’s flat 5.25% personal income tax rate in stages to 3.99% by July 1, 2027. …North Carolina ranks tenth on the Tax Foundation’s 2021 state business tax climate index, and these reforms will make it even more competitive. …North Carolina has an unreserved cash balance of $8.55 billion, and legislators are wisely returning some of it to taxpayers.

What’s especially noteworthy is that North Carolina has been moving in the right direction for almost 10 years.

P.S. Arizona almost moved from column 3 to column 5, but that big decline was averted.

P.P.S. There are efforts in Mississippi and Nebraska to get rid of state income taxes.

P.P.P.S. Kansas tried for a big improvement a few years ago, but ultimately settled for a modest improvement.

Read Full Post »

Immediately after election day in early November, I applauded voters in the (very blue) state of Washington. They wisely expressed their opposition to a plan by state politicians to impose a capital gains tax.

And it wasn’t even close. Voters said no by a landslide margin in a state that went heavily for Biden.

Today, we’re going to look at more good news from a statewide initiative.

Voters in Louisiana last Saturday had a chance to vote for some pro-growth tax reform. And, as reported by KPVI, they made a wise choice.

Louisiana voters approved a constitutional amendment that decreases the maximum individual income tax rate from 6% to 4.75% beginning next year. …fifty-four percent of voters agreed to Amendment 2, which affects taxpayers making more than $50,000 and couples making more than $100,000 annually. …The free market Pelican Institute also supported Amendment 2. “For too long Louisiana has been lagging behind our neighbors, but the people of Louisiana voted to start our comeback story by passing amendment 2 to simplify our tax code and lower our income tax rates to the lowest in the Southeast of states that levy the tax,” Pelican Institute CEO Daniel Erspamer said in a statement.

The good news gets even better.

Voters imposed a cap on income tax rates, with a maximum of 4.75 percent.

But the legislature is putting the rate down to 4.25, as noted by the Tax Foundation.

Let’s close by looking at some excerpts from an editorial by the Wall Street Journal.

…voters on Saturday approved a constitutional amendment that will reduce corporate and individual income tax rates while simplifying the code. …The tax reform, approved with 54% of the vote, eliminates the deductibility for federal taxes while reducing the top income tax rate on individuals making more than $50,000 to 4.25% from 6%. Rates will also decline for lower earners. The current five corporate tax brackets would be consolidated into three with the top rate falling to 7.5% from 8%. Most Louisianans will get a small net tax cut, and the implementing legislation includes triggers that would reduce rates more if revenues meet growth goals.

For what it’s worth, allowing state deductibility of federal taxes is almost as misguided as federal deductibility of state and local taxes.

So Louisiana voters opted for a win-win situation of lower rates and getting rid of a loophole.

P.S. In a payoff to their wealthy constituents (and to make life easier for profligate governors, state lawmakers, and local officials), Democrats in Congress are pushing to re-create a big deduction for state and local tax payments.

Read Full Post »

The good news is that President Biden wants the United States to be at the top. The bad news is that he wants America to be at the top in bad ways.

  • The highest corporate income tax rate.
  • The highest capital gains tax rate.
  • The highest level of double taxation.

We can now add another category, based on the latest iteration of his budget plan.

According to the Tax Foundation, the United States would have the developed world’s most punitive personal income tax.

Worse than France and worse than Greece. How embarrassing.

In their report, Alex Durante and William McBride explain how the new plan will raise tax rates in a convoluted fashion.

High-income taxpayers would face a surcharge on modified adjusted gross income (MAGI), defined as adjusted gross income less investment interest expense. The surcharge would equal 5 percent on MAGI in excess of $10 million plus 3 percent on MAGI above $25 million, for a total surcharge of 8 percent. The plan would also redefine the tax base to which the 3.8 percent net investment income tax (NIIT) applies to include the “active” part of pass-through income—all taxable income above $400,000 (single filer) or $500,000 (joint filer) would be subject to tax of 3.8 percent due to the combination of NIIT and Medicare taxes. Under current law, the top marginal tax rate on ordinary income is scheduled to increase from 37 percent to 39.6 percent starting in 2026. Overall, the top marginal tax rate on personal income at the federal level would rise to 51.4 percent. In addition to the top federal rate, individuals face taxes on personal income in most U.S. states. Considering the average top marginal state-local tax rate of 6.0 percent, the combined top tax rate on personal income would be 57.4 percent—higher than currently levied in any developed country.

Needless to say, this will make the tax code more complex.

Lawyers and accountants will win and the economy will lose.

I’m not sure why Biden and his big-spender allies have picked a complicated way to increase tax rates, but that doesn’t change that fact that people will have less incentive to engage in productive behavior.

What matters is the marginal tax rate on people who are thinking about earning more income.

And they’ll definitely choose to earn less if tax rates increase, particularly since well-to-do taxpayers have considerable control over the timing, level, and composition of their income.

P.S. Based on what happened in the 1980s, we can safely assume that Biden’s class-warfare plan won’t raise much money.

Read Full Post »

When I discuss class-warfare tax policy, I want people to understand deadweight loss, which is the term for the economic output that is lost when high tax rates discourage work, saving, investment, and entrepreneurship.

And I especially want them to understand that the economic damage grows exponentially as tax rates increase (in other words, going from a 30 percent tax rate to a 40 percent tax rate is a lot more damaging than going from a 10 percent tax rate to a 20 percent tax rate).

But all of this analysis requires a firm grasp of supply-and-demand curves. And most people never learned basic microeconomics, or they forgot the day after they took their exam for Economics 101.

So when I give speeches about the economics of tax policy, I generally forgo technical analysis and instead appeal to common sense.

Part of that often includes showing an image of a “philoso-raptor” pondering whether the principle that applies to tobacco taxation also applies to taxes on work.

Almost everyone gets the point, especially when I point out that politicians explicitly say they want higher taxes on cigarettes because they want less smoking.

And if you (correctly) believe that higher taxes on tobacco lead to less smoking, then you also should understand that higher taxes on work will discourage productive behavior.

Unfortunately, these common-sense observations don’t have much impact on politicians in Washington. Joe Biden and Democrats in Congress are pushing a huge package of punitive tax increases.

Should they succeed, all taxpayers will suffer. But some will suffer more than others. In an article for CNBC, Robert Frank documents what Biden’s tax increase will mean for residents of high-tax states.

Top earners in New York City could face a combined city, state and federal income tax rate of 61.2%, according to plans being proposed by Democrats in the House of Representatives. The plans being proposed include a 3% surtax on taxpayers earning more than $5 million a year. The plans also call for raising the top marginal income tax rate to 39.6% from the current 37%. The plans preserve the 3.8% net investment income tax, and extend it to certain pass-through companies. The result is a top marginal federal income tax rate of 46.4%. …In New York City, the combined top marginal state and city tax rate is 14.8%. So New York City taxpayers…would face a combined city, state and federal marginal rate of 61.2% under the House plan. …the highest in nearly 40 years. Top earning Californians would face a combined marginal rate of 59.7%, while those in New Jersey would face a combined rate of 57.2%.

You don’t have to be a wild-eyed “supply-sider” to recognize that Biden’s tax plan will hurt prosperity.

After all, investors, entrepreneurs, business owners, and other successful taxpayers will have much less incentive to earn and report income when they only get to keep about 40 cents out of every $1 they earn.

Folks on the left claim that punitive tax rates are necessary for “fairness,” yet the United States already has the developed world’s most “progressive” tax system.

I’ll close with the observation that the punitive tax rates being considered will generate less revenue than projected.

Why? Because households and businesses will have big incentives to use clever lawyers and accountants to protect their income.

Looking for loopholes is a waste of time when rates are low, but it’s a very profitable use of time and energy when rates are high.

P.S. Tax rates were dramatically lowered in the United States during the Reagan years, a policy that boosted the economy and led to more revenues from the rich. Biden now wants to run that experiment in reverse, so don’t expect positive results.

P.P.S. Though if folks on the left are primarily motivated by envy, then presumably they don’t care about real-world outcomes.

Read Full Post »

The welfare state and the so-called war on poverty has been very bad news for taxpayers.

But it’s also very bad news for poor people, in part because various redistribution programs can lure them out of the productive economy and into total dependency on government (and this will become an even bigger problem if Biden’s per-child handouts are approved).

But it’s also bad news because redistribution programs can result in very high implicit tax rates for low-income people who try to improve their lives by climbing the economic ladder.

I shared an example back in 2012, which showed how a single mother in Pennsylvania would be worse off with $57,000 of income instead of $29,000.

In other words, she would be dealing with a de facto marginal tax rate of more than 100 percent.

If you want to understand how this happens, Professors Craig Richardson and Richard McKenzie wrote about this topic in an article for The Library of Economics and Liberty.

…by expanding public assistance programs, the President’s plan will unavoidably impose a higher, hidden tax rate—known as an “implicit marginal income tax rate” (which we shorten to implicit tax rate)—on low-wage workers who receive welfare benefits. Those workers will pay an implicit tax rate because many welfare benefits are reduced as earnings rise. Ironically, the poorest Americans often pay implicit tax rates that are far higher than the IRS’s explicit marginal income-tax rates imposed on the country’s highest income earners. …Consider a household that receives benefits from only two welfare programs, with one tapering off at 20 cents for each added dollar earned and another tapering off at 40 cents for each added dollar earned. Those cuts create an implicit tax rate of 60 percent, which means the worker has only 40 cents in additional spendable income for each added dollar earned. This implicit tax rate can be expected to affect work incentives in much the same way that a federal income tax rate does.

The authors cite a real-world example.

…consider a real-life, low-income single mother of two children in Forsyth County, North Carolina earning $10 an hour in a full-time job, which means she has a monthly earned income of $1,600 (or $19,200 annually). Suppose the single mother receives monthly benefits from five welfare programs: $425 in food stamps, $1,471 in subsidized childcare, $370 in housing subsidies, $180 in WIC benefits, and $493 in an earned income tax credit (EITC). Her monthly welfare benefits will total $2,939 (or $35,271 a year). Now, suppose the single mother takes a new job paying $15 an hour, a 50 percent increase. Her monthly earned income will rise by $800 to $2,400 (with her annual income rising to $28,800 a year, an annual earnings increase of $9,600). However, she will face decreases in four out of her five monthly benefit streams, with each benefit reduction based on the same $800-increase in earnings (a problem known among welfare researchers as the “cumulative stacked effect”). The single mother will lose $231 in food stamps, $80 in childcare benefits, $216 in housing benefits, and $166 in EITC. Her total decrease in monthly benefits will reach $694 (which means her annual benefit total will drop by $8,328).4 Her implicit tax rate on her added monthly earnings of $800 is 87 percent—more than two times the highest explicit marginal tax rate proposed for the rich. …In addition, the single mother will be required to pay an added $185 a month in federal and state income taxes on her added earned monthly income of $800, which is an explicit tax rate of 23 percent. Adding the 87 percent implicit tax rate to the 23 percent explicit tax rate leads to an overall tax rate of 110 percent. Her raise has left her $79 per month poorer in lost wages and benefits—surely a strong disincentive for her to take the higher paying job.

Here’s a table showing those results.

If you want more evidence, check out Chart 7 from this column and Figure 8 from this column.

And the same problem exists in other nations as well.

P.S. Obamacare may have lured as many as 2 million people into full dependency.

P.P.S. I already mentioned how Biden’s per-child handouts could lure many more into full dependency, but “basic income” could be far worse.

Read Full Post »

When studying the economics of taxation, one of the most important lessons is that there should be low marginal tax rates on work, saving, investment, and entrepreneurship.

That’s also the core message of this video from Prof. John Cochrane.

I wrote a primer on marginal tax rates back in 2018. I wanted to help people understand that the incentive to engage in additional productive behavior is impacted by how much people get to keep if they earn additional income.

So what matters isn’t the tax on income that’s already been generated. The key variable is the marginal tax on the additional increment of income. As illustrated by the accompanying visual.

I’ve shared real-life examples of how the American tax system can result in very high marginal tax rates, especially when you include the extra layers of tax on income that is saved and invested (producing extremely high effective marginal tax rates).

For today’s column, let’s look at a real-world example from the other side of the Atlantic Ocean.

The U.K.-based Telegraph has a story illustrating how marginal tax rates often can be much higher than the official statutory tax rate.

More than a third of a million people now face paying income tax at a rate of 60pc because of government stealth tax policies… 336,000 people earned between £100,000 and £125,000 in 2018-19, the last year for which data was available. …This group is meant to pay income tax at a rate of 40pc, but risks falling foul of a costly trap which results in their earnings being subject to effective income tax rates that are far higher. The trap is sprung once someone starts to earn more than £100,000, as this is the point at which the Government begins to withdraw the £12,570 tax-free personal allowance. For every £1 earned over £100,000, the state reduces the allowance by 50p. The result is that each additional £1 of income effectively incurs 60p of income tax… Once National Insurance is factored in, the true rate is even higher.

Here’s a chart that was part of the article.

It shows that anyone earning £50,000 or above is losing at least 40 percent to the tax authorities. That statutory rate is both punitive and excessive.

But you also can see how the marginal tax rate jumps to 60 percent once taxpayers hit £100,000 on income.

At the risk of understatement, high marginal tax rates are bad news for the economy.

That’s true in the United Kingdom, the United States, and everyplace else in the world.

To use economic jargon, “deadweight losses” grow exponentially as tax rates are increased.

In regular English, this simply means that class-warfare tax policy (ever-higher tax rates on the so-called rich) causes the most economic damage. Even the left-leaning OECD agrees with this analysis.

You may be wondering why a supposedly conservative government in the United Kingdom allows such a destructive policy.

Sadly, there is no good answer. As you can see from this excerpt, Boris Johnson’s government sounds a lot like what the U.K. would have experienced if Jeremy Corbyn won the last election.

The Government said it was aware of the effect of the 60pc tax trap but said it had to take a “balanced approach”. “We want to keep taxes low to support working people to keep more of what they earn, but it’s only fair that those with the broadest shoulders bear the biggest burden as we rebuild the public finances and fund public services,” a spokesman said.

P.S. If President Biden’s tax plan is any indication, our friends on the left seem to be motivated by spite and envy, so they don’t care that high tax rates have negative consequences.

P.P.S. A wealth tax could easily result in marginal tax rates of more than 100 percent.

P.P.P.S. The politicians in Washington also believe in very high implicit tax rates on low-income people.

P.P.P.P.S. The various plans for per-child handouts would create another big spike in marginal tax rates for a large cohort of American taxpayers.

Read Full Post »

About one week ago, I shared some fascinating data from the Tax Foundation about how different nations penalize saving and investment, with Canada being the worst and Lithuania being the best.

I started that column by noting that there are three important principles for sensible tax policy.

  1. Low marginal tax rates on productive behavior
  2. No tax bias against capital (i.e., saving and investment)
  3. No tax preferences that distort the economy

Today, we’re going to focus on #1, specifically the tax burden on the average worker.

And, once again, we’ll be citing some of the Tax Foundation’s solid research. Here are their numbers showing the tax burden on the average worker in OECD nations. As you can see, Belgium is the worst place to be, followed by Germany, Austria, and France.

Colombia has the lowest tax burden on average workers, though that’s mostly a reflection of low earnings in that relatively poor nation.

Among advanced nations, Switzerland has the lowest tax burden when value-added taxes are part of the equation, while New Zealand is the best when looking just at income taxes and payroll taxes.

Here’s some of what the Tax Foundation wrote in its report, which was authored by Cristina Enache.

Average wage earners in the OECD have their take-home pay lowered by two major taxes: individual income and payroll (both employee and employer side). …The average tax burden among OECD countries varies substantially. In 2020, a worker in Belgium faced a tax burden seven times higher than that of a Chilean worker. …Accounting for VAT and sales tax, the average tax burden on labor in 2020 was 40.1 percent, 5.5 percentage points higher than when only income and payroll taxes are considered. …The tax burden on labor is referred to as a “tax wedge,” which simply refers to the difference between an employer’s cost of an employee and the employee’s net disposable income. …Tax wedges are particularly high in European countries—the 23 countries with the highest tax burden in the OECD are all European. …Chile and Mexico are the only countries that do not provide any tax relief for families with children but they keep the average tax wedge low.

Here’s a look at which countries in the past two decades that have made the biggest moves in the right direction and wrong direction. Kudos to Hungary and Lithuania.

And you can also see why I’m not overly optimistic about the long-run outlook for Mexico and South Korea.

The report also has a map focusing on tax burdens in Europe. The darker the nation, the more onerous the tax (notice how Switzerland is a light-colored oasis surrounded by dark-colored tax hells).

The report also notes that average tax wedges only tell part of the story. If you want to understand a tax system’s impact on incentives for productive behavior, it’s important to look at marginal tax rates.

The average tax wedge is…the combined share of labor and payroll taxes relative to gross labor income, or the tax burden. The marginal tax wedge, on the other hand, is the share of labor and payroll taxes applicable to the next dollar earned and can impact individuals’ decisions to work more hours or take a second job. The marginal tax wedge is generally higher than the average tax wedge due to the progressivity of taxes on labor across countries—as workers earn more, they face a higher tax wedge on their marginal dollar of earnings. …a drastic increase in the marginal tax wedge…might deter workers from pursuing additional income and working extra hours.

And here’s Table 1 from the report, which shows that marginal tax rates can be very high, even at relatively modest levels of income.

In what could be a world record for understatement, this data led Ms. Enache to conclude that Italy’s tax system “might” deter workers.

In 2020 an Italian worker making €38,396 (US $56,839) faced a marginal tax wedge as high as 117 percent on a 1 percent increase in earnings. Such marginal tax wedges might deter workers from pursuing additional income and working extra hours.

Though that’s not the most absurd example of over-taxation. Let’s not forget that thousands of French taxpayers have had tax bills that were greater than their entire income.

Sort of like an Obama-style flat tax, but in real life rather than a joke.

P.S. As I’ve previously noted, Belgium is an example of why a country can’t simultaneously have a big government and a good tax system.

Read Full Post »

Yesterday’s column featured some of Milton Friedman’s wisdom from 50 years ago on how a high level of societal capital (work ethic, spirit of self-reliance, etc) is needed if we want to limit government.

Today, let’s look at what he said back then about that era’s high tax rates.

His core argument is that high marginal tax rates are self-defeating because the affected taxpayers (like Trump and Biden) will change their behavior to protect themselves from being pillaged.

This was in the pre-Reagan era, when the top federal tax rate was 70 percent, and notice that Friedman made a Laffer Curve-type prediction that a flat tax of 19 percent would collect more revenue than the so-called progressive system.

We actually don’t know if that specific prediction would have been accurate, but we do know that Reagan successfully lowered the top tax rate on the rich from 70 percent in 1980 to 28 percent in 1988.

So, by looking at what happened to tax revenues from these taxpayers, we can get a pretty good idea whether Friedman’s prediction was correct.

Well, here’s the IRS data from 1980 and 1988 for taxpayers impacted by the highest tax rate. I’ve circled (in red) the relevant data showing how we got more rich people, more taxable income, and more tax revenue.

The bottom line is that Friedman was right.

Good tax policy (i.e., lower rates on productive behavior) can be a win-win situation. Taxpayers earn more and keep more, while politicians also wind up with more because the economic pie expands.

Something to keep in mind since some politicians in Washington want a return to confiscatory taxes on work, saving, investment, and entrepreneurship.

Read Full Post »

Two weeks ago, I shared some video from a presentation to the New Economic School of Georgia (the country, not the state) as part of my “Primer on the Laffer Curve.”

Here’s that portion of that presentation that outlines the principles of sensible taxation.

Just in case you don’t want to watch me pontificate for nearly 14 minutes, here’s the slide from the presentation that most deserves attention since it captures the key principle of good tax policy.

Simply stated, the more you tax of something, the less you get of that thing.

By the way, I had an opportunity earlier this year to share some similar thoughts about the principles of sound tax policy with the United Nations’ High-Level Panel on Financial Accountability Transparency & Integrity.

Given my past interactions with fiscal people at the U.N., I’m not overflowing with optimism that the following observations will have an impact, but hope springs eternal.

The ideal fiscal environment is one that has a vibrant and productive economy that generates sufficient revenue with modest tax rates that do not needlessly penalize productive behavior. Public finance experts generally agree on the following features

  • Low marginal tax rates. A tax operates by increasing the “price” of whatever is being taxed. This is most obvious in the case of some excise taxes –such as levies on tobacco –where governments explicitly seek to discourage certain behaviors. …but there should be a general consensus in favor of keeping tax rates reasonable on the behaviors –work, saving, investment, risk-taking, and entrepreneurship –that make an economy more prosperous.
  • A “consumption-base.” Because of capital gains taxes, death taxes, wealth taxes, and double taxation of interest and dividends, many nations impose a disproportionately harsh tax burden on income that is saved and invested. This creates a bias against capital formation, which is problematical since every economic theory –including various forms of socialism –share the view that saving and investment are necessary for rising wages and higher living standards.
  • Neutrality. Special preferences in a tax system distort the relative “prices” of how income is earned or how income is spent. Such special tax breaks encourage taxpayers to make economically inefficient choices simply to lower their tax liabilities. Moreover, loopholes, credits, deductions, exemptions, holidays, exclusions, and other preferences reduce tax receipts, thus creating pressure for higher marginal tax rates, which magnifies the adverse economic impact.
  • Territoriality. This is the simple notion that governments should not tax activity outside their borders. If income is earned in Brazil, for instance, the Brazilian government should have the authority over how that income is taxed.The same should be true for all other nations.

By the way, “consumption-base” is simply the jargon used by public-finance economists when referring to a tax system that doesn’t impose double taxation (i.e., extra layers of tax on income that is saved and invested).

Here’s a flowchart I prepared showing the double taxation in the current system compared to what happens with a flat tax.

P.S. At the risk of understatement, it’s impossible to have a good tax system with a bloated public sector, which means it’s not easy to be optimistic about future fiscal policy in the United States.

Read Full Post »

Back in 2016, I shared an image that showed how the welfare state punishes both the poor and rich.

Rich people are hurt for the obvious reason. They get hit with the highest statutory tax rates, and also bear the brunt of the double taxation (the extra layers of tax on saving and investment resulting from capital gains taxes, double taxes on dividends, death taxes, etc).

But I also pointed out that the poor are penalized because they get trapped in dependency.

In large part, this is because they face bad incentives when they work and try to become self sufficient. Not only do they get hit by federal and state taxes, but they also can lose access to various redistribution programs. And the combination of those two factors can produce very high implicit marginal tax rates.

I cited an astounding example of this phenomenon in 2012, showing that a single mother in Pennsylvania would be better off earning $29,000 rather than $57,000. In other words, her implicit marginal tax rate on an extra $28,000 would be 100 percent (thus fulfilling FDR’s odious dream, albeit against a different set of victims).

How pervasive is this problem?

A new study published by the National Bureau of Economic Research gives us the answer. Authored by David Altig, Alan J. Auerbach, Laurence J. Kotlikoff, Elias Ilin, and Victor Ye, it estimates implicit marginal tax rates for various segments of the population.

A plethora of federal and state tax and benefit policies jointly determine Americans’ incentives to work. …complex and often arcane provisions that condition tax payments and benefit receipts on labor income, asset income, total income, and the level of assets. …The myriad features of our fiscal system raise this paper’s central questions: What are the typical levels of marginal net tax rates facing Americans of different ages and resource levels, taking the entire federal and state fiscal system into account? …How much does one’s choice of the state in which to live impact one’s incentive to work? …We address these questions by running 2016 Survey-of-Consumer-Finances (SCF) data through The Fiscal Analyzer (TFA).

The five economists discovered that lower-income people are often hit by very high marginal tax rates on work (τL).

Our main findings, which focus on the fiscal consequences of SCF household heads earning $1,000 more in our base year – 2018, are striking. One in four low-wage workers face lifetime marginal net tax rates above 70 percent, effectively locking them into poverty. Over half face remaining lifetime marginal net tax rates above 45 percent. …marginal net lifetime tax rates are generally higher for those in the lowest quintile than for those in the middle three quintiles… The potential poverty trap arising under our fiscal system is highlighted by the 75th τL-percentile values for the bottom quintiles. Moving from the youngest to the oldest cohorts, these values are 67.4 percent, 75.9 percent, 69.3 percent, 76.5 percent, 74.4 percent, and 73.9 percent. Hence, one in four of our poorest households, regardless of age, make between two and three times as much for the government than they make for themselves in earning an extra $1,000.

This graph from the study shows how poor people can even face marginal tax rates of more than 100 percent (which I’ve highlighted in red). The vertical axis is the tax rate and the horizontal axis is household prosperity.

Subjecting poor people to very high implicit tax rates is horrible economic policy, just like it’s horrible policy to hit any other group of people with high marginal tax rates.

Simply stated, when people are punished for engaging in productive economic behavior, they respond by reducing their work, their saving, their investment, and their entrepreneurship.

Interestingly, some states are better (or less worse) than others.

One’s choice of state in which to live can dramatically affect marginal net tax rates. Across all cohorts, the typical bottom-quintile household can lower its remaining lifetime marginal net tax rate by 99.7 percentage points by switching states! …The typical household can raise its total remaining lifetime spending by 8.1 percent by moving from a high-tax to a low-tax state, holding its human wealth, housing expenses, and other characteristics fixed. …To illustrate how τL varies from state to state, we calculate the median τL for households in the 30-39 age cohort in the lowest resource quintile in each state. …Figure 11 shows the cross-state variation in median lifetime marginal tax rates. …median rates varies between a low of 38.8 percent in South Carolina and a high of 55.0 percent in Connecticut. Clearly, where people live can matter a lot for their incentives to work.

Here’s a map showing the marginal tax rate on people in the bottom 20 percent. The obvious takeaway is that you don’t want to be a poor person in Connecticut, Minnesota, or Illinois.

For what it’s worth, tax rates are still too high in the best states (South Carolina, Texas, Indiana, and South Dakota).

The bottom line is that the welfare state is bad news for both taxpayers and recipients. All of which may help to explain why the poverty rate stopped falling once the government declared a “War on Poverty.”

Read Full Post »

In some cases, politicians actually understand the economics of tax policy.

It’s quite common, for instance, to hear them urging higher taxes on tobacco because they want to discourage smoking.

I don’t think it’s their job to tell people how to live their lives, but I agree with their economic analysis. The more you tax something, the less you get of it.

One of my many frustrations is that those politicians then conveniently forget that lesson when it comes to taxing things that are good, such as work, saving, production, and investment.

And some countries are more punitive than others. There’s some new research from the European Policy Information Center, Timbro, and the Tax Foundation, that estimates the “effective marginal tax rate” for successful taxpayers for 41 major countries.

And they don’t simply look at the top income tax rates. They quite properly include other taxes that contribute to “deadweight loss” by driving a wedge between pre-tax income and post-tax consumption.

The political discussion around taxing high-earners usually revolves around the income tax, but in order to get a complete picture of the tax burden high-income earners face, it is important to consider effective marginal tax rates. The effective marginal tax rate answers the question, “If a worker gets a raise such that the total cost to the employer increases by one dollar, how much of that is appropriated by the government in the form of income tax, social security contributions, and consumption taxes?” …all taxes that affect the return to work should be taken into account. …Combining data mainly from international accounting firms, the OECD, and the European Commission, we are able to calculate marginal tax rates in the 41 members of the OECD and/or EU.

The main message of this research is that you don’t want to live in Sweden, where you only keep 24 percent of any additional income you produce.

And you should also avoid Slovenia, Belgium, Portugal, Finland, France, etc.

Congratulations to Bulgaria for being the anti-class warfare nation. That’s a smart strategy for a nation trying to recover from decades of communist deprivation.

American readers will be happy to see that the United States looks reasonably good, though New Zealand is the best of the rich nations, followed by Switzerland.

Speaking of which, we need a caveat for nations with federalist systems, such as the U.S., Switzerland, and Canada. In these cases, the top income tax rate is calculated by adding the central government’s top rate with the average top rate for sub-national governments.

So successful entrepreneurs in those countries actually have the ability to reduce their tax burdens if they make wise decisions on where to live (such as Texas or Florida in the case of the United States).

Let’s now shift to some economic analysis. The report makes (what should be) an obvious point that high tax rates have negative economic effects.

Countries should be cautious about placing excessive tax burdens on high-income earners, for several reasons. In the short run, high marginal tax rates induce tax avoidance and tax evasion, and can cause high-income earners to reduce their work effort or hours.

I would add another adverse consequence. Successful taxpayers can move.

That’s especially true in Europe, where cross-border tax migration is much easier than it is in the United States.

But even though there are odious exit taxes for people leaving the United States, we’ll see an exodus if we wind up with some of the crazy tax policies being advocated by Bernie Sanders and Elizabeth Warren.

P.S. Today’s column looks at how nations rank based on the taxation of labor income. For taxation of capital income, the rankings look quite different. For instance, because of pervasive double taxation, the United States gets poor scores for over-taxing dividends, capital gains, and businesses.

P.P.S. If you want to see tax rates on middle-income workers (though it omits value-added taxes), here is some OECD data.

Read Full Post »

In addition to being a contest over expanding the burden of government spending, the Democratic primary also is a contest to see who wants the biggest tax increases.

Bernie Sanders and Elizabeth Warren have made class-warfare taxation an integral part of their campaigns, but even some of the supposedly reasonable Democrats are pushing big increases in tax rates.

James Pethokoukis of the American Enterprise Institute opines about the anti-growth effect of these proposed tax hikes, particularly with regard to entrepreneurship and successful new firms.

The Democratic presidential candidates have plenty of ideas about taxes. Wealth taxes. Wall Street taxes. Inequality taxes. And probably more to come. So lots of creative thinking about wealth redistribution. Wealth creation? Not so much. …one way to look at boosting GDP growth is thinking about specific policies to boost labor force and productivity growth. But there’s another way of approaching the issue: How many fast-growing growing new firms would need to be generated each year to lift the economy-wide growth rate each year by one percent? …a rough calculation by analyst Robert Litan figures there about 15 billion-dollar (in sales) companies formed every year. But what if the American entrepreneurial ecosystem were so vibrant that it produced 60 such companies annually? …The big point here is that the American private sector is key to growth. No other large economy is as proficient as the US in creating high-impact startups. But it doesn’t appear that the Democratic enthusiasm for big and bold tax plans is matched by concern about unwanted trade-offs.

If you want a substantive economic critique of class-warfare tax policy, Alan Reynolds has a must-read article on the topic.

He starts by explaining why it’s important to measure how sensitive taxpayers are (the “elasticity of taxable income”) to changes in tax rates.

Elasticity of taxable income estimates are simply a relatively new summary statistic used to illustrate observed behavioral responses to past variations in marginal tax rates. They do so by examining what happened to the amount of income reported on individual tax returns, in total and at different levels of income, before and after major tax changes. …For example, if a reduced marginal tax rate produces a substantial increase in the amount of taxable income reported to the IRS, the elasticity of taxable income is high. If not, the elasticity is low. ETI incorporates effects of tax avoidance as well as effects on incentives for productive activity such as work effort, research, new business start-ups, and investment in physical and human capital.

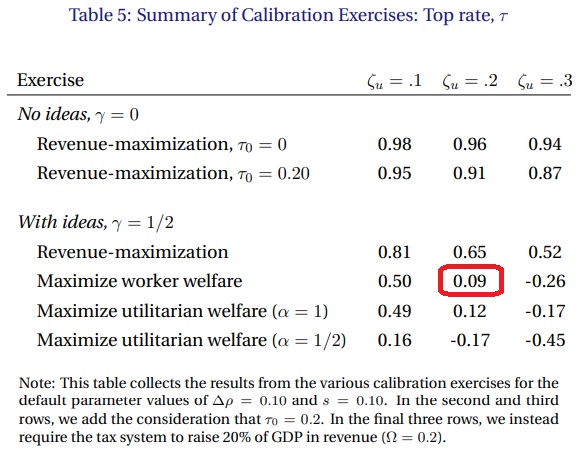
Alan then looks at some of the ETI estimates and what they imply for tax rates, though he notes that the revenue-maximizing rate is not the optimal rate.

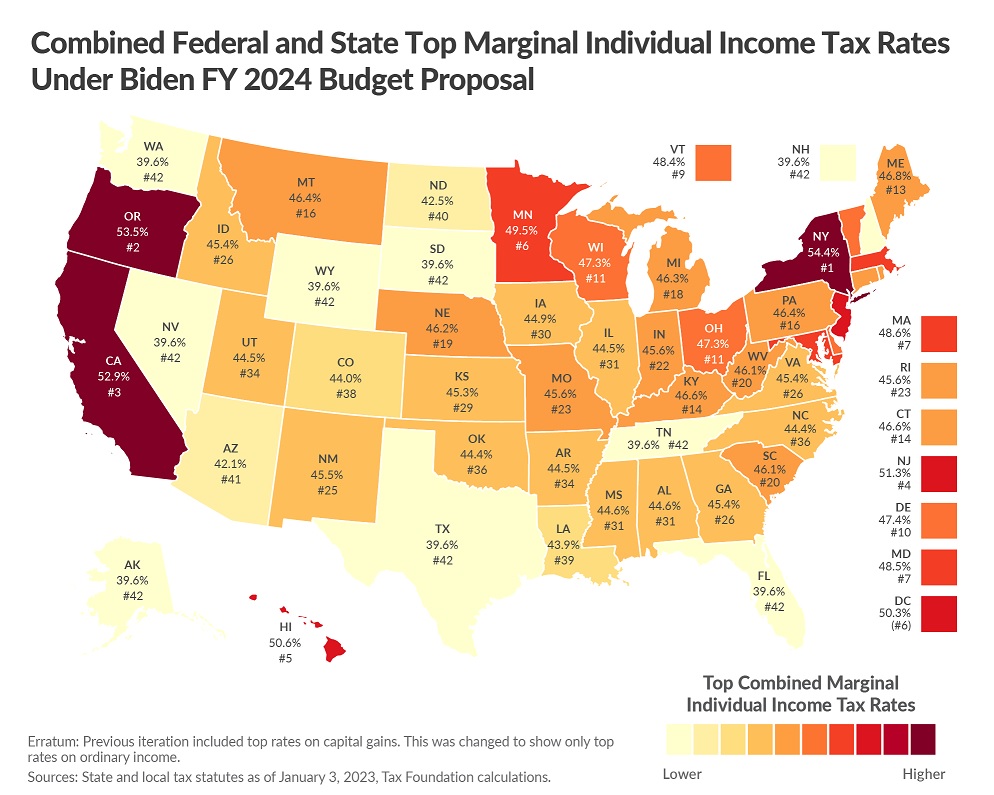
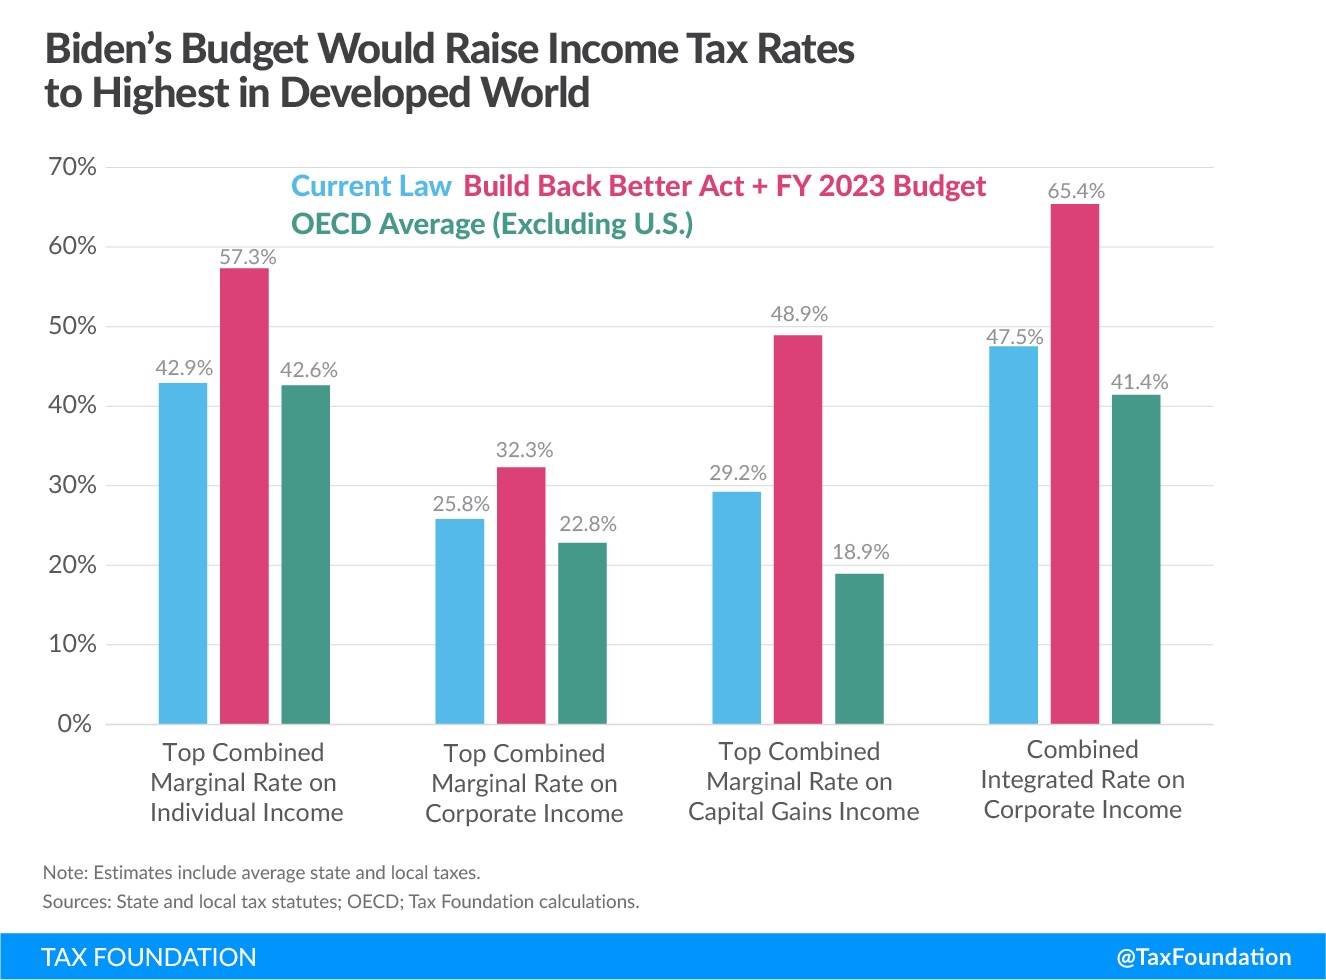
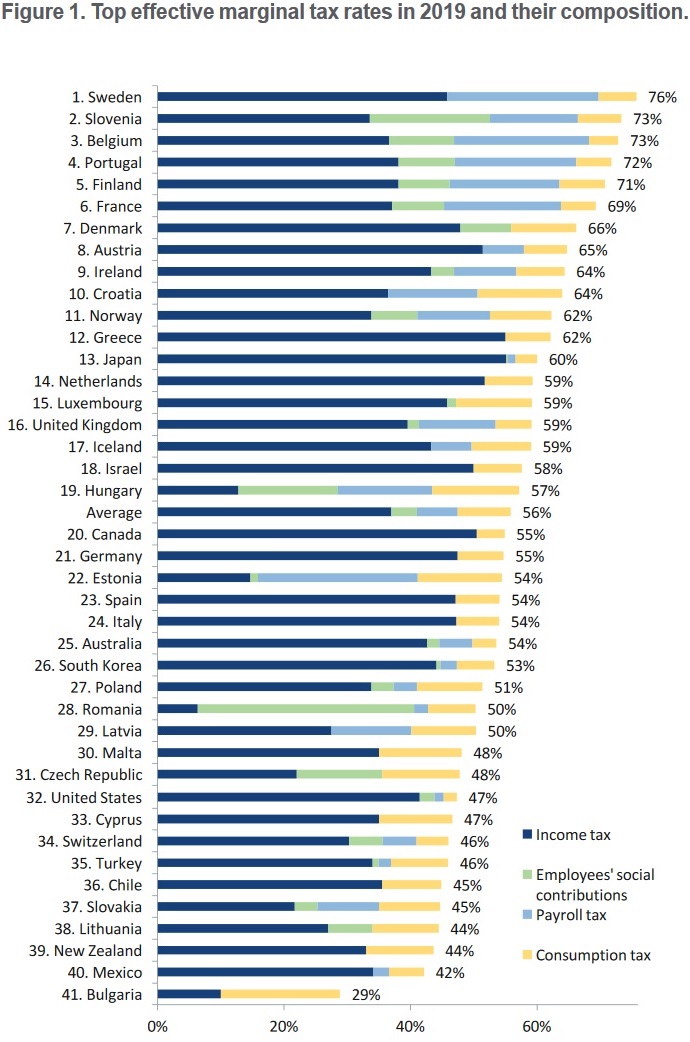
Diamond and Saez claim that, if the relevant ETI is 0.25, then the revenue-maximizing top tax rate is 73 percent. Such estimates, however, do not refer to the top federal income tax rate, …but to the combined marginal rate on income, payrolls, and sales at the federal, state, and local level. …with empirically credible changes in parameters, the Diamond-Saez formula can more easily be used to show that top U.S. federal, state, and local tax rates are already too high rather than too low. By also incorporating dynamic effects — such as incentives to invest in human capital and new ideas — more recent models estimate that the long-term revenue-maximizing top tax rate is between 22 and 49 percent… Elasticity of taxable, or perhaps gross income…can be “a sufficient statistic to approximate the deadweight loss” from tax disincentives and distortions. Although recent studies define revenue-maximization as “optimal,” Goolsbee…rightly emphasizes, “The fact that efficiency costs rise with the square of the tax rate are likely to make the optimal rate well below the revenue-maximizing rate.”

These excerpts only scratch the surface.

Alan’s article extensively discusses how high-income taxpayers are especially sensitive to high tax rates, in part because they have considerable control over the timing, level, and composition of their income.

He also reviews the empirical evidence from major shifts in tax rates last century.

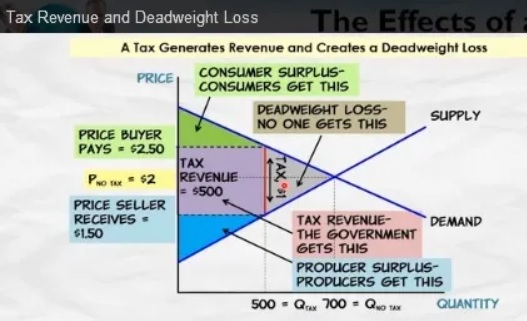
All told, his article is a devastating take-down of the left-of-center economists who have tried to justify extortionary tax rates. Simply stated, high tax rates hinder the economy, create deadweight loss, and don’t produce revenue windfalls.

That being said, I wonder whether his article will have any impact. As Kevin Williamson points out is a column for National Review, the left isn’t primarily motivated by a desire for more tax money.

Perhaps the strangest utterance of Barack Obama’s career in public office…was his 2008 claim that raising taxes on the wealthy is a moral imperative, even if the tax increase in question ended up reducing overall federal revenue. Which is to say, Obama argued that it did not matter whether a tax increase hurt the Treasury, so long as it also hurt, at least in theory and on paper, certain wealthy people. …ideally, you want a tax system with low transaction costs (meaning a low cost of compliance) and one that doesn’t distort a lot of economic activity. You want to get enough money to fund your government programs with as little disruption to life as possible. …Punitive taxes aren’t about the taxes — they’re about the punishment. That taxation should have been converted from a technical question into a moral crusade speaks to the basic failure of the progressive enterprise in the United States…the progressive demand for a Scandinavian welfare state at no cost to anybody they care about…ends up being a very difficult equation to balance, probably an impossible one. And when the numbers don’t work, there’s always cheap moralistic histrionics.

So what leads our friends on the left to pursue such misguided policies? What drives their support for punitive taxation?

Is is that they’re overflowing with compassion and concern for the poor?

Hardly.

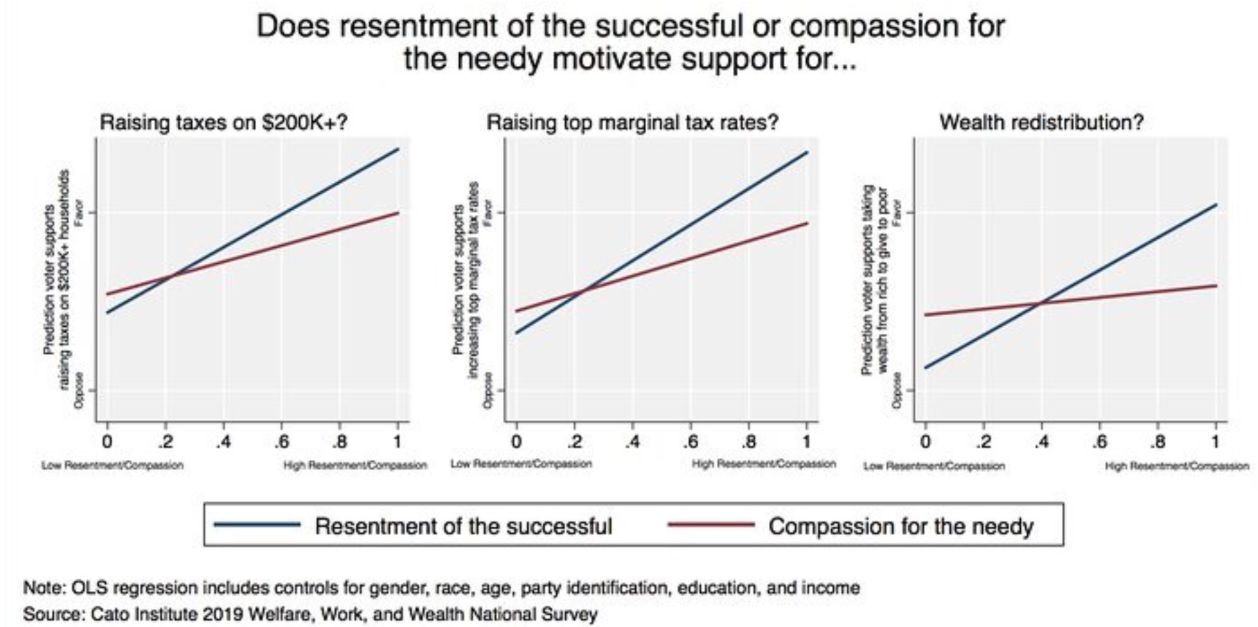
Writing for the Federalist, Emily Ekins shares some in-depth polling data that discovers that envy is the real motive.

Supporters often contend their motivation is compassion for the dispossessed… In a new study, I examine…competing explanations and ask whether envy and resentment of the successful or compassion for the needy better explain support for socialism, raising taxes on the rich, redistribution, and the like. …Statistical tests reveal resentment of the successful has about twice the effect of compassion in predicting support for increasing top marginal tax rates, wealth redistribution, hostility to capitalism, and believing billionaires should not exist. …people who agree that “very successful people sometimes need to be brought down a peg or two even if they’ve done nothing wrong” were more likely to want to raise taxes on the rich than people who agree that “I suffer from others’ sorrows.” …I ran another series of statistical tests to investigate the motivations behind the following beliefs: 1) It’s immoral for our system to allow the creation of billionaires, 2) billionaires threaten democracy, and 3) the distribution of wealth in the United States is “unjust.” Again, the statistical tests find that resentment against successful people is more influential than compassion in predicting each of these three beliefs. In fact, not only is resentment more impactful, but compassionate people are significantly less likely to agree that it’s immoral for our system to allow people to become billionaires.

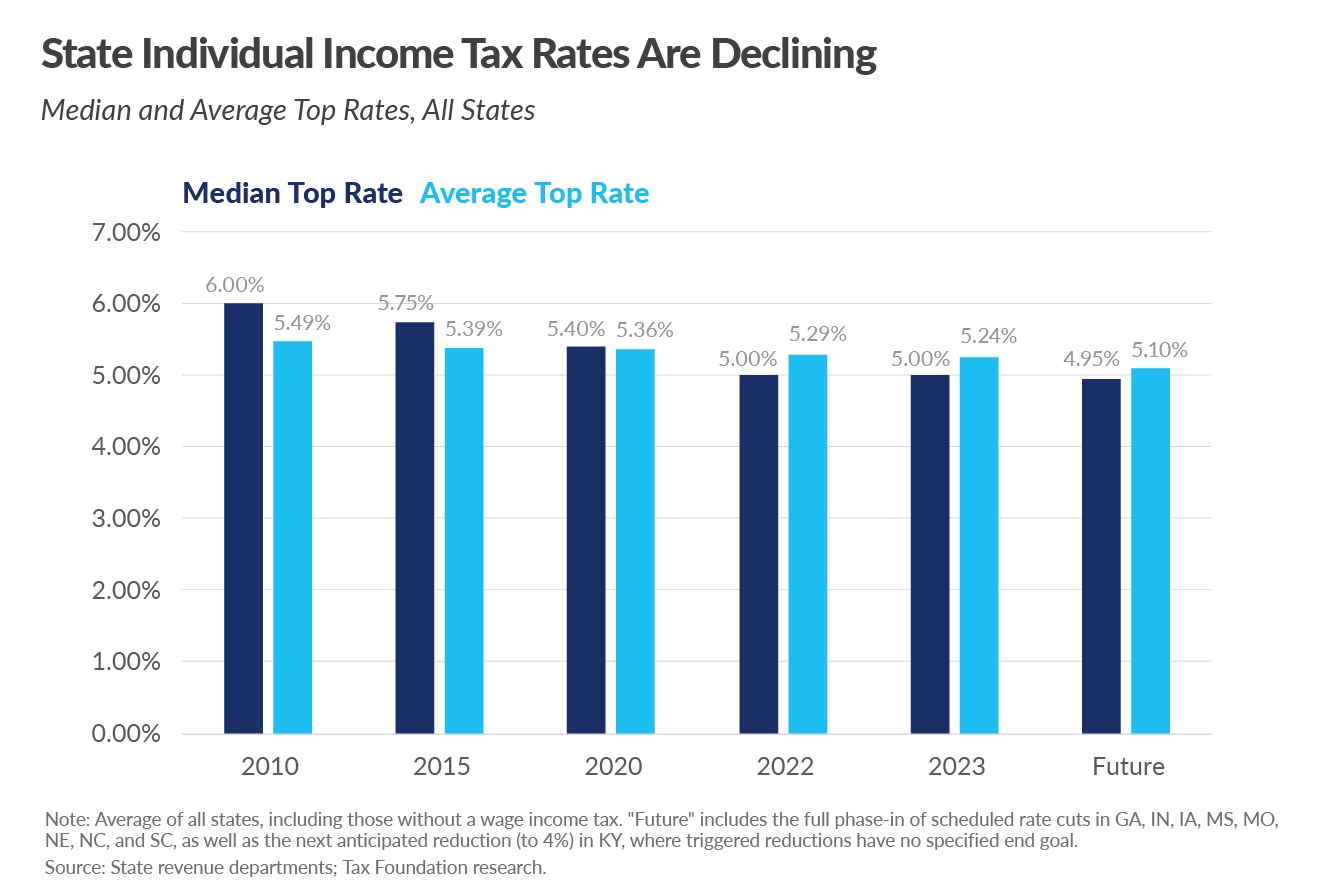
Here’s one of her charts, showing that resentment is far and away the biggest driver of support for class-warfare proposals.

These numbers are quite depressing.

They suggest that no amount of factual analysis or hard data will have any effect on the debate.

And there is polling data to back up Emily’s statistical analysis. Heck, some folks on the left openly assert that envy should be the basis for tax policy.

In other words, Deroy Murdock and Margaret Thatcher weren’t creating imaginary enemies.

P.S. If you think Kevin Williamson was somehow mischaracterizing or exaggerating Obama’s spiteful position on tax policy, just watch this video.

Read Full Post »

The New York Times is going overboard with disingenuous columns.

A few days ago, I pointed out the many errors in David Leonhardt’s column extolling the wealth tax.

I also explained back in August how Steven Greenhouse butchered the data when he condemned the American economy.

And Paul Krugman is infamous for his creative writing.

But Mr. Leonhardt is on a roll. He has a new column promoting class warfare tax policy.

Almost a decade ago, Warren Buffett made a claim that would become famous. He said that he paid a lower tax rate than his secretary, thanks to the many loopholes and deductions that benefit the wealthy.oct-8-19-nyt 
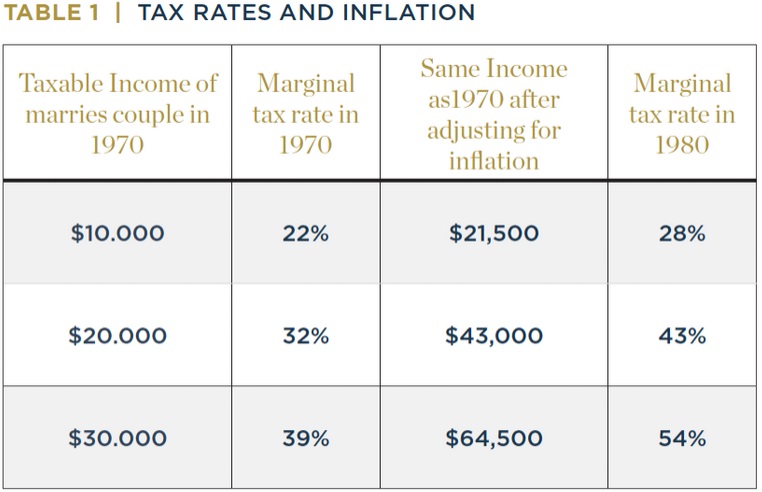
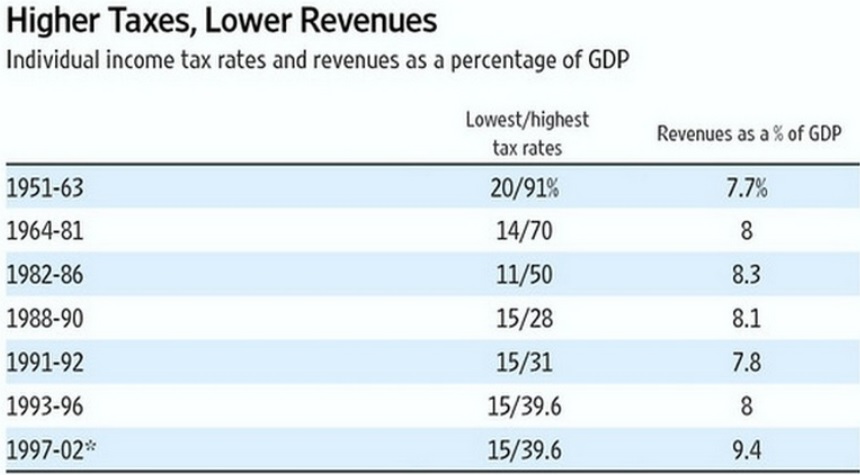
…“Is it the norm?” the fact-checking outfit Politifact asked. “No.” Time for an update: It’s the norm now. …the 400 wealthiest Americans last year paid a lower total tax rate — spanning federal, state and local taxes — than any other income group, according to newly released data. …That’s a sharp change from the 1950s and 1960s, when the wealthy paid vastly higher tax rates than the middle class or poor.

Here’s the supposed proof for Leonhardt’s claim, which is based on a new book from two professors at the University of California at Berkeley, Emmanuel Saez and Gabriel Zucman.

Here are the tax rates from 1950.

oct-8-19-1950

And here are the tax rates from last year, showing the combined effect of the Kennedy tax cut, the Reagan tax cuts, the Bush tax cuts, and the Trump tax cut (as well as the Nixon tax increase, the Clinton tax increase, and the Obama tax increase).

oct-8-19-2018

So is Leonhardt (channeling Saez and Zucman) correct?

Are these charts evidence of a horrid and unfair system?

Nope, not in the slightest.

But this data is evidence of dodgy analysis by Leonhardt and the people he cites.

First and foremost, the charts conveniently omit the fact that dividends and capital gains earned by high-income taxpayers also are subject to the corporate income tax.

Even the left-leaning Organization for Economic Cooperation and Development acknowledges that both layers of tax should be included when measuring the effective tax rate on households.

Indeed, this is why Warren Buffett was grossly wrong when claiming he paid a lower tax rate than his secretary.

But there’s also another big problem. There’s a huge difference between high tax rates and high tax revenues.

feb-4-19-perry
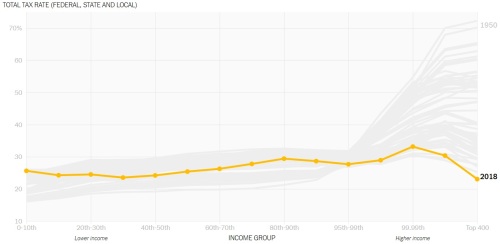
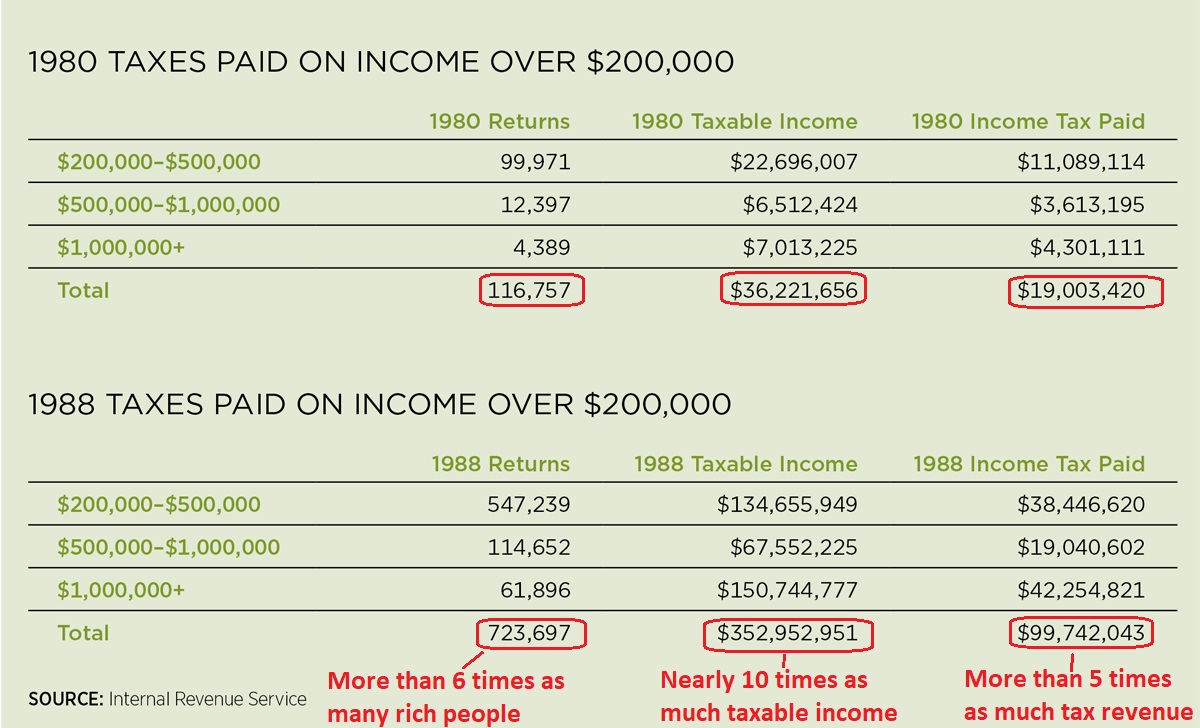
Simply stated, the rich didn’t pay a lot of tax when rates were extortionary because they can choose not to earn and declare much income.

Indeed, there were only eight taxpayers in 1960 who paid the top tax rates of 91 percent.

Today, by contrast, upper-income taxpayers are paying an overwhelming share of the tax burden.

It’s especially worth noting that tax collections from the rich skyrocketed when Reagan slashed the top tax rate in the 1980s.

Let’s close by pointing out that Saez and Zucman are promoting a very radical tax agenda.

Saez and Zucman sketch out a modern progressive tax code. The overall tax rate on the richest 1 percent would roughly double, to about 60 percent. The tax increases would bring in about $750 billion a year, or 4 percent of G.D.P…. One crucial part of the agenda is a minimum global corporate tax of at least 25 percent. …Saez and Zucman also favor a wealth tax

Punitive income tax rates, higher corporate tax rates, and a confiscatory wealth tax.

Does anybody think copying France is a recipe for success?

P.S. I pointed out that Zucman and Saez make some untenable assumptions when trying to justify how a wealth tax won’t hurt the economy.

P.P.S. It’s also worth remembering that the income of rich taxpayers will be subject to the death tax as well, which means Leonhardt’s charts are doubly misleading.

Read Full Post »

At the risk of over-simplifying, the difference between “supply-side economics” and “demand-side economics” is that the former is based on microeconomics (incentives, price theory) while the latter is based on macroeconomics (aggregate demand, Keynesianism).

When discussing the incentive-driven supply-side approach, I often focus on two key points.

  • Marginal tax rates matter more than average tax rates because the incentive to earn additional income (rather than enjoying leisure) is determined by whether the government grabs a small, medium, or large share of any extra earnings.
  • Some taxpayers such as investors, entrepreneurs, and business owners are especially sensitive to changes in marginal tax rates because they have considerable control over the timing, level, and composition of their income.

Today, let’s review some new research from Spain’s central bank confirms these supply-side insights.

Here’s what the authors investigated.

The impact of personal income taxes on the economic decisions of individuals is a key empirical question with important implications for the optimal design of tax policy. …the modern public finance literature has devoted significant efforts to study behavioral responses to changes in taxes on reported taxable income… Most of this work focuses on the elasticity of taxable income (ETI), which captures a broad set of real and reporting behavioral responses to taxation. Indeed, reported taxable income reflects not only individuals’ decisions on hours worked, but also work effort and career choices as well as the results of investment and entrepreneurship activities. Besides these real responses, the ETI also captures tax evasion and avoidance decisions of individuals to reduce their tax bill.

By the way, “elasticity” is econ-speak for sensitivity. In other words, if there’s high elasticity, it means taxpayers are very responsive to a change in tax rates.

Anyhow, here’s how authors designed their study.

In this paper, we estimate the elasticity of taxable income in Spain, an interesting country to study because during the last two decades it has implemented several major personal income tax reforms… In the empirical analysis, we use an administrative panel dataset of income tax returns… We calculate the MTR as a weighted average of the MTR applicable to each income source (labor, financial capital, real-estate capital, business income and capital gains).

You can see in Figure 1 that the 2003 reform was good for taxpayers and the 2012 reform was bad for taxpayers.

If nothing else, though, these changes created the opportunity for scholars to measure how taxpayers respond.

And here are the results.

We obtain estimates of the ETI around 0.35 using the Gruberand Saez (2002) estimation method, 0.54 using Kleven and Schultz (2014)’s method and 0.64 using Weber (2014)’s method. …In addition to the average estimates of the ETI, we analyze heterogeneous responses across groups of taxpayers and sources of income. …As expected, stronger responses are documented for groups of taxpayers with higher ability to respond. In particular, self-employed taxpayers have a higher ETI than wage employees, while real-estate capital and business income respond more strongly than labor income. …we find large responses on the tax deductions margin, especially private pension contributions.

In other words, taxpayers do respond to changes in tax policy.

And some taxpayers are very sensitive (high elasticity) to those changes.

Here’s Table 6 from the study. Much of it will be incomprehensible if you’re not familiar with econometrics. But all that matters is that I circled (in red) the measures of how elasticities vary based on the type of income (larger numbers mean more sensitive).

I’ll close with a very relevant observation about American fiscal policy.

Currently, upper-income taxpayers finance the vast majority of America’s medium-sized welfare state.

But what if the United States had a large-sized welfare state, like the ones that burden many European nations?

If you review the data, those large-sized welfare states are financed with stifling tax burdens on lower-income and middle-class taxpayers. Politicians in Europe learned that they couldn’t squeeze enough money out of the rich (in large part because of high elasticities).

Indeed, I wrote early this year about how taxes are confiscating the lion’s share of the income earned by ordinary workers in Spain.

And if we adopt the expanded welfare state envisioned by Bernie Sanders, Alexandria Ocasio-Cortez, and Kamala Harris, the same thing will happen to American workers.

P.S. I admire how Spanish taxpayers have figured out ways of escaping the tax net.

P.P.S. There’s also evidence about the impact of Spain’s corporate tax.

Read Full Post »

Assuming the goal is faster growth and higher living standards, there are three core principles of good tax policy.

You could call this list the Holy Trinity of supply-side economics. Simply stated, incentives matter, so it makes no sense for government to discourage the things that make a nation more prosperous.

Regarding low marginal tax rates, my left-leaning friends sometimes dismiss the importance of this principle by pointing out that they don’t pay much attention to their marginal tax rates.

I can sympathize with their skepticism. When I was first learning about public finance and studying supply-and-demand curves showing deadweight loss, I also wondered about the supply-side claim that marginal tax rates mattered. Even after I started working, I had doubts. Would I somehow work harder if my tax rate fell? Or goof off if my tax rate went up? It didn’t make much sense.

What I didn’t recognize, however, is that I was looking at the issue from the perspective of someone working a standard, 9-to-5 job with a modest income. And it is true that such workers are not very responsive (especially in the short run) to changes in tax rates.

In the real world, though, there are lots of people who don’t fit that profile. They have jobs that give them substantial control over the timing, level, and composition of their income.

And these people – such as business owners, professionals, second earners, investors, and entrepreneurs – often are very responsive to changes in marginal tax rates.

We have a new example of this phenomenon. Check out these excerpts from a story in the U.K.-based Times.

About three quarters of GPs and hospital consultants have cut or are planning to cut their hours… About 42 per cent of family doctors and 30 per cent of consultants have reduced their working times already, claiming that they are being financially penalised the more they work. A further 34 per cent and 40 per cent respectively have confirmed that they plan to reduce their hours in the coming months… The government has launched an urgent consultation over the issue, which is the result of changes to pension rules limiting the amount that those earning £110,000 or more can pay into their pensions before they are hit with a large tax bill.

In other words, high tax rates have made leisure more attractive than work. Why work long hours, after all, if the tax authority is the biggest beneficiary?

There are also indirect victims of these high tax rates.

Last month figures from NHS Providers, which represents hospitals, showed that waiting lists had climbed by up to 50 per cent since April as doctors stopped taking on extra shifts to avoid the financial penalties. Richard Vautrey, chairman of the BMA GPs’ committee, said: “These results show the extent to which GPs are being forced to reduce their hours or indeed leave the profession altogether because of pension taxes. …swift and decisive action is needed from the government to end this shambolic situation and to limit the damage that a punitive pensions taxation system is inflicting on doctors, their patients and across the NHS as a whole.”

The U.K.’s government-run health system already has plenty of problems, including long wait times and denial of care. The last thing it needs is for doctors and other professionals to cut back their hours because politicians are too greedy.

The moral of the story is that tax rates matter. Depending on the type of person, they can matter a lot.

This doesn’t mean tax rates need to be zero (though I like that idea).

It simply means that taxes impose costs, and those costs become increasingly apparent as tax rates climb.

P.S. If you want a horror story about marginal tax rates, check out what happened to Cam Newton, the quarterback of the Carolina Panthers.

Read Full Post »

I’m not a big fan of the current tax system. I’m also not supportive of America’s bankrupt Social Security system.

The country would be much better off with fundamental reform of both the tax system and Social Security.

Some groups will be reap especially large rewards if that happens.

For instance, a new report from the National Bureau of Economic Research examines the impact of taxes and Social Security on female labor supply.

…we ask to what extent the fact that taxes and old age Social Security benefits depend on one’s marital status discourages female labor supply and affect welfare. …as couples file taxes jointly, the secondary earner in the married couple faces a higher marginal tax rate, which tends to discourage their labor supply. …reduced labor supply does not necessarily imply lower Social Security benefits. Since women have historically been the secondary earners, both provisions tend to discourage female labor supply… to what extent are these disincentives holding it back? …We estimate our dynamic structural model using…data from the Panel Study of Income Dynamics (PSID) and from the Health and Retirement Study (HRS) for the cohort born in 1941-1945 (the “1945” cohort). …we also estimate our model for the 1951-1955 cohort (the “1955” cohort),

This chart from the study shows that married women face a tax penalty – i.e., higher marginal tax rates – compared to single women.

The main takeaway is that this marriage penalty, combined with discriminatory features of Social Security, discourages women from working.

How big is the effect?

The report, authored by Margherita Borella, Mariacristina De Nardi, and Fang Yang, finds that government policies have a significant adverse impact on labor-force participation.

For the 1945 cohort, we find that Social Security spousal and survivor benefits and the current structure of joint income taxation provide strong disincentives to work to married women and single women who expect to get married… For instance, the elimination of all of these marriage-based rules raises participation at age 25 by over 20 percentage points for married women and by five percentage points for single women. At age 45, participation for these groups is, respectively, still 15 and 3 percentage point higher without these marital benefits provisions. In addition, these marriage-based rules reduce the participation of married men starting at age 55, resulting in a participation that is 8 percentage points lower by age 65. Finally, for these cohorts, these marital provisions decrease the savings of married couples by 20.3% at age 66.1 In terms of welfare, abolishing these marital provisions would benefit…over ninety percent of the people in this cohort. …We find that the effects for the 1955 cohort on participation, wages, earnings, and savings are large and similar to those in the 1945 cohort, thus indicating that the effects of marriage-related provisions are large also for cohorts in which the labor participation of married women is higher.

What if these discriminatory policies were fixed?

It depends, of course, on how the problems are addressed.

The report finds that a budget-neutral approach (i.e., returning any budgetary windfall to taxpayers) would be a significant net plus.

…there would also be large aggregate gains from removing marriage related provisions and reducing the income tax… Overall our policy experiments thus indicate that removing marriage related taxes and Social Security benefits would increase female labor supply and the welfare of the majority of the populations.

Here are a couple of charts from the study, showing both an increase in labor supply and an increase in labor income.

I’ll close with a final point about family structure.

Some people will argue that the current penalties in the tax code and Social Security system are desirable because they don’t punish stay-at-home moms as much as working women.

That’s a very strange argument. Sort of like the folks on the left, including the IMF, who advocate policies that hurt the poor if rich people suffer even more.

P.S. If there’s reform, older people also will enjoy significant gains.

Read Full Post »

A couple of weeks ago, I used a story about a local tax issue in Washington, DC, to make an important point about how new tax increases cause more damage than previous tax increases because “deadweight losses” increase geometrically rather than arithmetically.

Simply stated, if a tax of X does Y amount of damage, then a tax of 2X will do a lot more damage than 2Y.

This is the core economic reason why even left-leaning international bureaucracies agree that class-warfare taxes are so destructive. When you take a high tax rate and make it even higher, the damage grows exponentially.

As such, I was very interested to see a new study on this topic from the World Bank. It starts by noting that higher tax rates are the wrong way to address fiscal shortfalls.

…studies have used the narrative approach for individual or multi-country analyses (in all cases, focusing solely on industrial economies, and mostly on industrial European countries). These studies find large negative tax multipliers, ranging between 2 and 5. This recent consensus pointing to large negative tax multipliers, especially in industrial European countries, naturally entails important policy prescriptions. For example, as part of a more comprehensive series of papers focusing on spending and tax multipliers, Alesina, Favero, and Giavazzi (2015) point that policies based upon spending cuts are much less costly in terms of short run output losses than tax based adjustments.

The four authors used data on value-added taxes to investigate whether higher tax rates did more damage or less damage in developing nations.

A natural question is whether large negative tax multipliers are a robust empirical regularity… In order to answer this highly relevant academic and policy question, one would ideally need to conduct a study using a more global sample including industrial and, particularly, developing countries. …This paper takes on this challenge by focusing on 51 countries (21 industrial and 30 developing) for the period 1970-2014. …we focus our efforts on building a new series for quarterly standard value-added tax rates (henceforth VAT rates). …We identify a total of 96 VAT rate changes in 35 countries (18 industrial and 17 developing).

The economists found that VAT increases did the most damage in developing nations.

…when splitting the sample into industrial European economies and the rest of countries, we find tax multipliers of 3:6 and 1:2, respectively. While the tax multiplier in industrial European economies is quite negative and statistically significant (in line with recent studies), it is about 3 times smaller (in absolute value) and borderline statistically significant for the rest of countries.

Here’s a chart showing the comparison.

Now here’s the part that merits close attention.

The study confirms that the deadweight loss of VAT hikes is higher in developed nations because the initial tax burden is higher.

Based on different types of macroeconomic models (which in turn rely on different mechanisms), the output effect of tax changes is expected to be small at low initial levels of taxation but exponentially larger when initial tax levels are high. Therefore, the distortions and disincentives imposed by taxation on economic activity are directly, and non-linearly, related to the level of tax rates. By the same token, for a given level of initial tax rates, larger tax rate changes have larger tax multipliers. …In line with theoretical distortionary and disincentive-based arguments, we find, using our novel worldwide narrative, that the effect of tax changes on output is indeed highly non-linear. Our empirical findings show that the tax multiplier is essentially zero under relatively low/moderate initial tax rate levels and more negative as the initial tax rate and the size of the change in the tax rate increase. …This evidence strongly supports distortionary and disincentive-based arguments regarding a nonlinear effect of tax rate changes on economic activity…the economy will inevitably suffer when taxes are increased at higher initial tax rate levels.

What makes these finding especially powerful is that value-added taxes are less destructive than income taxes on a per-dollar-raised basis.

So if taking a high VAT rate and making it even higher causes a disproportionate amount of economic damage, then imagine how destructive it is to increase top income tax rates.

P.S. The fact that a VAT is less destructive than an income tax is definitely not an argument for enacting a VAT. That would be akin to arguing that it would be fun to break your wrist because that wouldn’t hurt as much as the broken leg you already have.

I’ve even dealt with people who actually argue that a VAT isn’t economically destructive because it imposes the same tax on current consumption and future consumption. I agree with them that it is a good idea to avoid double taxation of saving and investment, but that doesn’t change the fact that a VAT increases the wedge between pre-tax income and post-tax consumption.

And that means less incentive to earn income in the first place.

Which is confirmed by the study.

Panels A and B in Figure 18 show the relationship between the VAT rate a and the perceived effect of taxes on incentives to work and invest, respectively, for a sample of 123 countries for the year 2014. Supporting our previous findings, the relationship is highly non-linear. While the perceived effect of taxes on the incentives to work and invest barely changes as VAT rates increase at low/moderate levels (approximately until the VAT rate reaches 14 percent), it falls rapidly for high levels of VAT rates.

Here’s the relevant chart from the report.

The moral of the story is that all tax increases are misguided, but class-warfare taxes wreak the most economic havoc.

P.S. Not everyone understands this common-sense observation. For instance, the bureaucrats at the Congressional Budget Office basically argued back in 2010 that a 100 percent tax rate was the way to maximize growth.

Read Full Post »

When I write about the economics of fiscal policy and need to give people an easy-to-understand explanation on how government spending affects growth, I share my four-part video series.

But. other than a much-too-short primer on growth and taxation from 2016, I don’t have something similar for tax policy. So I have to direct people to various columns about marginal tax rates, double taxation, tax favoritism, tax reform, corporate taxation, and tax competition.

Today’s column isn’t going to be a comprehensive analysis of taxes and growth, but it is going to augment the 2016 primer by taking a close look at how some taxes are more destructive than others.

And what makes today’s column noteworthy is that I’ll be citing the work of left-leaning international bureaucracies.

Let’s look at a study from the OECD.

…taxes…affect the decisions of households to save, supply labour and invest in human capital, the decisions of firms to produce, create jobs, invest and innovate, as well as the choice of savings channels and assets by investors. What matters for these decisions is not only the level of taxes but also the way in which different tax instruments are designed and combined to generate revenues…investigating how tax structures could best be designed to promote economic growth is a key issue for tax policy making. … this study looks at consequences of taxes for both GDP per capita levels and their transitional growth rates.

For all intents and purposes, the economists at the OECD wanted to learn more about how taxes distort the quantity and quality of labor and capital, as illustrated by this flowchart from the report.

Here are the main findings (some of which I cited, in an incidental fashion, back in 2014).

The reviewed evidence and the empirical work suggests a “tax and growth ranking” with recurrent taxes on immovable property being the least distortive tax instrument in terms of reducing long-run GDP per capita, followed by consumption taxes (and other property taxes), personal income taxes and corporate income taxes. …relying less on corporate income relative to personal income taxes could increase efficiency. …Focusing on personal income taxation, there is also evidence that flattening the tax schedule could be beneficial for GDP per capita, notably by favouring entrepreneurship. …Estimates in this study point to adverse effects of highly progressive income tax schedules on GDP per capita through both lower labour utilisation and lower productivity… a reduction in the top marginal tax rate is found to raise productivity in industries with potentially high rates of enterprise creation. …Corporate income taxes appear to have a particularly negative impact on GDP per capita.”

Here’s how the study presented the findings. I might quibble with some of the conclusions, but it’s worth noting all the minuses in the columns for marginal tax, progressivity, top rates, dividends, capital gains, and corporate tax.

This is all based on data from relatively prosperous countries.

A new study from the International Monetary Fund, which looks at low-income nations rather than high-income nations, reaches the same conclusion.

The average tax to GDP ratio in low-income countries is 15% compared to that of 30% in advanced economies. Meanwhile, these countries are also those that are in most need of fiscal space for sustainable and inclusive growth. In the past two decades, low-income countries have made substantial efforts in strengthening revenue mobilization. …what is the most desirable tax instrument for fiscal consolidation that balances the efficiency and equity concerns. In this paper, we study quantitatively the macroeconomic and distributional impacts of different tax instruments for low-income countries.

It’s galling that the IMF report implies that there’s a “need for fiscal space” and refers to higher tax burdens as “strengthening revenue mobilization.”

But I assume some of that rhetoric was added at the direction of the political types.

The economists who crunched the numbers produced results that confirm some of the essential principles of supply-side economics.

…we conduct steady state comparison across revenue mobilization schemes where an additional tax revenues equal to 2% GDP in the benchmark economy are raised by VAT, PIT, and CIT respectively. Our quantitative results show that across the three taxes, VAT leads to the least output and consumption losses of respectively 1.8% and 4% due to its non-distorting feature… Overall, we find that among the three taxes, VAT incurs the lowest efficiency costs in terms of aggregate output and consumption, but it could be very regressive… CIT, on the other hand, though causes larger efficiency costs, but has considerable better inequality implications. PIT, however, deteriorates both the economic efficiency and equity, thus is the most detrimental instrument.

Here’s the most important chart from the study. It shows that all taxes undermine prosperity, but that personal income taxes (grey bar) and corporate income tax (white bar) do the most damage.

I’ll close with two observations.

First, these two studies are further confirmation of my observation that many – perhaps most – economists at international bureaucracies generate sensible analysis. They must be very frustrated that their advice is so frequently ignored by the political appointees who push for statist policies.

Second, some well-meaning people look at this type of research and conclude that it would be okay if politicians in America imposed a value-added tax. They overlook that a VAT is bad for growth and are naive if they think a VAT somehow will lead to lower income tax burdens.

Read Full Post »

In the past few years, I’ve bolstered the case for lower tax rates by citing country-specific research from Italy, Australia, Germany, Sweden, Israel, Portugal, South Africa, the United States, Denmark, Russia, France, and the United Kingdom.

Now let’s look to the north.

Two Canadian scholars investigated the impact of provincial tax policy changes in Canada. Here are the issues they investigated.

The tax cuts introduced by the provincial government of British Columbia (BC) in 2001 are an important example… The tax reform was introduced in two stages. In an attempt to make the BC’s economy more competitive, the government reduced the corporate income tax (CIT) rate initially by 3.0 percentage points with an additional 1.5 percentage point reduction in 2005. The government also cut the personal income tax (PIT) rate by about 25 percent. …The Canadian provincial governments’ tax policies provide a good natural experiment for the study of the effects of tax rates on growth. …The principal objective of this paper is to investigate the effects of taxation on growth using data from 10 Canadian provinces during 1977-2006. We also explore the relationship between tax rates and total tax revenue. We use the empirical results to assess the revenue and growth rate effects of the 2001 British Columbia’s incentive-based tax cuts.

And here are the headline results.

The results of this paper indicate that higher taxes are associated with lower private investment and slower economic growth. Our analysis suggests that a 10 percentage point cut in the statutory corporate income tax rate is associated with a temporary 1 to 2 percentage point increase in per capita GDP growth rate. Similarly, a 10 percentage point reduction in the top marginal personal income tax rate is related to a temporary one percentage point increase in the growth rate. … The results suggest that the tax cuts can result in significant long-run output gains. In particular, our simulation results indicate that the 4.5 percentage point CIT rate cut will boost the long-run GDP per capita in BC by 18 percent compared to the level that would have prevailed in the absence of the CIT tax cut. …The result indicates that a 10 percentage point reduction in the corporate marginal tax rate is associated with a 5.76 percentage point increase in the private investment to GDP ratio. Similarly, a 10 percentage point cut in the top personal income tax rate is related to a 5.96 percentage point rise in the private investment to GDP ratio.

The authors look specifically at what happened when British Columbia adopted supply-side tax reforms.

…In this section, we attempt to gauge the magnitude of the growth effects of the CIT and PIT rate cuts in BC in 2001… the growth rate effect of the tax cut is temporary, but long-lasting. Figure 2 shows the output with the CIT rate cut relative to the no-tax cut output over the 120 years horizon. Our model indicates that in the long-run per capita output would be 17.6 percent higher with the 4.5 percentage point CIT rate cut. …We have used a similar procedure to calculate the effects of the five percentage point reduction in the PIT rate in BC. …The solid line in Figure 3 shows simulated relative output with the PIT rate cut compared to the output with the base line growth rate of 1.275. Our model indicates that per capita output would be 7.6 percent higher in the long run with the five percentage point PIT rate cut.

Here’s their estimate of the long-run benefits of a lower corporate tax rate.

And here’s what they found when estimating the pro-growth impact of a lower tax rate on households.

In both cases, lower tax rates lead to more economic output.

Which means that lower tax rates result in more taxable income (the core premise of the Laffer Curve).

The amount of tax revenue that a provincial government collects depends on both its tax rates and tax bases. Thus one major concern that policy makers have in cutting tax rates is the implication of tax cuts for government tax receipts. …The true cost of raising a tax rate to taxpayers is not just the direct cost of but also the loss of output caused by changes in taxpayers’ economic decisions. The Marginal Cost of Public Funds (MCF) measures the loss created by the additional distortion in the allocation of resources when an additional dollar of tax revenue is raised through a tax rate increase. …if…government is on the negatively-sloped section of its present value revenue Laffer curve…, a tax rate reduction would increase the present value of the government’s tax revenues.

And the Canadian research determined that, measured by present value, the lower corporate tax rate will increase tax revenue.

…computations indicate that including the growth rate effects substantially raises our view of the MCF for a PIT. Our computations therefore support previous analysis which indicates that it is much more costly to raise revenue through a PIT rate increase than through a sales tax rate increase and that there are potentially large efficiency gains if a province switches from an income tax to a sales tax. When the growth rate effects of the CIT are included in the analysis, …a CIT rate reduction would increase the present value of the government’s tax revenues. A CIT rate cut would make taxpayers better off and the government would have more funds to spend on public services or cut other taxes. Therefore our computations provide strong support for cutting corporate income tax rates.

Needless to say, if faced with the choice between “more funds to spend” and “cut other taxes,” I greatly prefer the latter. Which is why I worry that people learn the wrong lesson when I point out that the rich paid a lot more tax after Reagan lowered the top rate in the 1980s.

The goal is to generate more prosperity for people, not more revenue for government. So if a tax cut produces more revenue, the immediate response should be to drop the rate even further.

But I’m digressing. The point of today’s column is simply to augment my collection of case studies showing that better tax policy produces better economic performance.

P.S. The research from Canada also helps to explain the positive effect of decentralization and federalism. British Columbia had the leeway to adopt supply-side reforms because the central government in Canada is somewhat limited in size and scope. That’s even more true in Switzerland (where we see the best results), and somewhat true about the United States.

Read Full Post »

Three years ago, I shared two videos explaining taxation and deadweight loss (i.e., why high tax burdens are bad for prosperity).

Today, I have one video on another important principle of taxation. To set the stage for this discussion, here are two simple definitions

  • The “average tax rate” is the share of your income taken by government. If you earn $50,000 and your total tax bill is $10,000, then your average tax rate is 20 percent.
  • The “marginal tax rate” is the amount of money the government takes if you earn more income. In other words, the additional amount government would take if your income rose from $50,000 to $51,000.

These definitions are important because we want to contemplate why and how a tax cut helps an economy.

But let’s start by explaining that a tax cut doesn’t boost growth because people have more money to spend.

I want people to keep more of their earnings, to be sure, but that Keynesian-style explanation overlooks the fact that the additional “spending power” for taxpayers is offset when the government borrows more money to finance the tax cut.

Instead, when thinking about taxes and prosperity, here are the three things you need to know.

1. Economic growth occurs when we increase the quantity and/or quality of labor and capital.

2. Taxes increase the cost of whatever is being taxed, and people respond by doing less of whatever is being taxed.

3. To get more prosperity, lower tax rates on productive behaviors such as work, saving, investment, and entrepreneurship.

All this is completely correct, but there’s one additional point that needs to be stressed.

4. The tax rate that matters is the marginal tax rate, not the average tax rate.

I discussed the importance of marginal tax rates in 2016, pointing out that Cam Newton of the Carolina Panthers was going to lose the Super Bowl (from a financial perspective) because the additional tax he was going to pay was going to exceed the additional income he would earn. In other words, his marginal tax rate was more than 100 percent.

Mon Dieu!

But I also included an example that’s more relevant to the rest of us, looking at our aforementioned hypothetical taxpayer with a 20 percent average tax rate on annual earnings of $50,000. I asked about incentives for this taxpayer to earn more money if the marginal tax rate on additional income was 0 percent, 20 percent, or 100 percent.

Needless to say, as shown in this expanded illustration, the incentive to earn $51,000 will be nonexistent if all of the additional $1,000 goes to government.

That’s why “supply-side economics” is focused on marginal tax rates. If we want more productive behavior, we want the lowest-possible marginal tax rates so people have the greatest-possible incentive to generate more prosperity.

Here’s a very short video primer on this issue.

One very important implication of this insight is that not all tax cuts (or tax increases) are created equal. For instance, as I explained in a three-part series (here, here, and here), there will be very little change in incentives for productive activity if the government gives you a tax credit because you have kids.

But if the government reduces the top tax rate or lowers the tax bias against saving and investment, the incentive for additional productive behavior will be significant.

And this helps to explain why the country enjoyed such positive results from the supply-side changes to tax policy in the 1920s, 1960s, and 1980s.

Let’s close with some good news (at least relatively speaking) for American readers. Compared to other industrialized countries, top marginal tax rates in the United States are not overly punitive.

Admittedly, this is damning with faint praise. Our tax system is very unfriendly if you compare it to Monaco, Hong Kong, or Bermuda.

But at least we’re not France, where there’s a strong argument to be made that the national sport is taxation rather than soccer.

P.S. I’m not saying tax preferences for kids are wrong. But I am saying they’re not pro-growth.

P.P.S. I mentioned above that Cam Newton – based on his personal finances – lost the Super Bowl even before the opening kickoff. Well, there’s scholarly evidence that teams in high-tax states actually win fewer games.

P.P.P.S. Today’s analysis focuses on the individual income tax, but this analysis also applies to corporate taxation. A company with clever lawyers and accountants may have the ability to lower its average tax rate, but the marginal tax rate is what drives the incentive to earn more income. Which is why reducing the federal corporate rate from 35 percent to 21 percent was the best part of last year’s tax bill.

Read Full Post »

I strongly applauded the tax reform plan that was enacted in December, especially the lower corporate tax rate and the limit on the deduction for state and local taxes.

But I’m not satisfied. Our long-run goal should be fundamental tax reform. And that means replacing the current system with a simple and fair flat tax.

And the recent tax plan only took a small step in that direction. How small? Well, the Tax Foundation just calculated that it only improved the United States from #30 to #25 in their International Tax Competitiveness Ranking. In other words, we have a long way to go before we catch up to Estonia.


It’s possible, of course, to apply different weights and come up with a different list. I think the Tax Foundation’s numbers could be improved, for instance, by including a measure of the aggregate tax burden. And that presumably would boost the U.S. score.

But the fact would remain that the U.S. score would be depressingly low. In other words, the internal revenue code is still a self-imposed wound and huge improvements are still necessary.

That’s why we need another round of tax reform, based on the three core principles of good tax policy.

  1. Lower tax rates
  2. Less double taxation
  3. Fewer loopholes

But how is tax reform possible in a fiscal environment of big government and rising deficits?

This is a challenge. In an ideal world, there would be accompanying budget reforms to save money, thus creating leeway for tax reform to be a net tax cut.

But even in the current fiscal environment, tax reform is possible if policy makers finance pro-growth reforms by closing undesirable loopholes.

Indeed, that’s basically what happened in the recent tax plan. The lower corporate rate was financed by restricting the state and local tax deduction and a few other changes. The budget rules did allow for a modest short-run tax cut, but the overall package was revenue neutral in the long run (i.e., starting in 2027).

It’s now time to repeat this exercise.

The Congressional Budget Office periodically issues a report on Budget Options, which lists all sort of spending reforms and tax increases, along with numbers showing what those changes would mean to the budget over the next 10 years.

I’ve never been a huge fan of this report because it is too limited on the spending side. You won’t find fleshed-out options to shut down departments, for instance, which is unfortunate given the target-rich environment (including TransportationHousing and Urban DevelopmentEducationEnergy, and Agriculture).

And on the tax side, it has a lengthy list of tax hikes, generally presented as ways to finance an ever-expanding burden of government spending. The list must be akin to porn for statists like Bernie Sanders.

It includes new taxes.

And it includes increases in existing taxes.

But the CBO report also includes some tax preferences that could be used to finance good tax reforms.

Here are four provisions of the tax code that should be the “pay-fors” in a new tax reform plan.

We’ll start with two that are described in the CBO document.

Further reductions in itemized deductions – The limit on the state and local tax deduction should be the first step. The entire deduction could be repealed as part of a second wave of tax reform. And the same is true for the home mortgage interest deduction and the charitable contributions deduction.

Green-energy pork – The House version of tax reform gutted many of the corrupt tax preferences for green energy. Unfortunately, those changes were not included in the final bill. But the silver lining to that bad decision is that those provisions can be used to finance good reforms in a new bill.

Surprisingly, the CBO report overlooks or only gives cursory treatment to a couple of major tax preferences that each could finance $1 trillion or more of pro-growth changes over the next 10 years.

Municipal bond interest – Under current law, there is no federal tax on the interest paid to owners of bonds issued by state and local governments. This “muni-bond” loophole is very bad tax policy since it creates an incentive that diverts capital from private business investment to subsidizing the profligacy of cities like Chicago and states like California.

Healthcare exclusion – Current law also allows a giant tax break for fringe benefits. When companies purchase health insurance plans for employees, that compensation escapes both payroll taxes and income taxes. Repealing – or at least capping – this exclusion could raise a lot of money for pro-growth reforms (and it would be good healthcare policy as well).

What’s potentially interesting about the four loopholes listed above is that they all disproportionately benefit rich people. This means that if they are curtailed or repealed and the money as part of tax reform, the left won’t be able to argue that upper-income taxpayers are getting unfair benefits.

Actually, they’ll probably still make their usual class-warfare arguments, but they will be laughably wrong.

The bottom line is that we should have smaller government and less taxation. But even if that’s not immediately possible, we can at least figure out revenue-neutral reforms that will produce a tax system that does less damage to growth, jobs, and competitiveness.

Read Full Post »

Last November, I wrote about the lessons we should learn from tax policy in the 1950s and concluded that very high tax rates impose a very high price.

About six months before that, I shared lessons about tax policy in the 1980s and pointed out that Reaganomics was a recipe for prosperity.

Now let’s take a look at another decade.

Amity Shlaes, writing for the City Journal, discusses the battle between advocates of growth and the equality-über-alles crowd.

…progressives have their metrics wrong and their story backward. The geeky Gini metric fails to capture the American economic dynamic: in our country, innovative bursts lead to great wealth, which then moves to the rest of the population. Equality campaigns don’t lead automatically to prosperity; instead, prosperity leads to a higher standard of living and, eventually, in democracies, to greater equality. The late Simon Kuznets, who posited that societies that grow economically eventually become more equal, was right: growth cannot be assumed. Prioritizing equality over markets and growth hurts markets and growth and, most important, the low earners for whom social-justice advocates claim to fight.

Amity analyzes four important decades in the 20th century, including the 1930s, 1960s, and 1970s.

Her entire article is worth reading, but I want to focus on what she wrote about the 1920s. Especially the part about tax policy.

She starts with a description of the grim situation that President Harding and Vice President Coolidge inherited.

…the early 1920s experienced a significant recession. At the end of World War I, the top income-tax rate stood at 77 percent. …in autumn 1920, two years after the armistice, the top rate was still high, at 73 percent. …The high tax rates, designed to corral the resources of the rich, failed to achieve their purpose. In 1916, 206 families or individuals filed returns reporting income of $1 million or more; the next year, 1917, when Wilson’s higher rates applied, only 141 families reported income of $1 million. By 1921, just 21 families reported to the Treasury that they had earned more than a million.

Wow. Sort of the opposite of what happened in the 1980s, when lower rates resulted in more rich people and lots more taxable income.

But I’m digressing. Let’s look at what happened starting in 1921.

Against this tide, Harding and Coolidge made their choice: markets first. Harding tapped the toughest free marketeer on the public landscape, Mellon himself, to head the Treasury. …The Treasury secretary suggested…a lower rate, perhaps 25 percent, might foster more business activity, and so generate more revenue for federal coffers. …Harding and Mellon got the top rate down to 58 percent. When Harding died suddenly in 1923, Coolidge promised to “bend all my energies” to pushing taxes down further. …After winning election in his own right in 1924, Coolidge joined Mellon, and Congress, in yet another tax fight, eventually prevailing and cutting the top rate to the target 25 percent.

And how did this work?

…the tax cuts worked—the government did draw more revenue than predicted, as business, relieved, revived. The rich earned more than the rest—the Gini coefficient rose—but when it came to tax payments, something interesting happened. The Statistics of Income, the Treasury’s database, showed that the rich now paid a greater share of all taxes. Tax cuts for the rich made the rich pay taxes.

To elaborate, let’s cite one of my favorite people. Here are a couple of charts from a study I wrote for the Heritage Foundation back in 1996.

The first one shows that the rich sent more money to Washington when tax rates were reduced and also paid a larger share of the tax burden.

And here’s a look at the second chart, which illustrates how overall revenues increased (red line) as the top tax rate fell (blue).

So why did revenues climb after tax rates were reduced?

Because the private economy prospered. Here are some excerpts about economic performance in the 1920s from a very thorough 1982 report from the Joint Economic Committee.

Economic conditions rapidly improved after the act became law, lifting the United States out of the severe 1920-21 recession. Between 1921 and 1922, real GNP (measured in 1958 dollars) jumped 15.8 percent, from $127.8 billion to $148 billion, while personal savings rose from $1.59 billion to $5.40 -billion (from 2.6 percent to 8.9 percent of disposable personal income). Unemployment declined significantly, commerce and the construction industry boomed, and railroad traffic recovered. Stock prices and new issues increased, with prices up over 20 percent by year-end 1922.8 The Federal Reserve Board’s index of manufacturing production (series P-13-17) expanded 25 percent. …This trend was sustained through much of 1923, with a 12.1 percent boost in GNP to $165.9 billion. Personal savings increased to $7.7 billion (11 percent of disposable income)… Between 1924 ‘and 1925 real GNP grew 8.4 percent, from $165.5 billion to $179.4 billion. In this same period the amount of personal savings rose from an already impressive $6.77 billion to about $8.11 billion (from 9.5 percent to 11 percent of personal disposable income). The unemployment rated dropped 27.3 percents interest rates fell, and railroad traffic moved at near record levels. From June 1924 when the act became law to the end of that year the stock price index jumped almost 19 percent. This index increased another 23 percent between year-end 1924 and year-end 1925, while the amount of non-financial stock issues leapt 100 percent in the same period. …From 1925 to 1926 real GNP grew from $179.4 billion to $190 billion. The index of output per man-hour increased and the unemployment rate fell over 50 percent, from 4.0 percent to 1.9 percent. The Federal Reserve Board’s index of manufacturing production again rose, and stock prices of nonfinancial issues increased about 5 percent.

Now for some caveats.

I’ve pointed out many times that taxes are just one of many policies that impact economic performance.

It’s quite likely that some of the good news in the 1920s was the result of other factors, such as spending discipline under both Harding and Coolidge.

And it’s also possible that some of the growth was illusory since there was a bubble in the latter part of the decade. And everything went to hell in a hand basket, of course, once Hoover took over and radically expanded the size and scope of government.

But all the caveats in the world don’t change the fact that Americans – both rich and poor – immensely benefited when punitive tax rates were slashed.

P.S. Since Ms. Shlaes is Chairman of the Calvin Coolidge Presidential Foundation, I suggest you click here and here to learn more about the 20th century’s best or second-best President.

P.P.S. I assume I don’t need to identify Coolidge’s rival for the top spot.

Read Full Post »

In my decades of trying to educate policy makers about the downsides of class-warfare tax policy, I periodically get hit with the argument that high tax rates don’t matter since America enjoyed a golden period of prosperity in the 1950s and early 1960s when the top tax rate was more than 90 percent.

Here’s an example from Politico of what I’m talking about.

Well into the 1950s, the top marginal tax rate was above 90%. …both real GDP and real per capita GDP were growing more than twice as fast in the 1950s as in the 2000s.

This comparison grates on me in part because both Bush and Obama imposed bad policy, so it’s no surprise that the economy did not grow very fast when they were in office.

But I also don’t like the comparison because the 1950s were not a halcyon era, as Brian Domitrovic explains.

…you may be thinking, “But wait a minute. The 1950s, that was the greatest economic era ever. That’s when everybody had a job. Those jobs were for life. People got to live in suburbia and go on vacation and do all sorts of amazing things. It was post-war prosperity, right?” Actually, all of these things are myths. In the 1950s, the United States suffered four recessions. There was one in 1949, 1953, 1957, 1960 — four recessions in 11 years. The rate of structural unemployment kept going up, all the way up to 8% in the severe recession of 1957-58. …there wasn’t significant economic growth in the 1950s. It only averaged 2.5 percent during the presidency of Dwight D. Eisenhower.

For today’s purposes, though, I want to focus solely on tax policy. And my leftist friends are correct that the United States had a punitive top tax rate in the 1950s.

This chart from the Politico story shows the top tax rate beginning on that dark day in 1913 when the income tax was adopted. It started very low, then jumped dramatically during the horrible presidency of Woodrow Wilson, followed by a big reduction during the wonderful presidency of Calvin Coolidge. Then it jumped again during the awful presidencies of Herbert Hoover and Franklin Roosevelt. The rate stayed high in the 1950s before the Kennedy tax cuts and Reagan tax cuts, which were followed by some less dramatic changes under George H.W. Bush, Bill Clinton, George W. Bush, and Barack Obama.

What do we know about the impact of the high tax rates put in place by Hoover and Roosevelt? We know the 1930s were an awful period for the economy, we know the 1940s were dominated by World War II, and we know the 1950s was a period of tepid growth.

But we also know that high tax rates don’t result in high revenues. I don’t think Hauser’s Law always applies, but it’s definitely worked so far in the United States.

This is because highly productive taxpayers have three ways to minimize and/or eliminate punitive taxes. First, they can simply choose to live a more relaxed life by reducing levels of work, saving, and investment. Second, they can engage in tax evasion. Third, they can practice tax avoidance, which is remarkably simple for people who have control over the timing, level, and composition of their income.

All these factors mean that there’s not a linear relationship between tax rates and tax revenue (a.k.a., the Laffer Curve).

And if you want some evidence on how high tax rates don’t work, Lawrence Lindsey, a former governor at the Federal Reserve, noted that extortionary tax rates are generally symbolic – at least from a revenue-raising perspective – since taxpayers will arrange their financial affairs to avoid the tax.

…if you go back and look at the income tax data from 1960, as a place to start, the top rate was 91 percent. There were eight — eight Americans who paid the 91 percent tax rate.

Interestingly, David Leonhardt of the New York Times inadvertently supported my argument in a recent column that was written to celebrate the era when tax rates were confiscatory.

A half-century ago, a top automobile executive named George Romney — yes, Mitt’s father — turned down several big annual bonuses. He did so, he told his company’s board, because he believed that no executive should make more than $225,000 a year (which translates into almost $2 million today). …Romney didn’t try to make every dollar he could, or anywhere close to it. The same was true among many of his corporate peers.

I gather the author wants us to think that the CEOs of the past were somehow better people than today’s versions.

But it turns out that marginal tax rates played a big role in their decisions.

The old culture of restraint had multiple causes, but one of them was the tax code. When Romney was saying no to bonuses, the top marginal tax rate was 91 percent. Even if he had accepted the bonuses, he would have kept only a sliver of them. The high tax rates, in other words, didn’t affect only the post-tax incomes of the wealthy. The tax code also affected pretax incomes. As the economist Gabriel Zucman says, “It’s not worth it to try to earn $50 million in income when 90 cents out of an extra dollar goes to the I.R.S.”

By the way, Zucman is far from a supply-sider (indeed, he’s co-written with Piketty), yet he’s basically agreeing that marginal tax rates have a huge impact on incentives.

The only difference between the two of us is that he thinks it is a good idea to discourage highly productive people from generating more income and I think it’s a bad idea.

Meanwhile, Leonhardt also acknowledges the fundamental premise of supply-side economics.

For more than 30 years now, the United States has lived with a top tax rate less than half as high as in George Romney’s day. And during those same three-plus decades, the pay of affluent Americans has soared. That’s not a coincidence.

But he goes awry by then assuming (as is the case for many statists) the economy is a fixed pie. I’m not joking. Read for yourself.

..,the most powerful members of organizations have fought to keep more money for themselves. They have usually won that fight, which has left less money for everyone else.

A market economy, however, is not a zero-sum game. It is possible for all income groups to become richer at the same time.

That’s why lower tax rates are a good idea if we want more prosperity – keeping in mind the important caveat that taxation is just one of many policies that impact economic performance.

P.S. Unbelievably, President Franklin Roosevelt actually tried to impose a 100 percent tax rate (and that’s not even the worst thing he advocated).

Read Full Post »

Older Posts »

%d bloggers like this: