Feeds:
Posts
Comments

Archive for the ‘Competitiveness’ Category

I wrote in 2014, 2017, and 2020 about how free markets and limited government have produced amazing results in Singapore.

Let’s revisit that country and we’ll start with this video from the Fraser Institute.

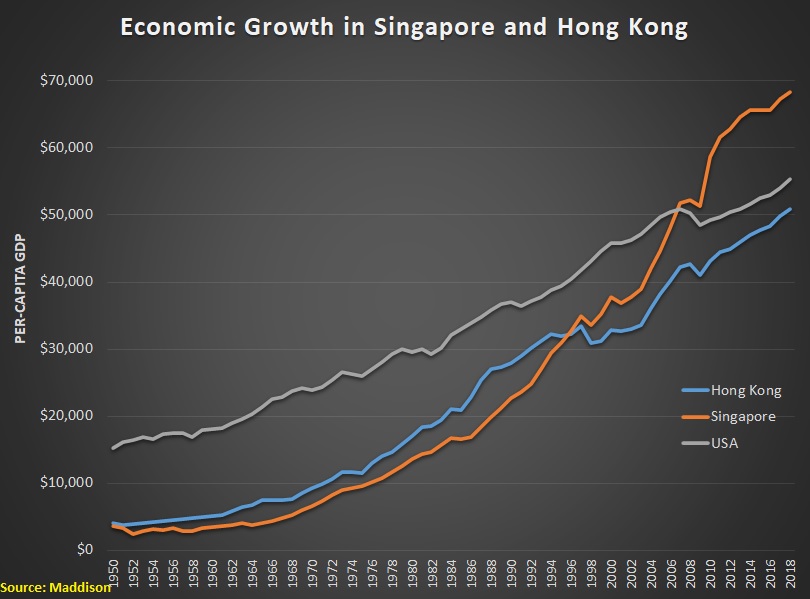
Since the video explains that Singapore emphasized growth, let’s compared the United States and Singapore over the past six decade based on Maddison data.

As you can see, Singapore did a great job of converging with America and now it’s doing an even-better job of diverging.

An article in this week’s Economist lauds Singapore amazing success.

Here are some excerpts.

Singapore has become a beacon of prosperity. In a part of the world where middle-income status is the norm, the city-state is now the richest country for many thousands of miles in any direction. At around $88,000, its GDP per person has doubled in real terms over the past 20 years. At the moment of its independence in 1965, the country was poorer on the same basis than South Africa or Jordan. …During the past two decades, the median wage for Singaporean residents in full-time work has risen by 43% in real terms, compared with an 8% rise in America. At around $46,000 in dollar terms, the median full-time wages of Singaporeans are now higher than those in Britain, the country’s former colonial boss, where they sit at around $44,000.

Since the article mentions that Singapore used to be poorer than South Africa and Jordan, I can’t resist pointing out that Singapore used to be as poor as Jamaica.

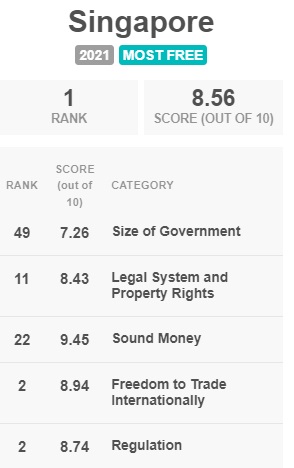
So why is Singapore now one of the world’s richest nations?

For the simple reason that it has free markets and limited government.

According to Economic Freedom of the World, it has the world’s most market-oriented policies, including total free trade and minuscule levels of red tape.

And more economic liberty is strongly correlated with more national prosperity.

Let’s close with some analysis of Singaporean fiscal policy.  Notice that Singapore gets its worst score on size of government, ranking #49.

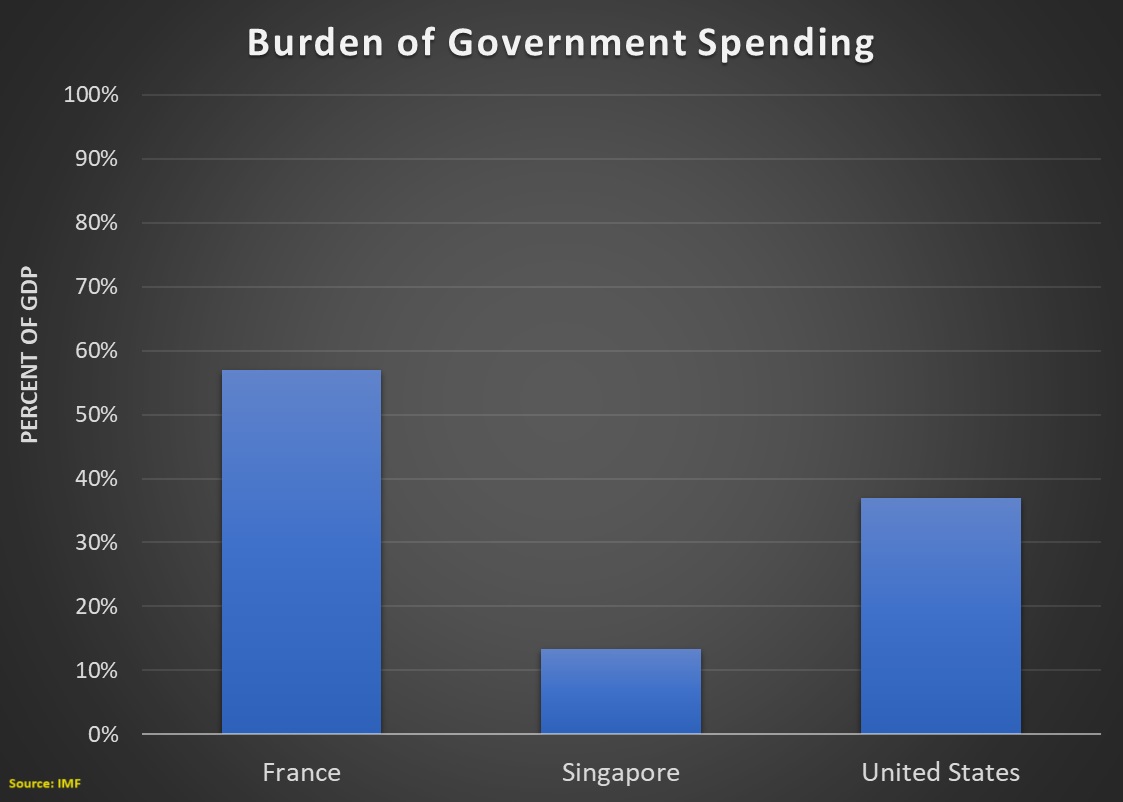
Yet IMF data shows that the burden of government spending in Singapore is impressively low, with the public sector consuming less than 14 percent of the economy’s output.

So how can Singapore only rank #49 on fiscal policy when it has a very small fiscal burden?

The answer is that the government owns non-trivial chunks of the economy. And even though the video explains that Singapore requires government-owned companies to be efficient, the Fraser Institute correctly lowers the nation’s score for that deviation from laissez-faire policy.

The bottom line is that even a very well-governed nation may have a slice of socialism!

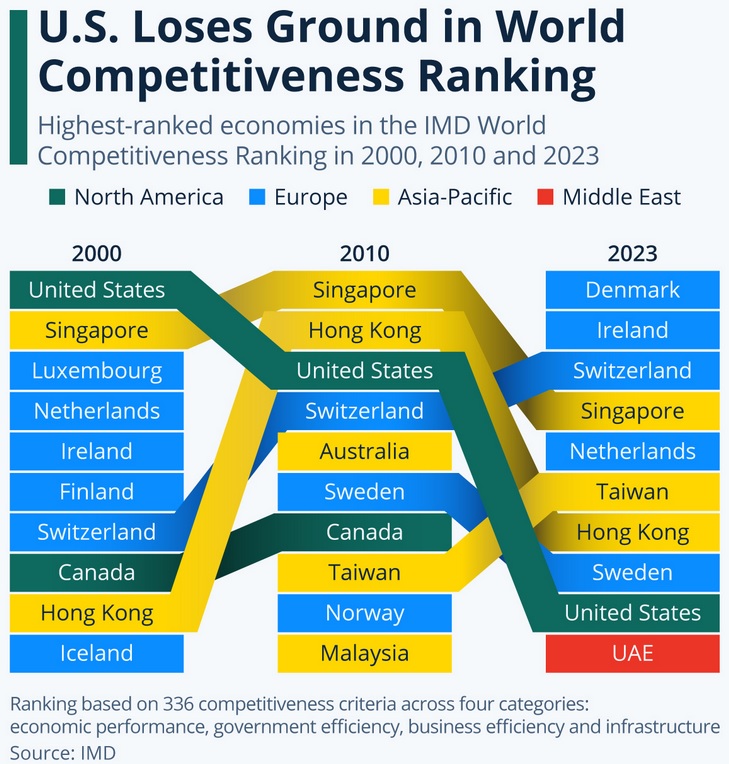
P.S. Hong Kong has now fallen well behind Singapore.

P.P.S. The OECD is infamous for dodgy and biased research, but even I was shocked when the Paris-based bureaucrats pushed for higher taxes in Asia while ignoring the incredible economic success of low-tax Singapore.

Read Full Post »

The good news is that there is very little risk that President’s new budget – which is very similar to his previous budgets – will be approved by Congress.

The bad news is that his budget is filled with terrible policy. Big expansions in the burden of spending and big increases in tax rates.

At the risk of understatement, the economic consequences of those policies would be unfortunate.

Given my interest in competitiveness, I think this visual from the Tax Foundation is the most important thing to understand. Biden wants tax rates in the United States to go from dark blue to light blue.

What makes this visual so disappointing is when you compare tax rates in the United States to other industrialized nations.

Tax rates in America already are high compared to those other countries, especially when looking at the taxation of saving and investment.

But the most shocking results are when you compare tax rates in other nations to Biden’s proposed tax rates. The United States would be shooting itself in the foot.

Given those terrible policies, this set of numbers from the Tax Foundation is hardly a surprise. Government would get more money and households would lose money.

I’ll close by observing that the Tax Foundation’s model is based on how higher tax rates discourage productive behavior. And there’s lots of academic evidence to support that approach.

As far as I know, though, the Tax Foundation does not quantify or estimate the economic damage from higher spending. So the actual consequences of Biden’s proposed budget surely would be even worse (the case for smaller government is bolstered by research from the Congressional Budget Office, as well as from generally left-leaning international bureaucracies such as the OECDWorld BankECB, and IMF).

Read Full Post »

I narrated a video more than 10 years ago to explain the recipe for poor nations to become rich nations.

Kite & Key Media has unveiled a video with a similar message.

The country comparisons were the most compelling part of the video.

Indeed, I’ve cited the very same examples.

I also liked how the Baltic nations got some positive attention.

And Singapore as well.

But I do have one criticism of the video. It should have used the Fraser Institute’s Economic Freedom or the World or the Heritage Foundation’s Index of Economic Freedom as its main source.

This is because there is some very sloppy methodology in the Atlantic Council’s Freedom and Prosperity Indexes.

Their Prosperity Index, for instance, uses some common-sense variables such as per-capita economic output, but it also is based in part on mis-measured variables such as years of education rather than actual education achievement.

Worst of all, there is an inequality variable. And to give you an idea of why that’s methodological garbage, the U.S. score would increase if all rich Americans were exiled even though that would mean a big drop in per-capita GDP.

You may think I’m being pedantic or ideological, but here’s some real-world evidence to show you why the Atlantic Council’s analysis is laughably misguided.

This chart shows IMF data on per-capita GDP. You can see the United States on the right, way ahead of the other nations with more than $80,000 of economic output per person.

What do all the other countries have in common, besides having much-lower levels of per-capita GDP? They all score higher than the United States in the Atlantic Council’s Prosperity Index.

I’m not joking. Click here and see for yourself.

Reminds me of the dodgy analysis from the OECD that asserted that poverty was higher in the United States than in nations such as Portugal, Greece, Turkey, Hungary, Mexico, and Poland.

P.S. One other thing I would correct in the video was the discussion of Romania. Yes, Romania is now much richer today than it was in 1950.

But simply showing the difference between living standards in 1950 and today obscures the very important fact that the vast bulk of the improvement came after Romania escaped communist slavery.

The lesson from Romania and other nations is that the key to national prosperity is freedom. Especially if freedom is properly measured.

Read Full Post »

I’ve written lots of columns comparing Texas and California (see here, here, here, here, here, here, here and here), and also several columns comparing Florida and New York (see here, here, here, here, and here).

We’ll break from that pattern today because we’re going to compare Florida and California, motivated by tonight’s Fox TV debate between Gov. Ron DeSantis and Gov. Gavin Newsom.

We’ll start with this table put together by Peter Coy of the New York Times. If Florida won, I awarded a red star and if California won, I awarded a blue star (and no stars if there was a tie or the category was irrelevant).

Florida won the most categories, though California has higher income (but also a much-higher cost of living).

Here’s a table prepared by the Committee to Unleash Prosperity. No need to add any stars since Florida wins every category.

I’ll close with a few excerpts from an editorial by the Wall Street Journal.

Gavin Newsom and Ron DeSantis are set to square off…in a Fox News debate… Besides offering voters a look of the alternatives to Joe Biden and Donald Trump, the showdown between the California and Florida governors could provide a revealing policy contrast. Sacramento has rushed to the left in recent decades while Tallahassee has moved to the right. Since winning election in 2018, Messrs. Newsom and DeSantis have advanced sharply different policies on Covid lockdowns, taxes, school choice and climate regulation, among other things. …here is a scorecard of policy results. …Since January 2019, employment has increased by 1,031,030 in Florida while declining by 85,438 in California. …California’s 4.8% jobless rate is the second highest in the country and nearly twice as high as Florida’s (2.8%). …State and local taxes in California add up to $10,167 per capita versus $5,406 in Florida. …Despite its higher taxes, California boasted a $31.5 billion budget shortfall in May while Florida ran a $17.7 billion surplus.

Based on the data, DeSantis has already won the debate.

Though messaging and style matter in politics, so we’ll see what happens in tonight’s debate.

P.S. We’ll make this column Part V of our series on red states vs blue states (previous editions available here, here, here, and here).

Read Full Post »

Over the past week, we’ve looked at both the Tax Hell Index and the International Tax Competitiveness Index, giving us a good idea of which nations have terrible and not-so-terrible tax policy.

Today, let’s look at which states rank high and low on tax policy.

Here’s a map from the Tax Foundation’s new State Business Tax Climate Index. The top-3 states are Wyoming, South Dakota, and Alaska and the bottom-3 states are New Jersey, New York, and California.

Of the top-10 states, six have no state income tax and three have flat taxes.

Conversely, all of the bottom-10 states have so-called progressive taxes that discriminate against entrepreneurs, investors, small-business owners, and other high-income taxpayers.

A lot has been happening at the state level, so here are some of the highlights (and one lowlight).

Arizona transitioned from a two-bracket, graduated-rate individual income tax system with a top rate of 2.98 percent to a flat tax rate of 2.5 percent… This major development helped the state improve seven places on the individual income tax component and five places overall, from 19th to 14th.

Iowa witnessed significant changes in its tax landscape this year. Notably, the state reduced its top marginal individual income tax rate from 8.53 to 6.0 percent… As a result, Iowa’s overall ranking improved from 38th to 33rd.

Massachusetts fell further than any other state in the overall rankings this year, sliding 12 places since last year. This decline in tax competitiveness is due to the adoption of Question 1 in November 2022, which amended the state’s constitution to move from a single-rate to a graduated-rate income tax by imposing a 4 percent surtax on income over $1 million, raising the top marginal individual income tax rate from 5 to 9 percent.

Mississippi’s ranking improved from 27th to 20th overall. The state improved from 13th to 8th on the corporate tax component… The implementation of a flat individual income tax drove a seven-place improvement on the individual income tax component, from 26th to 19th.

Kudos to Mississippi for moving up seven spots, as well as Arizona and Iowa for jumping five spots.

And Massachusetts has really hurt itself, dropping by 12 spots.

P.S. As I’ve noted before, I think Wyoming and Alaska are overrated since they collect so much revenue from energy taxes.

Read Full Post »

As I did with the 2022 issue, the 2021 issue, the 2020 issueetc, let’s analyze the results  of the new International Tax Competitiveness Index from the Tax Foundation.

In part, the results are boring because – once again – Estonia has the best-designed tax system of all OECD nations.

To make things even more boring, the top four nations have been the same four years in a row.

Latvia is in second place. Again. New Zealand is in third place. Again. Followed by Switzerland in fourth place. Again.

Here are the full rankings (click to enlarge).

Colombia is in last place, so we can safely assume it is not on a path to becoming a rich nation. And Chile also gets a bad score (which is only partly the fault of the nation’s moronic president since Chile routinely has been near the bottom).

Among nations from Western Europe, France, Italy, and Portugal get the worst scores. Which seems to be an annual tradition.

Since more than three-fourths of my readers are American, let’s close with some analysis of the United States.

The bad news is that the United States is in the bottom half, ranking #21 out of 38 countries.

The good news is that the United States routinely used to be one of the five worst countries.

So be thankful for the 2017 tax legislation, which substantially improved America’s score for corporate tax (the US has always had a good score for consumption taxes, presumably in large part because we haven’t made the mistake of imposing a value-added tax).

P.S. One potential shortcoming of the Index is that there is no variable for the overall tax burden. This is a deliberate choice since the Tax Foundation wants to focus on the structure of the tax system. As noted in the Frequently Asked Questions, “The Index is concerned about how a tax system is structured; not how much revenue is raised by that system. …The Index is designed to help policymakers determine better ways to levy taxes rather than encourage high or low overall levels of tax
revenue.”

Nothing wrong with that approach, of course, but people interested in the structure and the burden of taxation should look at this Tax Foundation report in conjunction with the fiscal data from either Economic Freedom of the World and/or the Index of Economic Freedom.

Read Full Post »

In our series on red states vs blue states, we’ve examined different economic variables.

Today, let’s add another comparison.

Here’s a map looking at 2022 income growth by state. The three states most known for bad policy – New York, Illinois, and California – were among the handful of states that suffered a decline in personal income.

It’s also worth noting that most of the “weaker than average” states also are known for leaning left.

The Wall Street Journal has an editorial on the performance gap between red states and blue states. Here are some excerpts.

Personal income in California, Illinois and New York declined in 2022 for the first time since 2009… Personal income last year nationwide increased 2% in current dollars, which amounts to a real decline after inflation. …The opposite was true in the fastest-growing states, including Florida (4.7%), Arizona (4.9%), Texas (5%), Utah (5.5%), Colorado (5.8%), South Dakota (5.8%), Montana (6.1%), Idaho (6.5%), North Dakota (7%), and Delaware (8.8%). …The personal income declines in California, New York, Illinois and some other states would have been larger if not for the continued growth in Medicaid spending owing to the pandemic national emergency, which didn’t end until this spring. A federal food-stamp fillip also continued until March. …California, New York and Illinois used their allotments largely to cover pre-existing budget shortfalls, boost government worker pay, and bake into their budget new spending obligations. Those will become shortfalls once the pandemic money boom ends. Taxpayers, look out.

The last few sentences above are key.

When they get new money, either from tax increases or federal transfers, irresponsible politicians create long-run spending obligations.

And that creates the conditions for future tax increases, just as the WSJ warns.

Here’s one final item for today’s column. Back in July, the Wall Street Journal compared industry performance in red states and blue states.

Here’s a table comparing Texas and Florida vs. New York and California.

Game, set, and match.

The moral of the story is that big government doesn’t work well on the national level, it doesn’t work well on the state level, and it doesn’t work well on the local level.

Read Full Post »

Two of the worst states for tax policy are California and New York.

They have punitive income tax rates, high sales taxes, and myriad other ways of diverting money from the productive sector of the economy to finance bloated public sectors.

I’ve written several time that greedy politicians in these states are driving away taxpayers. Simply stated, successful people are “voting with their feet” and choosing to move to states with lower tax burdens.

Especially states with no income taxes.

But it’s not just people that are moving. As shown by these maps, money is also escaping from California and New York.

The above map comes from Linly Lin and Tom Maloney, who wrote a column for Bloomberg about money-management firms fleeing high-tax states.

Here are some excerpts from their report.

The drip, drip, drip of the finance industry’s exit from New York and California has been measured anecdotally… Elliott Management decamped to West Palm Beach. AllianceBernstein to Nashville. Charles Schwab moved to suburban Dallas. Now, for the first time, there are hard numbers quantifying the exact scope of the exodus. Both states have in the past three years lost firms that managed close to $1 trillion of assets…The exodus from the Northeast and West Coast has meant the loss of thousands of high-paying jobs, straining city and state finances by sapping tax revenue. …The moves, often born out of a desire for lower taxes, …spurring plenty of angst in the places left behind… From the start of 2020 through the end of March 2023, more than 370 investment companies — about 2.5% of the US total, and managing $2.7 trillion in assets — moved their headquarters to a new state. The vast majority of the migration was out of high-cost-of-living locales in the Northeast and on the West Coast and into Florida, Texas and other Sun Belt refuges.

Here’s another map from the column.

In this case, the authors look at how Texas and Florida are the main beneficiaries of America’s internal money migration.

By the way, I think taxes play a much bigger role than weather.

Nobody moves from California to Texas for the climate. Meanwhile, it’s possible that weather helps to explain the big shift from New York to Florida, but keep in mind that most people find Florida summers just as unpleasant as New York winters.

I’ll close by noting that red states have been outperforming blue states, and this Bloomberg data is another piece of powerful evidence to add to our collection.

P.S. My series on Texas vs California and Florida vs New York  also show the superiority of low taxes compared to higher taxes. Maybe, just maybe, there’s a lesson to be learned.

Read Full Post »

Americans can see how their states rank for overall economic liberty.

They can also see how states rank for fiscal policy.

Today let’s look at how various states rank based on whether they are good places to create a small business.

Unsurprisingly, having no state income tax helps, but that is just one variable. It is also very important to have modest fees.

The top three states are Wyoming, Florida, and South Dakota.

Here’s some discussion of the ratings, including methodology.

Brand new research conducted by small business advice company Venture Smarter reveals the best and worst states to startup an LLC. The experts have indexed all 50 U.S states (plus DC), ranking each against six factors necessary for starting up an LLC, to receive a score out of 100. …Rankings are based on factors including LLC annual fees, LLC filling fees, average LLC agreement bid costs (from professional in States required to have one), advertising and publishing costs, tax climate index scores, and number of small businesses per 100K residents.

And which states are worst?

California is in last place, followed by New York and Delaware.

I’m somewhat surprised to see a very bad score for Delaware.

The state is famous, after all, as a tax haven for companies. I wonder if this is a case of the state charging high fees because it actually provides high value?

Read Full Post »

In Part I and Part II of this series, we looked at how taxpayers are moving from high-tax states to low-tax states.

For Part III, let’s start with a map from the Tax Foundation, which shows which states are winning and losing as Americans vote with their feet.

People moving is only part of the story. We also need to look at who is moving.

That can have major implications for a state’s long-run competitiveness. Or even its fiscal viability.

Here are some excerpts from a column I wrote for Bloomberg.

States want to make sure they attract—or at least don’t lose—rich people. Upper-income taxpayers pay a disproportionate amount of taxes (just like they pay the lion’s share of federal taxes), and states that attract such residents are fiscal winners. …IRS data shows that high-tax states such as California, New York, and Illinois are losing tens of thousands of successful residents to low-tax states, with zero-income-tax Florida being a preferred destination. But what really matters from a fiscal perspective is that those tens of thousands of people leaving higher-tax states account for tens of billions of dollars of taxable income. This is a dangerous trend for the nation’s high-tax states. Simply stated, a government needs an acceptable ratio of people pulling the wagon versus those riding in the wagon. Otherwise, as former British Prime Minister Margaret Thatcher famously warned, they’ll “run out of other people’s money.” …high-tax states…face a grim future as more and more taxpayers do a cost-benefit analysis and decide whether they get enough value from government to justify punitive income tax rates (topping out at more than 10 percent in California, New York, and New Jersey). Based on current trends, expect a growing number of those taxpayers to “vote with their feet.”

The Tax Foundation study cited above, authored by Katherine Loughead, has some sobering data showing how interstate migration creates winners and losers.

The IRS data also show interstate migration broken down by AGI level. Among taxpayers with $200,000 or more in AGI, the top destinations for inbound interstate moves were Florida, Texas, Arizona, North Carolina, and South Carolina. Meanwhile, the states that saw the largest losses of taxpayers with $200,000 or more in AGI were New York, California, Illinois, Massachusetts, and Virginia. Several of the states losing higher-income taxpayers, especially New York, California, and New Jersey, have highly progressive tax codes under which tax liability rises steeply with income. States that structure their tax codes in this manner have consistently lost higher-income residents to lower-tax states, and not only the residents, but also any associated tax revenue and entrepreneurial activity that goes along with them.

Let’s close with a look at how California is a big net loser.

A TV station in Los Angeles, KTLA, reports on how the state is suffering from an exodus of people who are net tax-payers.

For the third straight year, the state of California has experienced a decline in population, according to U.S. Census Bureau data, and many of those packing up and heading east are some of the state’s wealthiest. A study of IRS Migration Data by an online real estate portal found that no state experienced a larger loss of tax income from migration than California. The study, conducted by MyEListing.com, found that California lost more than $340 million in 2021 IRS tax revenue due to residents moving. …“Despite its numerous attractions … beautiful landscapes and cultural richness, California’s high personal income tax rates seem discouraging for many high-wealth individuals. This, coupled with the state’s high cost of living, will likely fuel a wealth migration out of California,” the website wrote in its analysis. California is the entertainment capital of the world as well as home to Silicon Valley, but it appears some of the highest earners no longer need to keep their California residency to maintain their careers and businesses.

I’ll conclude by emphasizing that a state can get in fiscal (and economic) trouble if it drives away net tax-payers and attracts net tax-consumers.

As I wrote for Bloomberg, it is not a good idea to have lots of people riding in the wagon and too few people pulling the wagon. That’s bad for states, and it’s bad for nations.

P.S. While California does not have a very encouraging fiscal outlook, it is not the state viewed as most likely to go bankrupt.

Read Full Post »

Economists assume that poor countries should grow faster than rich countries over time, a process known as convergence.

It’s a reasonable theory, but only if poor countries and rich countries have similar levels of economic liberty.

But that’s often not the case, which is why I put together an anti-convergence club. I have dozens of examples of richer countries growing faster than poorer countries.

And not just for one or two years. Every example in the anti-convergence club is based upon multiple decades of data.

Even more important, every example shows that you get faster growth in nations with free markets and limited government.

Now we have a new member of the anti-convergence club. Here’s a chart that Mike Bird of the U.K.-based Economist shared on Twitter. It shows that Japan has been steadily losing ground compared to the United States over the past three decades.

So what’s the reason for Japan’s long-run decline?

Some of it presumably is caused by demographics. But there’s also been fiscal decline measured by both taxation and spending burdens.

And this chart on competitiveness is very depressing.

Amazingly, some people on the left think the U.S. should copy Japan. I’m guessing those people can’t answer this question.

Read Full Post »

Part I of this series reviewed some data about the United States growing much faster than the welfare states of the European Union.

Part II of the series looked at some very depressing data about the European Union losing ground compared to the United States, even though convergence theory tells us that should not happen.

For today’s installment, let’s see what the European Union’s statistical body concluded in a new report about the region’s economic performance. We’ll start with this chart showing that inflation-adjusted disposable income (the blue line) declined last year.

To be sure, American households also suffered a decline in inflation-adjusted income, so this is not just a Europe-specific problem.

Here’s some of Eurostat’s analysis.

…the nowcasted median disposable income will decrease in real terms in most EU countries. Rising prices for essential items (goods and services), such as food, energy and transport were the main reason for the decrease of the real income. …It is estimated that inflation led to a 1.9 % decrease for EU median disposable income in real terms in 2022 (compared to 2021). The effect of inflation is likely stronger for low-income households, as essential items represent a higher share of their overall consumption, and they have little margin for adjusting their consumption. In this context, the at-risk-of-poverty rate anchored in 2021…is estimated to statistically significant increase for about half of the EU countries. …Figure 6 shows the change in median disposable income in real terms at country level. The largest decreases were estimated in Estonia, Latvia, the Netherlands, Denmark, Slovakia and Czechia. It increased most sharply in Hungary and Bulgaria.

Here’s the map showing which nations enjoyed more real income in 2022 (dark blue) and which ones suffered big losses (dark orange).

Though don’t assume that nations such as Hungary and Bulgaria had good policy.

Inflation-adjusted disposable income can go up for good reasons (faster growth, lower taxes), but it also can increase for not-so-good reasons (more handouts).

P.S. The data above does not include the United Kingdom, which wisely left the European Union, or Switzerland, which wisely never joined.

Read Full Post »

In Part I of this series, we learned from a report in the Wall Street Journal that the combined economies of the European Union have grown by only 6 percent over the past 15 years compared to 82 percent growth in the United States.

That is stunning evidence that big welfare states lead to economic stagnation.

For Part II, let’s look at a remarkable new study by the Brussels-based European Centre for International Political Economy.

We’ll start with this chart, which shows that the U.S. is much richer. But what’s especially noteworthy is that the gap between the U.S. and E.U. keeps widening even though convergence theory says poorer nations should grow faster than richer nations.

Given the E.U.’s dismal performance over the past 15 years, it seems like the “anti-convergence” is becoming even more pronounced.

Here is some of the analysis from the report, authored by Fredrik Erixon, Oscar Guinea, and Oscar du Roy. They start by emphasizing the importance of long-run growth.

…it is the long-term trend that matters. An economy that grows at 3 percent per year will double in 24 years but an economy that grows at 1 percent per year will double only in 48 years. …If European countries were states in the United States, many of them would belong to the group of poorest… The result of this economic divergence between EU member states and US states is a growing wedge of GDP per capita between the EU and the US, which in 2021 was as large as 82 percent. If the trend continues, the prosperity gap between the average European and American in 2035 will be as big as between the average European and Indian today. …Economic growth in the Euro Area, a region that is comparable with the US, has been deeply disappointing: the region has been falling behind the US since the 1980s… At the current growth rates, it will take 20 years for output per person to double in the US, while in the EU it would take 43 years! …only two EU member states, Luxembourg and Ireland, have a GDP per capita higher than the US average.

One of the most interesting things about the report is the comparison of E.U. nations to American states.

As you can see, almost all American states rank about almost all European nations.

By the way, the above ranking is based on GDP per capita and the report notes that this approach overstates the prosperity of Luxembourg and Ireland.

…their GDP per capita overestimates their level of prosperity. In Ireland, GDP is boosted by large foreign pharmaceutical and IT multinationals based in the country which, while producing goods and services in Ireland, record a significant proportion of their global profits within Ireland. The Central Bank of Ireland estimated that Ireland should instead rank between the 8th and 12th position in the EU if the relevant parts of per capita income are considered. For Luxembourg the story is slightly different. High GDP per capita is mainly due to the cross-border flows of workers in total employment, as they contribute to overall GDP but are not residents of the country.

If you want a less-distorted view, I recommend the OECD’s data on per-capita “Actual Individual Consumption.” And the U.S. lead based on AIC data also has expanded over time.

Read Full Post »

For a long time, the United States was ranked as having the world’s most competitive economy, according to the Swiss-based IMD World Competitiveness Center. But we fell behind Singapore and Hong Kong in 2010.

But at least the U.S. stayed in the top five for several years, which was a decent result.

Unfortunately, the U.S. then fell further back during the Trump years.

And, as you can see from this graphic, America continues to languish during the Biden years.

To read the full report and see all the data, click here.

While my main focus is America’s decline, it is also interesting to see what’s happening with other nations.

They are not shown in the above graphic, but nobody should be surprised that the last-place nation is Venezuela. Or that Argentina is the next-to-last country.

P.S. The IMD report does not measure economic liberty, though there is a correlation with the IMD results and the results from Economic Freedom of the World and the Index of Economic Freedom.

Read Full Post »

In Part I of this series, I shared some excerpts from a Wall Street Journal editorial that documented how taxpayers fleeing high-tax states such as California, New York, Illinois, and New Jersey.

Where are they going? In many cases, they are moving to zero-income-tax states such as Florida and Texas or flat-tax states such as Arizona and North Carolina.

This is not a new phenomenon. I first started writing about tax-motivated migration in early 2010.

And I suspect there will be many future columns, particularly since an impressive number of states have been improving their tax systems.

For Part II in this series, let’s look at some excerpts from an article by Patrick Villanova for Yahoo!Finance. Here are some excerpts.

When a state loses more high-earning tax filers than it gains in a given year, tax revenues may decline and the state’s fiscal situation may worsen. That’s why despite making up less than 7% of total tax returns filed across the 50 states and the District of Columbia in 2020, the migration patterns of high-earning households continue to make headlines. With this in mind, SmartAsset set out to identify the states with the most movement of high-earning households. To do this, we examined the inflow and outflow of tax filers making at least $200,000 in each state between 2019 and 2020. …There are nine states in the country that do not tax income at the state level. Four of those states – Florida, Texas, Tennessee and Nevada – are among the 10 places with the largest net inflow of high-income households. …No state is gaining more high-earning households than Florida…a net addition of 20,263 high-income filers. Like Florida, Texas – the No. 2 ranking place – does not have state income tax. …It’s no surprise that most of the states with the highest net losses of households earning over $200,000 are traditionally viewed as high-tax states. New York saw a net outflow of nearly 20,000 high-earning households in 2020, more than any state in our study. …California wasn’t far behind, losing a net figure of 19,229 high-earning filers.

This is a story about people “voting with their feet,” but there are also very important implications for state finances.

Every state has people who pay taxes (workers and businesses in the private sector) and people who consume taxes (bureaucrats, welfare recipients, interest groups, etc).

However, if a state is losing the former and retaining (or even attracting) the latter, that’s a recipe – sooner or later – for Greek-style fiscal trouble.

Which is why I have sometimes speculated that states such as California are committing slow-motion suicide.

P.S. Switching to a different topic, the article notes that, “D.C. has the largest proportion of high-earners… Households earning at least $200,000 per year make up 12.19% of all tax filers in the District of Columbia.” Unfortunately, this is not a sign that DC has good fiscal policy. Indeed, the opposite is true. What it does show is that it is very lucrative to be a bureaucrat, lobbyist, politician, or some other type of “beltway bandit.” The only solution to this problem is to shrink the size and scope of the federal government.

Read Full Post »

The big fiscal debate in the United States is whether the United States should become a European-style welfare state, which is something that automatically will happen over the next few decades in the absence of genuine entitlement reform.

Some people even want to accelerate this process.

My response is usually to ask why the United States should copy Europe when there is a wealth of evidence that living standards are substantially lower on that side of the Atlantic Ocean.

Not only are living standards lower, but there is also lots of evidence that Europe is suffering from anemic growth.

Which means the gap in living standards is getting wider every year.

At the risk of understatement, copying European fiscal policy seems like a big mistake.

If you’re still not convinced, here’s some more evidence. In his column for the U.K.-based Financial Times, Gideon Rachman compares the U.S. economy to what’s happening in Europe.

The US economy is now considerably richer and more dynamic than the EU or Britain — and the gap is growing. …In 2008, the EU and the US economies were roughly the same size. But since the global financial crisis, their economic fortunes have dramatically diverged. As Jeremy Shapiro and Jana Puglierin of the European Council on Foreign Relations point out: “In 2008 the EU’s economy was somewhat larger than America’s: $16.2tn versus $14.7tn. By 2022, the US economy had grown to $25tn, whereas the EU and the UK together had only reached $19.8tn. America’s economy is now nearly one-third bigger. It is more than 50 per cent larger than the EU without the UK.” …Europe may never summon the will to reverse its inexorable decline in power, influence and wealth.

To address the final point in the above excerpt, we know the policies that would enable a European economic renaissance.

But don’t hold your breath waiting for that to happen.

There are some European nations with reasonably good overall economic policy, but only Switzerland has a good track record with regards to fiscal policy.

And all the recent evidence suggests that most European nations are increasing the fiscal burden of government (and overall economic policy also is becoming more dirigiste).

P.S. If you want to read the article Rachman cited from the European Council on Foreign Relations, click here.

P.P.S. Even better than Switzerland, European nations could copy Monaco.

Read Full Post »

I have done eight columns comparing Texas and California and five columns comparing Florida and New York.

But maybe it is time to compare Florida and California?

If I do, there’s no comparison, at least based on how people vote with their feet. Even though California has the nation’s best climate and geography, the state’s politicians have made the state economically unattractive and people are leaving.

Indeed, the no-longer-Golden State leads the nation in out-migration.

And it probably will not surprise you to learn that Florida leads the nation in in-migration.

Why are people leaving California and why are people moving to Florida?

  • Perhaps because Florida ranks as America’s economically freest state while California is #49.
  • Perhaps because Florida ranks in the top 5 and California ranks in the bottom 5 for tax policy.
  • Perhaps because Florida ranks very high (#2) and California ranks very low (#48) for overall freedom.
  • Perhaps because Florida has no state income tax while California has the nation’s highest income tax rate.
  • Perhaps because Florida ranks #1 for school choice while California languishes in the middle of the pack.

Incidentally, I’m comparing Florida and California because that may be where 2024 (or even 2028) politics is taking us.

The Governor of Florida, Ron DeSantis is officially running for president and the Governor of California, Gavin Newsom, is unofficially running.

And because they see each other as rivals, there’s some sniping about which state has a better track record. The Wall Street Journal has opined on their disagreements.

Why not a public face-off between these two combative, young, upwardly mobile Governors? This could be the substantive argument the country needs, pitting Florida’s red-state model against California’s blue-state approach. Instead of catcalls in the media, they could make a case to the public, with evidence and data, for the country to follow their lead. Mr. DeSantis, as an announced 2024 candidate, has more to lose, but in our eyes his state has the better story, and if the Governor is confident about it, he should take the challenge. A good showing by Mr. Newsom could even nudge him into a primary against Mr. Biden. Florida vs. California is what the electorate deserves in 2024, and if it isn’t an official presidential debate, an extracurricular one beats nothing.

For what it’s worth, I hope the two of them do a public debate. We’d presumably have some honest discussion about whether government should be bigger or smaller.

And both DeSantis and Newsom could come out winners in the sense that the public would favorably compare them to the elderly frontrunners for the Republican and Democratic nominations in 2024.

But I’m not a political pundit, so that’s just a guess.

I’ll close with another look at migration data. Only this time we’ll focus on businesses rather than people. Here’s a chart from a recent Wall Street Journal column.

The good news for Newsom, at least relatively speaking, is that New York did even worse than California.

P.S. California leads Florida in per-capita income, though that’s offset by big differences in the cost of living.

P.P.S. And you can see here and here that California leads in generating political satire.

Read Full Post »

Other than doing very well in rankings of state pension debt (see here, here, and here), I’ve never had any reason to notice public policy in Nebraska.

That changes today because the Cornhusker State has – like about two dozen other states – lowered income tax rates.

The widespread shift to better state tax policy is a very positive development, second only to the really great news about school choice.

Let’s take a closer look about the good news from Nebraska.

The Wall Street Journal editorialized about the state’s new tax changes, including some special attention for the improvements in business taxation.

The gulf between high- and low-tax states keeps growing, and Nebraska is the latest to use budget surpluses to cut income and property taxes—and in a big way. …An income-tax cut will bring the top rate down to 3.99% from 6.64% by 2027, and a separate cut will slash the corporate tax to the same 3.99% rate from 7.25% today. …A two-year term limit for legislators has helped produce crops of increasingly market-friendly lawmakers. Interstate competition has also kept the tax pressure on. …neighboring Missouri cut its top rate on income to 4.95%, and Iowa followed up its recent flat-tax plan with additional cuts to property taxes. …More than half of all states have reduced their income-tax rates since 2021… Fewer states have cut corporate rates. In slashing its tax on businesses, Nebraska will leapfrog its neighbors to boast the lowest rate in the region after zero-tax South Dakota and Wyoming.

Kudos to Nebraska. They’ve moving from Column 4 to Column 3 in my state tax ranking.

The next step hopefully will be a flat tax.

P.S. Some state tax cuts are hardly worthy celebrating.

P.P.S. Massachusetts and Washington are among the few states moving in the wrong direction.

Read Full Post »

Give Minnesota politicians credit for consistency. Their policies have Minnesota ranked #39 in both Economic Freedom of North America and Freedom in the 50 states.

Those are ratings for overall economic freedom.

When looking specifically at fiscal policy, the state is in even worse shape.

The Tax Foundation calculates that Minnesota is only #45 in the State Business Tax Climate Index.

And the state’s governor, Tim Walz, received a failing grade in the Fiscal Policy Report Card on America’s Governors.

All things considered, Minnesota is not in good shape. That being said, it’s always possible to go downhill.

That will probably happen because the left this year is using Minnesota as a laboratory for statist economic policies.

Here’s some right-of-center analysis from the editors of National Review.

Minnesota has long been liberal, but with a frequently divided government that kept its radicalism tethered. …2022 was hardly a sweeping mandate. …The state senate went from a 34–33 Republican majority to a 34–33 DFL majority. On that slim basis, the DFL set out to turn the state overnight into a frozen California. The legislature, with the eager connivance of Governor Tim Walz, voted routinely in partisan lockstep to enact a wish list of left-wing radicalism. …a massive budget spree, blowing in a single session Minnesota’s $17.5 billion surplus, most of it on spending and the rest on one-time “tax rebates” that will do nothing to improve the state’s tax climate going forward. The state’s $72 billion budget increases spending by 38 percent over 2022 levels, plus $2.6 billion in additional infrastructure spending that is heavily financed by debt. Pricey new programs were created, such as free public college (subject to a means test), universal free breakfasts and lunches for all students, up to twelve weeks of state-financed family and medical leave, expanded free-housing vouchers, and free menstrual products in schools. …Taxes on most Minnesotans will be going up to pay for all this. Gas taxes will be hiked by as much as five cents a gallon over the next four years. Sales taxes will increase by one percentage point. A payroll tax will be added to finance the family- and medical-leave program.

Not everyone is unhappy about these developments.

Here’s a left-of-center perspective from E.J.Dionne of the Washington Post. He cites many of the same policies, but he argues that the state is moving in the right direction.

The avalanche of progressive legislation that the state’s two-vote Democratic majority in the Minnesota House and one-vote advantage in the state Senate have enacted this year is a wonder to behold. …former president Barack Obama tweeted recently: “If you need a reminder that elections have consequences, check out what’s happening in Minnesota.” …while a two-year budget surplus of $17.5 billion set expectations “very high” for what could be done, $10 billion of it was “one-time money,” meaning that programs had to be funded and revenue raised for the long term. …What makes Minnesota’s experience this year unusual? State Democratic leaders said in interviews that as soon as they learned in November that they would have their first trifecta in a decade — meaning control of both chambers and the governorship — they decided they would not hold back to calculate the politics of every move.

So who is right, National Review of Mr. Dionne?

Regular readers won’t be surprised to learn that I agree that it is a mistake to turn Minnesota into a “frozen California.”

There are plenty of states with better tax policy, including neighbors with no income tax (South Dakota) or low-rate flat taxes (Iowa), so I expect we will see an increase in the rate of out-migration.

And if the productive people want warm weather as well, there are even more zero-tax options (Texas, Florida, etc) and flat-tax options (Arizona, North Carolina, etc).

Read Full Post »

I have written very favorably about Hong Kong and I have also sung the praises of Singapore. But if you want to know which jurisdiction has a brighter future, it certainly seems like Singapore will be the long-run winner.

The above video is a segment from my recent interview with the Soul of Enterprise, which mostly focused on fiscal issues such the debt limit and spending caps.

I was glad, however, that we briefly detoured to a discussion of the two Asian city states.

Neither jurisdiction is perfect, of course, but both Singapore and Hong Kong have very pro-market policies by global standards.

And they both showed that it is possible to escape the “middle-income trap.”

But which one is doing the best?

According to the Maddison data shown in this chart, Singapore has vaulted ahead in the past two decades.

I included the United States for purposes of comparison. And it is remarkable how both Singapore and Hong Kong used to be very poor by comparison.

But let’s get back to the main focus of today’s column.

A recent article in the U.K.-based Economist compares Singapore and Hong Kong.

In economic dynamism, the state of the urban fabric and the vibrancy of civic life, which city comes top: Hong Kong or Singapore? Until not long ago, it was obvious…that Hong Kong won hands down. But recently the balance shifted. There is clearly no contest anymore. It is game over in favour of Singapore. …Hong Kong and Singapore, once dirt-poor, have astonishing success stories to tell. Both are hubs for international finance, trade, transport and tourism. Both have attracted the brightest professional minds. …The imposition of a draconian national-security law in 2020 marked the obvious break in Hong Kong’s trajectory. …Some 200,000 expatriates have left Hong Kong in the past three years, along with even more Hong Kongers. By contrast, in 2022 the number of foreign professionals in Singapore grew by 16%… In 1997, the year of Hong Kong’s return to China, the two cities’ GDP per person was remarkably similar ($26,376 in Singapore, $27,330 in Hong Kong). Today Singapore’s is 1.7 times higher than Hong Kong’s. Singapore’s economy has grown by one-seventh since 2017; Hong Kong’s not at all. …Singapore is at a crossroads. Hong Kong has hit a dead end.

The bottom line is that China’s takeover of Hong Kong has had a negative effect.

As I noted in the video clip, economic policy has not moved significantly in the wrong direction, but entrepreneurs and investors do not trust Beijing.

That skepticism may be warranted.

P.S. As part of my anti-convergence club, I’ve compared Hong Kong and Cuba, along with Singapore and Jamaica.

Read Full Post »

I realize it’s not nice to take pleasure in the misfortune of others, but that rule does not apply when bad things happen to greedy politicians.

As such, I greatly enjoy reading about when taxpayers “vote with their feet” by moving from high-tax jurisdictions to low-tax jurisdictions.

I enjoy when there is tax-motivated migration between nations.

And I enjoy when there is tax-motivated migration between states.

Regarding the latter version, there’s a must-read editorial in the Wall Street Journal about the ongoing exodus from fiscal hellholes such as Illinois, New York, and California.

The IRS each spring publishes data on the movement of adjusted gross income (AGI) and taxpayers across state lines from year to year. …the IRS data shows blue states are losing taxpayers and income at an increasing clip. …a net 105,000 people left Illinois in 2021, taking with them some $10.9 billion in AGI. That’s up from $8.5 billion in 2020 and $6 billion in 2019. New York’s income loss increased to $24.5 billion in 2021 from $19.5 billion in 2020 and $9 billion in 2019. California lost $29.1 billion in 2021, more than triple what it did in 2019. By contrast, the lowest tax states added some $100 billion of income during the pandemic. Zero-income-tax Florida gained $39.2 billion—up from $23.7 billion in 2020 and $17.7 billion in 2019. About $9.8 billion of the total arrived from New York, $3.9 billion from Illinois, $3.7 billion from New Jersey and $3.5 billion from California. Texas was another winner, attracting a net $10.9 billion in 2021, which follows a gain of $6.3 billion in 2020 and $4 billion in 2019. Californians represented more than half of Texas’s income gain in 2021.

Congratulations to Texas and Florida. Having no income tax is definitely a smart step.

Here is a chart that accompanied the editorial.

By the way, migration is the headline event, but it is also important to pay attention to who is migrating.

The WSJ‘s editorial notes that the people leaving high-tax states tend to be economically successful.

The IRS data shows that the taxpayers leaving Illinois and New York typically made about $30,000 to $40,000 more than those arriving. Of Illinois’s total out-migration, 28% of the leavers made between $100,000 to $200,000 and 23% made $200,000 or more. By contrast, the average return of a Florida newcomer in 2021 was about $150,000—more than double that of taxpayers who left. High earners spend more, which yields higher sales tax revenue. This helped Florida post a record $22 billion budget surplus last year. California is forecasting a $29.5 billion deficit.

In other words, the geese with the golden eggs are flying away.

Read Full Post »

I’ve written many times about the harmful consequences of the federal death tax. Simply stated, it is both immoral and foolish for the IRS to grab as much as 40 percent of someone’s assets simply because they die.

That drains private capital from the economy and is a de facto heavy tax on those who save and invest (triple or quadruple taxation!).

That’s the bad news.

The worse news is that some states augment the damage with their own death taxes. Here’s a map from the Tax Foundation showing which states shoot themselves in the foot.

For those curious, the estate tax is imposed on the dead person’s assets and an inheritance tax is imposed on the the people who inherit the dead person’s assets.

In both cases, it’s bad news.

How bad?

There’s some new research from a couple of scholars examining this topic. Enrico Moretti of Berkeley and Daniel J. Wilson of the San Francisco Federal Reserve have a study published by the American Economic Journal that quantifies the impact of state death taxes on location choices.

In this paper, we contribute to the literature on the effect of state taxes on the locational choices of wealthy individuals by studying how estate taxes affect the state of residence of the American ultra-rich and the implications for tax policy. …Specifically, we estimate the effects of state-level estate taxes on the geographical location of the Forbes 400 richest Americans between 1981 and 2017. We then use the estimated tax mobility elasticity to quantify the revenue costs and benefits for each state of having an estate tax. We find that billionaires’ geographical location is highly sensitive to state estate taxes. Billionaires tend to leave states with an estate tax, especially as they get old. …On average, estate tax states lose 2.35 Forbes 400 individuals relative to non–estate tax states. …—21.4 percent of individuals who originally were in an estate tax state had moved to a non–estate tax state, while only 1.2 percent of individuals who originally were in a non–estate tax state had moved to an estate tax state. The difference is significantly more pronounced for individuals 65 or older… Overall, we conclude that billionaires’ geographical location is highly sensitive to state estate taxes. …We estimate that tax-induced mobility resulted in 23.6 fewer Forbes 400 billionaires and $80.7 billion less in Forbes 400 wealth exposed to state estate taxes.

What makes the study especially persuasive is that state death taxes suddenly no longer could be offset against federal death taxes because of a policy change in 2001.

That meant post-2001 data should look different. And that’s exactly what the authors found, as illustrated in Figure 6 of the study.

Here are some final excerpts from the conclusion.

The 2001 federal tax reform introduced stark cross-state variation in estate tax liabilities for wealthy taxpayers. Our findings indicate that the ultra-wealthy are keenly sensitive to this variation. Specifically, we find that billionaires responded strongly to geographical differences in estate taxes by increasingly moving to states without estate taxes, especially as they grew older. Our estimated elasticity implies that $80.7 billion of 2001 Forbes 400 wealth escaped estate taxation in the subsequent years due to billionaires moving away from estate tax states.

By the way, the study said that most states still wind up collecting net revenue because of death taxes.

In other words, the death tax revenue from remaining rich people is generally greater than the foregone income tax revenue because of those who left.

But I wonder if those findings would be true if the authors had been able to measure the secondary effects such as lost sales tax revenue, lost property tax revenues, and (perhaps most important) lost income tax revenue from people who did business with escaping rich people.

But, regardless of the findings, it is always immoral and wrong for politicians to impose taxes simply because someone dies.

P.S. In Australia, people changed when they died because of the death tax.

P.P.S. In France, people changed who they were because of the death tax.

P.P.P.S. In Ireland, people pretended to change their sexual orientation because of the death tax.

Read Full Post »

I normally write a column every year (2021, 2020, 2019, etc) when the Tax Foundation releases its International Tax Competitiveness Index, in part because I’m curious to see how the United States compares to other developed nations.

I somehow overlooked the 2022 version, but there’s a very good reason to cite the Index today. In the latest version, Estonia retains its #1 ranking, which is no surprise.

And, as you can see from the map, France is #38, giving it the worst tax system among industrialized nations.

I want to focus on France because the nation is in the midst of a massive political controversy over President Macron’s plan to increase the retirement age from 62 to 64.

That’s too little and too late from my perspective, given the country’s terrible fiscal outlook.

Some people, however, don’t understand this reality. In a column for the New York Review, Madeleine Schwartz writes that Macron’s plan “has few supporters among French economists.” Here are some excerpts.

Macron and his defenders have called the reform a necessity. …But one group of voices has been missing among the commentators advocating for the change. “You won’t find many economists defending this reform,” says the economist Mathieu Plane, who works at the French Observatory of Economic Indicators… Patrick Artus, a well-known economist who currently works as an advisor to the French bank Natixis, told me that the government has several tools at its disposal… They might increase taxes. “The government has a complete block on raising taxes,” he says. “And yet there are some tax increases that would be legitimate.” …Instead the government has forced forward a law that many economists consider both inequitable and ineffective. …“It’s a pretty brutal measure,” says Camille Landais, chairman of the French Council of Economic Advisers.

Wow, what an indictment of French economists. Are they really that clueless? Are they the ones who are bad at math?

It’s hard to answer those question.

But I can say with certainty that big tax increases are not the solution when France already has the developed world’s worst tax system, with terrible grades in all but one category.

What’s especially amazing is that some of the French economists inadvertently confirm my argument that Macron did not go far enough.

A number of economists have questioned whether the reform would do much to solve the larger issue, which is that the population is aging and productivity levels do not balance the cost of demographic change. By making older workers work longer, the reform will only raise the employment rate by about one point, says Artus, even though France’s employment rate is about nine points less than, for example, Germany’s.

Yet, amazingly, their view is to do nothing other than double down on the policies that have produced low levels of employment.

I’ve joked in the past that economists are untrustworthy, and perhaps even despicable and loathsome. In France, it appears that my satire is reality.

P.S. Today’s column focused on France. For those interested in other nations, here’s the full Index.

The United States ranked #22, which is bad but not as bad as it used to be. Kudos to the Baltic nations, as well as New Zealand and Switzerland. Sympathy for the mistreated taxpayers of Italy and Portugal (as well as Ireland, where the benefits of a low corporate rate are offset by very bad scores in other areas).

Read Full Post »

Last week, I wrote about Biden’s proposed budget, focusing on the aggregate increase in the fiscal burden.

Today, let’s take a closer look at his class-warfare tax proposals. Consider this Part VI in a series (Parts I-V can be found hereherehere, here, and here), and we’ll use data from the folks at the Tax Foundation.

We’ll start with this map, which shows each state’s top marginal tax rate on household income if Biden’s budget is enacted.

The main takeaway is that five state would have combined top tax rates of greater than 50 percent if Biden is successful in pushing the top federal rate from 37 percent to 39.6 percent.

At the risk of understatement, that’s not a recipe for robust entrepreneurship.

While it is a very bad idea to have high marginal tax rates, it’s also important to look at whether the government is taxing some types of income more than one time.

That’s already a pervasive problem.

Yet the Tax Foundation shows that Biden wants to make the problem worse. Much worse.

His proposed increase in the corporate tax rate is awful, but his proposal to nearly double the tax burden on capital gains is incomprehensibly foolish.

I guess we should be happy that Biden didn’t propose to also increase the 40 percent rate imposed by the death tax.

But that’s not much solace considering what Biden would do to American competitiveness. Here’s our final visual for today.

As you can see, the president wants to make the US slightly worse than average for personal income taxes, significantly worse than average for the corporate income tax, and absurdly worse than average for taxes on capital gains and dividends.

I’ll close by observing that some of my leftist friends defend these taxes since they target the “evil rich.”

I have a moral disagreement with their view that people should be punished simply because they are successful investors, entrepreneurs, or business owners.

But the bigger problem is that they don’t understand economics. Academic research shows that ordinary workers benefit when top tax rates are low, and there’s even more evidence that workers are hurt when there is punitive double taxation on saving and investment.

Read Full Post »

Last year’s three-part series on corporate tax rates (here, here, and here) primarily focused on the case for low rates in the United States.

Today, we’re going to look at why the United Kingdom should have a low corporate tax rate.

Though the arguments don’t change simply because we cross the Atlantic Ocean.

A low corporate tax rate is a good idea because it means more investment, higher productivity, and better wages.

That’s true in the U.S., it’s true in the U.K., and its true in every other nation.

If you want evidence, Phil Radford’s article for CapX explains why the U.K.’s pharmaceutical industry has contracted while Ireland’s has expanded.

AstraZeneca’s plan to build a $350m pharmaceuticals factory in Ireland rather than the UK was 100% predictable. …the long-term failure of UK pharma highlights how UK policy discussion is light years behind our competitors when it comes to understanding what drives prosperity. …The trend kicked off back in 2011, when US-based Pfizer shifted its Viagra-making plant from Sandwich in Kent to Ringaskiddy, near Cork. This event marked the start of a five-year plunge in UK pharma manufacturing and exports… According to ONS, output in UK pharma manufacturing declined by roughly one-third from 2010 to 2015. Gross value added actually halved. Where did the manufacturing go? Ireland… What’s caused this malady? In a word: taxation. …corporate taxation levels appear to exert a dominating effect on where pharmaceuticals companies locate their factories. …Ireland’s corporate tax rate fell from 40% in 1996 to 12.5%n 2003, and it has stayed at that level for the past 19 years. Meanwhile, the UK’s corporate taxation rate was 30% 20 years ago, and from 2008 it began a gentle drift downwards to 19% where it will remain until April this year, when it will increase to 25%. This means, from AstraZeneca’s point of view, the investment equation is a no-brainer. Even if Ireland is forced to raise its rate to 15%, the country will shortly regain its general comparative level of between one-half and two-thirds the UK rate.

The data in Radford’s article is a damning indictment of the supposedly conservative government in the United Kingdom.

A few years ago, the corporate tax rate was 19 percent and expected to drop to 17 percent. Now, thanks to an unwillingness to control spending, the rate is jumping to 25 percent.

And, as noted in the article, the U.K. lost a $350 million factory. As well as all the jobs and taxable income that it would have generated.

Politicians are winning and people are losing.

P.S. Biden wants to make the same mistake.

Read Full Post »

The first four rounds of my New York vs. Florida contest (available here, here, here, and here) largely focused on Florida’s superior economic policies and superior economic results.

So you won’t be surprised to learn that Round #5 continues that tradition.

We’ll start today’s column with a remarkable comparison put together by the Wall Street Journal.

Notice that Florida now has more population (thanks in large part to interstate migration), yet New York’s budget is twice as big.

That means a much higher tax burden.

And New York’s onerous fiscal burden doubtlessly helps to explain why Florida has been growing so much faster, and also has a much lower unemployment rate.

The Wall Street Journal connected the dots as part of its editorial.

Comparative governance is a useful course of study, not least because bad governance is so costly to people and prosperity. We often write about the migration from the Northeast to Florida and other states, but sometimes the contrast is best illuminated with some data. …As recently as 2013 the two states had similar populations, but so many people have moved to the Sunshine State that it’s now roughly 2.6 million people larger. Yet, believe it or not, Florida’s state budget as measured in the latest proposals from the two governors, is only half the size of New York’s. This is in part a reflection of their tax burden, which in Florida is much smaller. …Florida has no state income tax, while New York’s top tax rate is 10.9%. In New York City, the top rate is 14.8%, while in Miami it’s zero. …Florida’s jobless rate was 2.5% in December, well below the January national 3.4% rate. New York’s rate was 4.3%, tied with Alaska and Michigan for fifth worst in the country… State GDP growth in Florida in 2012 dollars from 2016-2021 was more than double New York’s—17% to 8%. These comparative statistics…show that better governance yields better fiscal and economic results.

Amen.

I’ve written that there’s a link between national policy and national prosperity.

The same is true for state policy and state prosperity.

P.S. A reader sent me a fill-in-the-blanks essay generator for leaving New York. It focuses on quality of life rather than public policy, but I nonetheless made some choices.

P.P.S. Another Florida advantage is a lower cost of living.

P.P.P.S. New York’s absurd Medicaid spending (presumably enabled by this type of scam) is yet another reason to reform that money-pit program.

Read Full Post »

When I first started citing the Tax Foundation’s State Business Tax Climate Index back in 2013, North Carolina was one of the 10 worst states.

In a remarkable turnaround, North Carolina is now one of the 10 best states.

The big improvement is partly because the state joined the flat tax club.

But there were other tax cuts as well, along with some much-needed spending restraint.

Sounds like great news, but you won’t be surprised to learn that not everyone is happy about what’s happened in the Tarheel State.

In a column for the Raleigh News & Observer, Ned Barnett opined yesterday against tax cuts – both the ones that already have occurred and the new ones that the state legislature is considering.

Republican state lawmakers think cutting taxes makes North Carolina more attractive to new businesses, but cutting taxes too much has the opposite effect. …Now, with the General Assembly back in session, they’re looking to cut some more. It’s a reckless path… Since Republicans began aggressively cutting taxes in 2013, the state has lost billions of dollars in revenue. …North Carolina has excess revenue because the state has reduced what it has historically spent as a share of the state economy – a drop from 5.8 percent to 4 percent… The state corporate tax has fallen from 6.9 percent to 2.5 percent and will be phased out by 2030. The personal income tax has been stepped down from a two-tier progressive tax with a top rate of 7.75 percent to a flat tax of 4.75 percent today. Now state Senate leader Phil Berger says the legislature should consider cutting the personal income tax to 2.5 percent.

The most important data cited above is that the burden of state government spending has dropped from 5.8 percent to 4 percent of the state economy.

This upsets Mr. Barnett, but the rest of us should view this as a major triumph for genuine fiscal responsibility.

And by imposing genuine spending restraint, North Carolina lawmakers created the “fiscal space” for meaningful tax cuts.

So why is Mr. Barnett upset? In the column, he complains that some parts of the budget are not increasing as fast as he would like. But he never offers any evidence that the state is suffering economic harm.

I suspect he offered no evidence because he has no evidence.

Or perhaps he offered no evidence because the data shows that he’s wrong.

And that’s exactly what I discovered when I checked the St. Louis Federal Reserve Bank’s per-capita income data. Lo and behold, incomes in North Carolina are growing faster than the national average and faster than the regional average.

The differences are not huge, but it’s nonetheless better to have faster income growth rather than slower income growth.

Some of my more sophisticated friends on the left doubtlessly will point out that states in other regions still have higher overall levels of average income, which is a fair point, but it’s also fair for me to respond by noting that the cost-of-living is generally much lower in North Carolina.

The bottom line is that North Carolina’s better tax policy has the state moving in the right direction while high-tax states are moving in the wrong direction.

P.S. North Carolina also is close to being among the 10 best states for educational freedom.

Read Full Post »

According to the Fraser Institute’s Economic Freedom of the World, New Hampshire was the most economically free state in America in 2017, 2018, and 2019.

But the state famous for “Live Free or Die” has now been replaced by the Sunshine State.

The most-recent edition, which is based on 2020 data, informs us that Florida now enjoys more economic liberty than any other state.

New Hampshire still is ranked very high, coming in at #2, followed by South Dakota at #3. Texas and Tennessee are tied for #4.

What’s the one thing they all have in common? No state income tax.

Meanwhile, the report also highlights the states that (predictably) dominate the bottom of the rankings.

For the purpose of comparing jurisdictions within the same country, the subnational indices are the appropriate choice. …In the United States, the most economically free state was Florida at 7.94, followed by New Hampshire at 7.84, South Dakota at 7.75, and Texas and Tennessee at 7.66. (Note that since the indexes were calculated separately for each country, the numeric scores on the subnational indices are not directly comparable across countries.) The least-free state was again New York at 4.25, following California at 4.59, Hawaii at 4.65, Vermont at 4.70, and Oregon at 4.92. For the first time, we have made a preliminary attempt to include the US territory of Puerto Rico in the US subnational index. It came in with a score of 2.04. The next lowest score was more than twice as high.

Here are the full rankings at the subnational level (i.e., measuring the policies that are under the control of state lawmakers).

For the first time, the report assesses Puerto Rico. Hardly a surprise to see where it ranks.

The report also has an “all-government” ranking, which includes the effect of both national and subnational governments.

On that basis, New Hampshire is in first place.

The all-government index includes…comparisons among Canadian, Mexican, and US subnational jurisdictions that take into account national policies affecting all jurisdictions within each country. …The top jurisdiction is New Hampshire at 8.10, followed by Florida (8.05), Utah (8.03), and then Idaho and South Carolina, tied for fourth (8.02).

The all-government scores allow comparison of all the state and provinces in the US, Canada, and Mexico.

The one clear takeaway is that Mexico desperately needs pro-market reforms.

I’ll close by observing that almost every US state ranks above every Canadian province.

But that wasn’t always the case. Which shows that Justin Trudeau is pushing Canada in the wrong direction even faster than American politicians are pushing the US in the wrong direction.

Read Full Post »

Because I dedicated last week to European fiscal policy, I didn’t get a chance to write about the Tax Foundation’s latest version of the State Business Tax Climate Index, which was released October 25.

Last year, the top-4 states were Wyoming, South Dakota, Alaska, and Florida. This year’s report, authored by Janelle Fritts and Jared Walczak, says the top-4 states are… (drum roll, please) …exactly the same.

Here’s the map showing how states rank. The best states are blue and the worst states are dark grey.

Coincidentally, the bottom-4 states also stayed constant. New Jersey is in last place, followed by New York, California, and Connecticut.

But there were some very interesting changes if you look at the other 42 states.

Thanks to pro-growth tax reforms, Arizona and Oklahoma both jumped 5 spots in the past year.

The state of Washington suffered a huge fall, dropping 13 spots thanks to the imposition of a capital gains tax (the state constitution supposedly bars any taxes on income – and voters last fall overwhelmingly voted against the capital gains tax – but it appears the state’s politicians and a negligent judiciary may combine to put the state on a very bad path).

It’s also interesting to look at long-run trends. If you compare this year’s Index with the original 2014 Index, you’ll find that three states have jumped by at least 10 spots and three states have dropped by at least 10 spots.

Since I’m a Virginia resident, this is not encouraging news.

P.S. As I’ve noted before, the rankings for Alaska and Wyoming are somewhat misleading. Both states have lots of energy production and their state governments collect enormous amounts of taxes from that sector. This allows them to keep other taxes low while still financing bloated state budgets.

Read Full Post »

The European Union started as a good idea (unfettered free trade between member nations) and has morphed into a troubling idea (a super-state based on centralization, harmonization, and bureaucratization).

And I fear it is heading further in the wrong direction since many European politicians want European-wide taxes and spending to facilitate more redistribution (on top of all the taxes and spending by member nations!).

Even if it means breaking existing EU rules in order to make government bigger.

Today, as part of “European Fiscal Policy Week,” let’s assess whether the EU is a positive or negative force.

And I’ll start by observing that the economic data is unfavorable when compared to the United States. Not only are living standards lower in EU nations, but those countries also are continually falling further behind.

It’s possible, of course, that these countries would be even further behind if there was no European Union, but the academic evidence points in the other direction.

In an article for Law & Liberty, Douglas Carswell questions the very existence of the European Union.

Instead of asking if Europe can hold together, we should be asking if Europe should be held together at all. Why is it felt necessary to unify Europe’s disparate peoples in the first place? What is it that compels European leaders to support pan-European systems of governance at all? It is not as if European integration has been a success. …If the Euro was supposed to give Europe a competitive edge, how come the Eurozone lags behind the rest of the world by almost every measure of output and innovation? …The urge to integrate came about, it is often suggested, to prevent Germany from becoming overbearing… Seriously? Does anyone really believe that if it was not for an army of bureaucrats in Brussels these past thirty years, Germany might have invaded France again? …Maastricht, and indeed the various subsequent EU treaties, need to be seen for what they are: a power grab by Europe’s political elites. …Thirty years after Maastricht, the European Union is no more capable of making the kind of reforms it needs to save itself than it was back then. Rather like the Habsburg Empire, to which it is in many ways the successor, the European Union will stumble on, lurching from crisis to crisis, bits of it breaking away from time to time, as a once-great civilization becomes a cultural and economic backwater.

In a way that appeals to me, Liam Warner explains in National Review that the European Union represents the wrong type of globalism.

The 1957 Treaty of Rome established the European Economic Community, for example, was a customs union by which member countries agreed to trade freely with one another and maintain common external tariffs. With the 1993 Treaty of Maastricht, which established the EU, and its subsequent amendments, European integration began to look less like a cooperation of equals and more like a submission to a supranational authority. …internationalism in its modern form has often been a means of…imposing on the world a stultifying monotony… The deep flaws of the present system having been exposed, European leaders must give up their dream…and revisit their ancestors’ healthier forms of globalism.

That “healthier form of globalism” should be based on jurisdictional competition and mutual recognition.

Is that remotely feasible?

A few European leaders realize that there’s too much centralization. Kai Weiss highlighted the views of the Dutch Prime Minster in a column for CapX.

In his Strasbourg speech on the future of Europe, Mark Rutte struck a markedly different tone and delivered an entirely different message to Macron and others. The Prime Minister of the Netherlands has recently come to the fore as one of Europe’s more sceptical voices. Speaking in front of the European Parliament, he once again made it clear that for him, more and more EU is simply not the answer to today’s problems. “For some, ‘ever closer union’ is still a goal in itself. Not for me,” Rutte said… Instead of finding ever new competences and tasks, Rutte argued that Brussels should hold onto the “original promise of Europe”, the “promise of sovereign member states working together to help each other achieve greater prosperity…” For Rutte, this means focusing on the core benefit of the EU: free trade. …the emergence of the Netherlands, as well as Nordic and Baltic states, as vocal critics of Macron’s federalist plans should be the source of much hope for Europe’s future.

I applaud that there are a few leaders and a few governments trying to block further centralization.

But I have three reasons for being a pessimist about the European Union.

  • First, I don’t think there’s any hope for achieving any decentralization. Indeed, the more sensible people in Europe will face endless battles to stop bad ideas.
  • Second, Europe’s demographics are terrible. And that will specifically mean lots of pressure for redistribution by imposing EU-wide taxes and spending.
  • Third, public policy is moving in the wrong direction at the national level. This compounds the damage of bad policies imposed by EU bureaucrats in Brussels.

Here’s a chart, based on the latest edition of Economic Freedom of the World, showing how economic liberty is declining in the nations that dominate the European Union.

P.S. For amusement value, here’s a cartoon showing the future of the European Union.

P.P.S. If you like European-themed satire, click here, here, here, here, here, here, and here.

P.P.P.S. On a related note, Brexit-themed humor can be found here, here, here, and here.

Read Full Post »

Older Posts »