Feeds:
Posts
Comments

Archive for the ‘Fiscal Policy’ Category

The Laffer Curve is a method for illustrating the relationship between tax rates, taxable income, and tax revenue.

But it’s important to realize that there are actually lots of varieties.

The Laffer Curve for capital gains taxes, for instance, will look different than the Laffer Curve for payroll taxes. Or corporate taxes. Or marijuana taxes.

In every case, the shape of the curve will depend on what’s being taxed and the ability of affected taxpayers to alter their behavior.

And the shape of the Laffer Curve also will depend on whether one is measuring the short-run revenue impact of tax changes or the long-run impact of tax changes.

Given all these varieties, no wonder so many people, both right and left, sometimes misstate its meaning.

Let’s try to expand our understanding of the Lafffer Curve by looking at some new research.

Professor Aaron Hedlund of the University of Missouri authored a study on the Laffer Curve for the Show Me Institute.

Here’s what he wants to understand.

Empirically, recent research provides a variety of estimates for the revenue-maximizing and welfare-maximizing tax rates, but one lesson that emerges is that analyses that only take into account the response of hours worked to tax increases are bound to greatly overestimate the amount of new revenue that can be raised while underestimating the economic damage from lost GDP growth and wages. This paper examines the relationship between tax rates and revenue by taking a broader view that encompasses the responses of skill acquisition, entrepreneurship, innovation, and the labor market behavior of dual-earner families. The bottom line that emerges is that these additional margins of adjustment imply significantly lower revenue-maximizing and welfare-enhancing tax rates.

He then explains that some economists fail to look at all possible behavioral responses.

Traditionally, much of the economic analysis aimed at finding this peak rate has focused on how the income tax rate affects an individual’s willingness to work, both with regard to hours worked and the decision to enter the labor force at all. Moreover, until the recent arrival of better data, much of the academic research considered only the response of heads of households. …This assumption of tax rate insensitivity led economists Peter Diamond and Emmanuel Saez to conclude that the optimal—revenue maximizing—top income tax rate is 73%. Moreover, in an analysis that also considers the social insurance benefits of progressive taxation—specifically, the ability of redistribution to soften the blow of unexpected economic hardship—economists Fabian Kindermann and Dirk Krueger provide justification for a top rate that approaches 90%. However, both studies omit the many other margins of behavioral adjustment that accompany any significant change to tax rates.

When all behavioral responses are measured, it turns out that the revenue-maximizing rate is much lower.

In one study that accounts for the sensitivity of entrepreneurs to tax rates, increasing the progressivity of the income tax code leads to a revenue-maximizing top rate of only 33%. Furthermore, in this case revenues only increase by 5%—amounting to less than one percentage point of GDP. Another study finds even starker results when looking at the subset of superstar entrepreneurs. In an analysis that incorporates the positive spillovers of ideas and innovation on economic growth, economist Charles Jones finds that the revenue-maximizing tax rate may even be as low as 29%. Furthermore, he shows that raising the top income tax rate to 75% could reduce GDP by over 8%, which would greatly blunt the impact on revenues by shrinking the tax base.

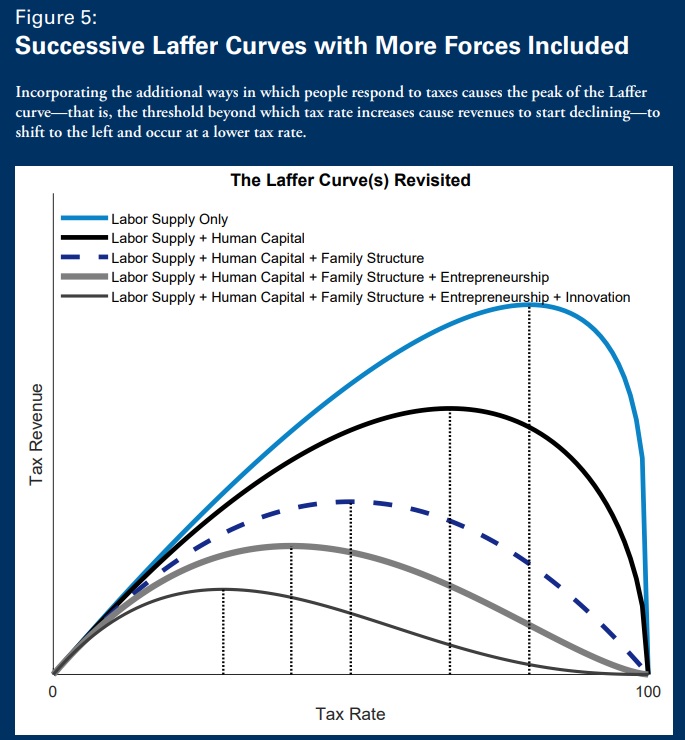
Figure 5 from the study shows how the revenue-maximizing rate varies depending on which factors are included in the study.

My two cents on this issue is to remind readers that we don’t want to maximize revenue for politicians.

As such, I don’t care if the revenue-maximizing rate in 29 percent or 73 percent.

I want to be at the growth-maximizing rate, which is where the government only collects the amount of money that is necessary to finance genuine public goods.

Needless to say, that means tax rates (and spending burdens) far lower than today.

P.S. Tax accountants have a very good understanding of the Laffer Curve.

P.P.S. Heck, even the thugs from ISIS understand the Laffer Curve.

P.P.P.S. Sadly, it doesn’t matter if some leftists understand the Laffer Curve.

Read Full Post »

I’ve repeatedly heaped praise on Ronald Reagan.

I’ve also lauded Calvin Coolidge on several occasions.

And I even once extolled the virtues of Grover Cleveland.

Today, we’re going to celebrate the fiscal achievements of Warren Harding.

Most notably, as illustrated by this chart based on OMB data, he presided over a period of remarkable spending discipline.

Harding also launched very big – and very effective – reductions in tax rates.

And his agenda of less government and lower tax rates helped bring about a quick end to a massive economic downturn (unlike the big-government policies of Hoover and Roosevelt, which deepened and lengthened the Great Depression).

In an article for National Review last year, Kyle Smith praised President Harding’s economic stewardship.

In a moment of national crisis, Warren G. Harding restored the economic health of the United States. …America in 1921 was in a state of crisis, reeling from the worst recession in half a century, the most severe deflationary spiral on record… Unemployment, it is now estimated, stood somewhere between 8.7 and 11.7 percent as returning soldiers inflated the size of the working-age population. Between 1919 and August of 1921 the Dow Jones average plummeted 47 percent. Harding’s response to this emergency was largely to let the cycle play out. …The recession ended in mid-year, and boom times followed. Harding and Congress cut federal spending nearly in half, from 6.5 percent of GDP to 3.5 percent. The top tax rate came down from 73 percent to 25, and the tax base broadened. Unemployment came down to an estimated 2 to 4 percent. …Harding was a smashing success in a historically important role as the anti-Wilson: He restored a classically liberal, rights-focused, limited government, and deserves immense credit for the economic boom that kicked off in his first year and continued throughout the rest of the 1920s.

Smith’s article also praises Harding for reversing some of Woodrow Wilson’s most odious policies, such as racial discrimination and imprisoning political opponents (Wilson also had a terrible record on economic issues).

Now let’s look at some excerpts from a new article authored by Vance Ginn of the Texas Public Policy Foundation and John Hendrickson of the Iowans for Tax Relief Foundation.

President Harding assumed office in 1921 when nation was suffering an overlooked severe economic depression. Hampering growth were high income tax rates and a large national debt after WWI. …President Harding’s chief economic policy was to rein in spending, reduce tax rates, and pay down debt. Harding…understood that any meaningful cuts in taxes and debt couldn’t happen without reducing spending. …Not only was Harding successful in this first endeavor to reduce government expenditures, his efforts resulted in “over $1.5 billion less than actual expenditures for the year 1921.”  …The decade had started in depression and by 1923 the national economy was booming with low unemployment. 

By the way, the $1.5 billion-plus reduction from 1921 to 1922 may not sound like much, but it was a 30 percent reduction in the size of government (and this was back in the days when government was a relatively small burden).

That would be akin to cutting more than $1.5 trillion from this year’s federal budget.

What a great idea – perhaps even better than my other libertarian fantasy.

P.S. Thomas Sowell has praised Harding’s economic policies.

P.P.S. And I’ve applauded Bill Clinton’s economic policies. Or, to be more precise, I’ve praised the policies that were enacted during his presidency.

Read Full Post »

The title of this column is an exaggeration. What we’re really going to do today is explain the main things you need to know about government debt.

We’ll start with this video from Kite and Key Media, which correctly observes that entitlement programs are the main cause of red ink.

I like that the video pointed out how tax-the-rich schemes wouldn’t work, though it would have been nice if they added some information on how genuine entitlement reform could solve the problem  (as you can see here and here, I’ve also nit-picked other debt-themed videos).

Which is why I humbly think this is the best video ever produced on the topic.

As you can see, I’m not an anti-debt fanatic. It was perfectly okay, for instance, to incur debt to win World War II.

But I’m very skeptical of running up the nation’s credit card for routine pork and fake stimulus.

But my main message, which I’ve shared over and over again, is that deficits and debt are merely a symptom. The underlying disease is excessive government spending.

And that spending hurts our economy whether it is financed by taxing or borrowing (or, heaven forbid, by printing money).

Now let’s look at some recent articles on the topic.

We’ll start with Eric Boehm’s column for Reason, which explains how red ink has exploded in recent years.

America’s national debt exceeded $10 trillion for the first time ever in October 2008. By mid-September 2017 the national debt had doubled to $20 trillion. …data released by the U.S. Treasury confirmed that the national debt reached a new milestone: $30 trillion. …Entitlements like Social Security and Medicare are in dire fiscal straits and will become even more costly as the average American gets older. Even without another unexpected crisis, deficits will exceed $1 trillion annually, which means the debt will continue growing, both in real terms and as a percentage of the economy. The Congressional Budget Office estimates that the federal government will add another $12.2 trillion to the debt by 2031.

As already stated, I think the real problem is the spending and the debt is the symptom.

But it is possible, of course, that debt rises so high that investors (the people who buy government bonds) begin to lose faith that they will get repaid.

At that point, governments have to pay higher interest rates to compensate for perceived risk of default, which exacerbates the fiscal burden.

And if there’s not a credible plan to fix the problem, a country can go into a downward spiral. In other words, a debt crisis.

This is what happened to Greece. And I think it’s just a matter of time before it happens to Italy.

Heck, many European nations are vulnerable to a debt crisis. As are many developing countries. And don’t forget Japan.

Could the United States also be hit by a debt crisis? Will we reach a “tipping point” that leads to the aforementioned loss of faith?

That’s one of the possibilities mentioned in the New York Times column by Peter Coy.

It’s hard to know how much to worry about the federal debt of the United States. …Either the United States can continue to run big deficits and skate along with no harm done or it’s at risk of losing investors’ confidence and having to pay higher interest rates on its debt, which would suppress economic growth. …the huge increase in federal debt incurred during and after the past two recessions — those of 2007-09 and 2020 — has used up a lot of the “fiscal space” the United States once had. In other words, the federal government is closer to the tipping point where big increases in debt finally start to become a real problem. …any given amount of debt becomes easier to sustain as long as the growth rate of the economy (and thus the growth rate of tax revenue) is higher than the interest rate on the debt. In that scenario, interest payments gradually shrink relative to tax revenue. …but it doesn’t explain how much more the debt can grow. …Past a certain point, there’s a double whammy of more dollars of debt plus higher interest costs on each dollar. …sovereign debt crises tend to be self-fulfilling prophecies: Investors get nervous about a government’s ability to pay, so they demand higher interest rates, which raise borrowing costs and produce the bad outcome they feared. It’s a dynamic that Argentines are familiar with — and that Americans had better hope they never experience.

For what it’s worth, I think other major nations will suffer fiscal crisis before the problem becomes acute in the United States.

I realize this will make me sound uncharacteristically optimistic, but I’m keeping my fingers crossed that this will finally lead politicians to adopt a spending cap so we don’t become Argentina.

P.S. The Wall Street Journal recently editorialized on the issue of government debt and made a very important point about the difference between the $30 trillion “gross debt” and the “debt held by the public,” which is about $6 trillion lower.

…the debt really isn’t $30 trillion. About $6 trillion of that is debt the government owes to itself in Social Security and other IOUs. …The debt held by the public is some $24 trillion, which is bad enough.

As I’ve noted when writing about Social Security, the IOUs in government trust funds are not real.

They’re just bookkeeping entries, as even Bill Clinton’s budget freely admitted.

Indeed, if you want to know whether some is both honest and knowledgeable about budget matters, ask them which measure of the national debt really matters.

As you can see from this exchange of tweets, competent and careful budget people (regardless of whether they favor big government or small government) focus on “debt held by the public,” which is the term for the money government actually borrows from credit markets.

If you want to know the difference between the various types of government debt – including “unfunded liabilities” – watch this video.

P.P.S. This column explains how and when debt matters. If you’re interested in how to reduce the debt, there’s very good evidence that spending restraint is the only effective approach. Even in cases where debt is enormous.

P.P.P.S. By contrast, the evidence is very clear that higher taxes actually make debt problems worse.

Read Full Post »

Back in 2017, the Center for Freedom and Prosperity released this video to help explain why spending caps are the most sensible and sustainable fiscal rule.

Switzerland actually has a spending cap in its constitution, and similar fiscal rules also exist in Hong Kong and the state of Colorado.

These policies have produced very good results.

There are many reasons to support a spending cap, including the obvious observation that an expenditure limit (as it is sometimes called) directly addresses the actual problem of excessive government.

And addressing the underlying disease works better than rules that focus on symptoms, such as balanced budget requirements or anti-deficit mandates.

You’ll notice toward the end of the video that the narrator cites pro-spending cap research from international bureaucracies, which is remarkable since those institutions normally have a bias for bigger government.

I’ve also written about that research, citing studies by the International Monetary Fund (here and here), the Organization for Economic Cooperation and Development (here and here) and the European Central Bank (here).

Today, let’s look at more evidence from these bureaucracies.

We’ll start with a new study from the European Central Bank. Here’s some of what the authors (Nicholai Benalal, Maximilian Freier, Wim Melyn, Stefan Van Parys, and Lukas Reiss) found when comparing spending limits and anti-deficit rules.

this paper provides an in-depth assessment of two alternative measures of fiscal consolidation and expansion: the change in the structural balance (dSB) and the expenditure benchmark (EB). Both the dSB and the EB are currently used to assess compliance with the fiscal rules under the Stability and Growth Pact (SGP).The EB was introduced as an indicator in 2011, and has gained in importance relative to the dSB since the European Commission began to put more emphasis on it in 2016.A comparison of the fiscal performance of euro area countries reveals significant differences depending on whether the assessment is based on the dSB or the EB. this paper finds that the EB has advantages over the dSB as a fiscal performance indicator. …expenditure rules…provide more predictability in fiscal requirements. …Even more importantly, the EB can be shown to be less procyclical as a fiscal rule than the dSB. 

Let’s also review some 2019 research from the International Monetary Fund.

This study (authored by Kodjovi Eklou and Marcelin Joanis) looks at whether fiscal rules can constrain vote-buying politicians.

In order to increase their chances of reelection, politicians are known to undertake fiscal manipulations, especially in election years. These fiscal manipulations typically take the form of increased public expenditure… Many countries, both developed and developing, have adopted fiscal rules in recent decades as an attempt to enforce fiscal discipline. …In this paper, we employ a cross-country panel dataset in order to test whether fiscal rules adopted in developing countries have been effective in constraining political budget cycles. The dataset covers 67 developing countries over the period 1985-2007. …Our dependent variable is the general government’s final consumption expenditure as a share of GDP.

Here’s what the authors concluded about the effectiveness of spending caps.

Our empirical evidence in a sample of 67 developing countries over the period 1985-2007, shows that fiscal rules cause fiscal discipline over the electoral cycle. More specifically, in election years with fiscal rules in place, public consumption is reduced by 1.65% point of GDP as compared to election years without these rules. Furthermore, the effectiveness of these rules depends on their type… In particular, expenditure rules, rules covering the general government and rules characterized by a monitoring body outside the government dampen political budget cycles in government consumption.

Indeed, footnote 12 of the paper specifically notes the superiority of expenditure limits.

…the results show that public consumption is reduced by 2.44% points during election years with expenditure rules in place. The findings on expenditure rules are consistent with Cordes et al. (2015) who show that the compliance rate for these rules are high.

Last but not least, the fiscal experts at the Office of Management and Budget included in Trump’s final budget some very encouraging language at the end of Chapter 10 of the Analytical Perspectives.

…additional efforts to control spending are needed. Several budget process reforms should be considered, including setting spending caps… Outlay caps that are consistent with the historical average as a share of gross domestic product (GDP), post-World War II levels could be enforced with sequestration across programs similar to other budget enforcement regimes. An outlay cap on mandatory spending would complement discretionary caps, which have been in place since 2013. The Budget proposes to continue discretionary caps through 2025 at declining levels and declining levels through 2030.

Trump was a big spender, of course, but at least there were people in his administration who realized there was a problem.

And they recognized the right solution.

P.S. It’s also interesting that the authors of the IMF study found that fiscal rules work better in democracies.

…estimates focusing on the subsample of democratic elections. The effect of fiscal rules on the political budget cycle is larger… More specifically, public consumption is reduced by 2.46% point of GDP (while it is 1.65% point in the baseline).

This may not bode well for the durability of Hong Kong’s spending cap.

The authors also found that foreign aid makes it less likely that a government will follow sensible policy.

Foreign aid, which relaxes the budget constraint of the government, is negatively correlated with the probability of having fiscal rules.

Needless to say, nobody should be surprised to learn that foreign aid undermines good policy.

Read Full Post »

I wrote last year about an encouraging trend of lower tax rates at the state level.

As you can see from this map, one of the states moving in the right direction is Iowa.

But Governor Kim Reynolds isn’t satisfied with just lowering tax rates, which is a worthy goal, of course.

She is now proposing to get rid of the state’s so-called progressive tax and replace it with a flat tax.

This would be very good news for Iowa’s economy and Iowa’s taxpayers.

An article in the Quad-City Times explains Governor Reynolds’ proposal.

In four years, every Iowan’s income would be taxed at 4% by the state under a new proposal from Gov. Kim Reynolds. Reynolds introduced her flat income tax proposal during last week’s annual Condition of the State address to the Iowa Legislature, encouraging the lawmakers to pass her idea.“Flat and fair,” Reynolds proclaimed during the speech. …Ten states currently have a flat state income tax, including Iowa’s eastern neighbor, Illinois. The list includes more blue states like Michigan and Massachusetts, but also red states like Kentucky and Utah. …Under Reynolds’ new plan, top state income tax rate would be eliminated each year over the next four years, until in 2026 every Iowa worker, regardless of income level, pays 4 percent. …The plan would reduce state revenue by $226 million in the first year, and by $1.6 billion at full implementation… Reynolds said during her speech. “Yes, we’ll have less to spend once a year at the Capitol, but we’ll see it spent every single day on Main Streets, in grocery stores, and at restaurants across Iowa. We’ll see it spent in businesses instead of on bureaucracies.” …Republican legislative leaders praised Reynolds’ proposal and said they are eager to begin working on legislation.

The article also explains the previous tax reform, which focused on lowering marginal tax rates.

In 2021, Iowa had nine state income tax rates, tied for the second-most in the country. Most Iowa workers’ income was taxed at between 4.14%, with rates increasing as income increased, up to a top rate of 8.53% for those earning over $78,435 of taxable income. As a result of tax reform passed by the Iowa Legislature and signed into law by Reynolds in 2018, the number of tax brackets will be reduced to four, ranging between 4.4 and 6.5%.

I showed last year how that legislation moved Iowa up one level in a ranking of state income taxes.

Well, here’s an updated look at the state’s total improvement if the governor’s plan for a flat tax is enacted.

Iowa jumps from the worst column to the next-to-best column.

And if I ranked states by the rate of their flat tax, Iowa’s 4 percent rate would be lower than the rates in North Carolina, Kentucky, Illinois, Michigan, Utah, and Massachusetts.

Not as good as the states with no income taxes, but still impressive.

P.S. I’ll be curious to see how much Iowa will improve in the Tax Foundation’s rankings if the proposed flat tax gets approved.


Read Full Post »

When I wrote about the 2018 edition of Freedom in the 50 States, Florida ranked as the nation’s most libertarian state.

In the 2021 version, New Hampshire takes the top spot (reclaiming the lead it had back in 2016).

Here’s a map showing the 10 best and 10 worst states. One obvious takeaway is that New Hampshire deserves extra praise because it is in a region where there seems to be a general disdain for economic and personal liberty.

And here’s a table showing how all the states rank.

As you can see, Florida is still a very good state.

Indeed, Florida is getting better over time. All that happened in the new edition of Freedom in the 50 States is that New Hampshire got better even faster.

This seems to be a pattern.

You can see from Figure 9 that the best states have been getting better over the past 10 years while the worst states are stagnating.

If you want some background on the publication, here’s how the authors (Will Ruger and Jason Sorens) describe their index.

…the 2021 edition examines state and local government intervention across a wide range of policy categories—from taxation to debt, from eminent domain laws to occupational licensing, and from drug policy to educational choice.We…strive to make it the most comprehensive and definitive source for economic freedom data on the American states.Although the United States has made great strides toward respecting each individual’s rights regardless of race, sex, age, or sexual preference, some individuals face growing threats to their interests in some jurisdictions. Those facing more limits today include smokers, builders and buyers of affordable housing, aspiring professionals wanting to ply a trade without paying onerous examination and education costs, and less-skilled workers priced out of the market by minimum-wage laws. Moreover, although the rights of some have increased significantly in certain areas, for the average American, freedom has declined generally because of federal policy that includes encroachment on policies that states controlled 20 years ago.

For more information, here’s how the states rank for economic freedom.

And here are the rankings for personal freedom.

Let’s look at the some other tables.

Since I’m most interested in fiscal policy, I’m reflexively drawn to Table 7. Kudos to Florida, Tennessee, New Hampshire, and South Dakota (the absence of a state income tax really helps). And I’m surprised to see Massachusetts in the top 10 (it helps to a have a flat tax).

For what it’s worth, Hawaii really stinks. And I’m not surprised to see New York next to last.

Here’s a look at how states have changed since 2000.

No big surprises, though it’s interesting to note that North Dakota (which was ranked #1 back in 2013) has suffered a relative decline (now ranked #15) simply because its improvement has been rather modest compared to the big improvements in other states.

P.S. For those interested in methodological issues, here’s a look at the formula used to determine which states have the most freedom and least freedom.

P.P.S. If you look at the weighting for personal freedom, you’ll find that educational freedom is 2 percent of a state’s score. Given the importance of school choice (for both individual education outcomes and national economic competitiveness), I wonder if that variable is insufficiently appreciated.

Read Full Post »

As a libertarian, I view defense spending with the same jaundiced eye that I apply to domestic spending.

  • I’ve pointed out that the U.S. represents a big share of global military outlays.
  • I’ve pointed out that sequestration wasn’t a threat to military preparedness.
  • I’ve pointed out that legacy defense commitments may be senseless nowadays.

And here’s a more-updated view of how much the United States spends on the military compared to other nations.

Call me crazy, but this chart indicates that the United States is probably spending too much on the Pentagon.

For what it’s worth, it’s possible that America’s lead is exaggerated because China and Russia get more bang for their buck on their military spending, but it’s also worth noting that the rest of the nations on the list are largely allied with the United States.

Farhad Manjoo of the New York Times writes there is too much spending on defense. But he undermines the credibility of his position with a deceptive comparison of domestic and defense outlays.

…the nearly three-quarters of a trillion dollars that we are spending this year on a military that has become the epitome of governmental dysfunction, self-dealing and overspending. …does it make any sense to keep spending so many hundreds of billions on the Pentagon? …The Pentagon has never passed an audit… Congress is projected to spend about $8.5 trillion for the military over the next decade — about half a trillion more than is budgeted for all nonmilitary discretionary programs combined… You don’t have to be a pacifist to wonder if this imbalance between military and nonmilitary spending makes sense.

The problem with what he wrote is that he compares defense spending only to the portion of domestic spending that is considered “discretionary.”

And this leaves out all the entitlement programs – which are the biggest and fastest growing part of the federal budget.

So I went to section 8 of the Historical Tables of the Budget and put together this chart, based on inflation-adjusted dollars, showing total domestic spending (huge and growing), total defense spending (relatively flat), and interest payments on the national debt (relatively flat).

Next, let’s look at the data showing what share of the budget goes to different types of spending.

For this chart, I’ve separated domestic entitlements and domestic discretionary.

Once again, the obvious and unambiguous takeaway is that domestic spending is the problem in general, with entitlements being the problem in particular.

Now that we know that entitlement programs are America’s main fiscal challenge, let’s close with a couple of reminders that we also should take a knife to the Pentagon’s budget.

This headline for a story in USA Today.

This heading from a story in Stars & Stripes.

This headline from a story in the New York Times.

And if you want other examples of military waste, click here, here, and here.

But don’t forget that the big savings from defense budget can be achieved by reevaluating whether it makes sense to maintain alliances against enemies that no longer exist, along with reconsidering the wisdom of nation building.

Read Full Post »

As part of a recent discussion with Gene Tunny in Australia, I explained why I support “Starve the Beast,” which means keeping taxes as low as possible to help achieve the goal of spending restraint.

The premise of Starve the Beast is very simple.

Politicians like to spend money and they don’t particularly care whether that spending is financed by taxes or financed by borrowing (both bad options).

As Milton Friedman sagely observed, that means they will spend every penny they collect in taxes plus as much additional spending financed by borrowing that the political system will allow.

The IMF published a study on this issue about 10 years ago. The authors (Michael Kumhof, Douglas Laxton, and Daniel Leigh) assert that there’s no way of knowing whether Starve the Beast will lead to good or bad results.

…there is no consensus regarding the macroeconomic and welfare consequences of implementing a starve-the-beast approach, henceforth referred to as STB. …it could be beneficial in the ideal case in which it results in cuts in entirely wasteful government spending. In particular, lower spending frees up resources for private consumption, and the associated lower tax rates reduce distortions in the economy. On the other hand, …lower government spending may itself entail welfare losses…if it augments the productivity of private factors of production. …the paper examines whether the principal macroeconomic variables such as GDP and consumption, both in the United States and in the rest of the world, respond positively to this policy. …In addition, the paper assesses how the welfare effects depend on the degree to which government spending directly contributes to household welfare or to productivity.

The authors don’t really push any particular conclusion. Instead, they show various economic outcomes depending on with assumptions one adopts.

Since plenty of research shows that government spending is not a net plus for the economy (even IMF economists agree on that point), and because I think a less-punitive tax system is possible (and desirable) if there’s a smaller burden of government spending, I think the findings shown in Figure 4 make the most sense.

Now let’s shift from academic analysis to policy analysis.

In a piece for National Review back in July 2020, Jim Geraghty notes that Starve the Beast has an impact on government finances at the state level.

…we’re probably not going to see a massive expansion of government at the state level in the coming year or two. …Thanks to the pandemic lockdown bringing vast swaths of the economy to a halt, state tax revenues are plummeting. …So states will have much less tax revenue, constitutional balanced-budget requirements that are not easily repealed, and a limited amount of budgetary tricks to work around it. State governments could attempt to raise taxes, but that’s going to be unpopular and hurt state economies when they’re already struggling. Add it all up and it’s a tough set of circumstances for a dramatic expansion of government, no matter how ardently progressive the governor and state legislatures are.

For what it’s worth, Geraghty warned in the article that fiscal restraint by state governments wouldn’t happen if the federal government turned on the spending spigot.

And that, of course, is exactly what happened.

Now let’s look at the most unintentional endorsement of Stave the Beast.

A couple of years ago, Paul Krugman sort of admitted that cutting taxes was a potentially effective strategy for spending restraint.

…the same Republicans now wringing their hands over budget deficits…blew up that same deficit by enacting a huge tax cut for corporations and the wealthy. …this has been the G.O.P.’s budget strategy for decades. First, cut taxes. Then, bemoan the deficit created by those tax cuts and demand cuts in social spending. Lather, rinse, repeat. This strategy, known as “starve the beast,” has been around since the 1970s, when Republican economists like Alan Greenspan and Milton Friedman began declaring that the role of tax cuts in worsening budget deficits was a feature, not a bug. As Greenspan openly put it in 1978, the goal was to rein in spending with tax cuts that reduce revenue, then “trust that there is a political limit to deficit spending.” …voters should realize that the threat to programs… Social Security and Medicare as we know them will be very much in danger.

In other words, Krugman doesn’t like Starve the Beast because he fears it is effective (just like he also acknowledges the Laffer Curve, even though he’s opposed to tax cuts).

Let’s close by looking at some very powerful real-world evidence. Over the past 50 years, there’s been a massive increase in the tax burden in Western Europe.

Did all that additional tax revenue lead to lower deficits and less debt?

Nope, the opposite happened. European politicians spent every penny of the new tax revenue (much of it from value-added taxes). And then they added even more spending financed by additional borrowing.

To be fair, one could argue that this was an argument for the view of “Don’t Feed the Beast” rather than “Starve the Beast,” but it nonetheless shows that more money in the hands of politicians simply means more spending. And more red ink.

P.S. I had a discussion last year with Gene Tunny about the issue of “state capacity libertarianism.”

Read Full Post »

The fight over President Biden’s budget, the so-called Build Back Better plan, has revolved around very important issues.

For today’s column, let’s zoom out and look at two charts that highlight the big issue that should be getting more attention.

First, here’s a comparison of projected inflation with baseline spending (the current spending outlook) and Biden’s budget – all based on economic and fiscal estimates from the Congressional Budget Office.

As you can see, spending was growing far too fast even without Biden’s budget. And if Biden’s budget is enacted, the spending burden will rise more than twice the rate of inflation.

Now let’s look at a chart that illustrates why Biden’s spending spree is just a small part of the problem.

To be sure, it’s not good that the President is exacerbating America’s fiscal problems, but you can see that he’s simply adding a few more straws to the camel’s back.

You’ll also notice that I included both the amount of spending that technically is in Biden’s budget plan (the orange part), as well as CBO’s estimate of the additional spending (the gray part) that will happen if the budget gimmicks are removed.

The bottom line is that America’s fiscal problem is too much government spending.

And that spending burden is getting worse over time because spending is growing faster than the private sector, violating the Golden Rule, which is bad news for jobs and growth.

Making the problem worse, as Biden proposes, will further hurt American prosperity.

P.S. Biden’s plan will increase the deficit, which also is not good, but keep in mind that tax-financed spending is no better than debt-financed spending. In either case, you wind up with the same bad result.

P.P.S. This column has two serious visuals to help understand Biden’s fiscal policy. If you prefer satire, here are two other images.

Read Full Post »

Regarding fiscal policy, almost everyone’s attention is focused on Biden’s growth-sapping plan to increase the burden of taxes and spending.

People are right to be concerned. If the President’s plan is approved, the already-grim fiscal outlook for United States will get even worse.

This battle will be decided in next 12 months, hopefully with a defeat for Biden’s dependency agenda.

Regardless of how that fight is resolved, though, we’re eventually going to get to a point where sensible people are back in charge. And when that happens, we’ll have to figure out how to restore the nation’s finances.

That requires figuring out the appropriate goal. Here are two options:

  • Keeping taxes low.
  • Controlling debt.

These are both worthy objectives.

But, as a logic teacher might say, they are necessary but not sufficient conditions.

Here’s a chart showing how a policy of low taxes (the orange line) presumably enables faster growth, but also creates the risk of an eventual economic crisis if nothing is done to control spending and debt climbs too high (think Greece).

By contrast, the chart also shows that it’s theoretically possible to avoid an economic crisis with higher taxes (the blue line), but it means less growth on a year-to-year basis.

The moral of the story is that the economy winds up in the same place with either tax-financed spending or debt-financed spending.

Which is why we should consider a third goal.

  • Limiting spending.

The economic benefits of this approach are illustrated in this second chart. We enjoy faster year-to-year growth. And, because spending restraint is the best way of controlling debt, the risk of a Greek-style economic crisis is averted.

Now for some caveats.

I made a handful of assumptions in the above charts.

  • The economy grows 2.0 percent annually for the next 31 years with tax-financed spending
  • The economy grows 2.5 percent annually with debt-financed spending, but suffers a 10 percent decline in Year 31.
  • The economy grows 3.0 percent annually for the next 31 years with smaller government (thus enabling low taxes and less debt).

Anyone can create their own spreadsheet and make different assumptions.

That being said, there’s a lot of evidence that higher tax burdens hinder growth, that ever-rising debt burdens can lead to crisis, and that less government spending produces stronger growth.

So feel free to make your own assumptions about the strength of these effects, but let’s never lose sight of the fact that spending restraint should be the main goal for post-Biden fiscal policy.

Read Full Post »

Nearly 10 years ago, I shared some data to show how a Swiss-style spending cap would have prevented some of the excess spending of the Bush and Obama years.

Trillion-dollar deficits would have been avoided. But, more important, the burden of government spending would have been significantly lower.

That would have enabled stronger growth, as confirmed even by researchers from left-leaning bureaucracies such as the OECD and CBO.

I then did the same thing in 2020, showing once again how a spending cap would have produced great results.

And, earlier this year, I crunched the numbers to show how Italy and Greece could have avoided their fiscal nightmares if they had imposed spending caps a couple of decades ago.

Today, let’s look at similar data for Canada.

Except I don’t need to do any work because Livio di Matteo has a new study on tax and expenditure limitations from the Fraser Institute. Here’s some he wrote about the conceptual issues.

Tax and expenditure limits restrict the growth of either revenues or expenditures or both by either setting them at a fixed dollar amount or by limiting the growth rate by linking them to the growth of specific economic variables. …A key perceived benefit of TELs is that they serve as a restraint on politicians and bureaucrats who often have little incentive to restrain spending in response to pressures from interest groups. A second benefit of TELs is that smaller government can be associated with higher rates of economic growth. …One noteworthy type of TEL is a strict restriction on tax or expenditure levels, or, more commonly their rates of growth. This is generally a formula driven approach and the most common mechanism involves restricting expenditure growth to the pace of personal income, GDP, or combined population and inflation growth.

Now let’s look at his numbers for Canada, starting with a look at the the status quo outlook for 2015-2025, which shows that the spending burden will climb by 58 percent over the 10-year period.

Perhaps the best way to illustrate the implementation of a simple TEL and assess its impact and effectiveness is via an example that makes use of recent federal public finance data. …The base scenario…shows revenues rising from…$292.6 billion to $437.7 billion—an increase of 50 percent. …Meanwhile, expenditures rise from $295.4 billion to $466 billion for an increase of 58 percent.

But what if spending was limited so it could only grow at the same rate as population plus inflation?

The spending burden would increase by just 33 percent.

The simulations in this paper…involves a fixed growth rule for expenditures so that they cannot exceed growth in population plus inflation… Under this approach, federal expenditures grow from $295.5 billion in 2015–16 to reach $393.2 billion by 2025–26, which is a much smaller increase in spending relative to the projections contained in Budget 2021. …Expenditures grow from $295.5 billion in 2015–16 to reach $393.2 billion by 2025–26, an
increase of 33 percent.

The report also looks at what would happen if there was an opt-out clause to allow emergency spending, specifically the outlays for Canada’s response to the COVID pandemic.

The net result is that spending climbs by 43 percent over the 10-year period.

…In figure 3, a…final scenario is presented that…assumes that the TEL was designed to accommodate the need for an emergency fiscal response… Expenditures are assumed to grow at 2.9 percent annually from 2015–16 to 2019–20 and then from 2023–24 onwards. …The results show that revenues rise from $292.6 billion in 2015–16 to $427.7 billion by 2025–26 for a total increase of 46 percent. Meanwhile, expenditures rise from $295.5 billion in 2015–16 to reach $423.7 billion by 2025–26 for an overall increase of 43 percent.

Here is the aforementioned Figure 3, for those interested.

The main takeaway is that a spending cap can be very successful, even if there’s a provision that allows emergency spending.

Total spending grows by less than total revenue, thus satisfying my Golden Rule. And, as a result, there’s far less government debt.

In other words, even with a TEL as structured under this scenario, it would have been possible for the federal government to deliver the exact same amount of COVID-19 fiscal support as laid out in the 2021 federal spring budget, balance the budget by 2025–26, and only accumulate half the deficits

P.S. Let’s look at a final excerpt from the study. We have reviewed a bunch of data showing how spending caps would be successful.

By contrast, balanced budget requirements do not have a good track record.

Balanced budget legislation is often perceived as a form of TEL but in practice it is considered different in that it simply attempts to achieve budget balance so that debt stops being accumulated. Such legislation is not necessarily designed to constrain the rate of growth of government spending—nor to limit the size of the public sector… Indeed, according to Clemens et al. (2003) the adoption of balanced budget laws in Canada, which by the early 2000s existed in eight out of ten provinces, coincided with increases in government spending and taxation as measured by real per-capita consolidated provincial and municipal spending.

This is not surprising. The cyclical nature of revenues means it is very difficult to maintain a balanced budget rule.

By contrast, the International Monetary Fund (twice!), the European Central Bank, and the Organization for Economic Cooperation and Development (twice!) have acknowledged that spending caps are the most, if not only, effective fiscal rule.

P.P.S. If you want some real-world evidence, Switzerland’s spending cap continues to produce strong outcomes.

Read Full Post »

In my column yesterday about state tax systems, I specifically noted that North Carolina has been making big improvements.

Not only did the state shift to a flat tax a few years ago, it recently voted to lower the rate from 5.25 percent to 3.99 percent.

Why did this happen?

The easy answer is that Republicans gained control of the state legislature. But that’s – at best – only a partial answer. After all, there are plenty of places where Republicans gain power and don’t enact good fiscal policy.

So maybe a better answer is that Reagan-style Republicans took control.

I suspect that’s a far more accurate answer, but I want to dig deeper and look at a policy reform that made the tax cuts possible.

Simply stated, North Carolina politicians embraced the Golden Rule of spending restraint.

And by controlling the growth of spending, they created fiscal maneuvering room for lower tax rates.

In a column for a North Carolina newspaper, John Hood, a board member of the John Locke Foundation (the state’s pro-market think tank) explains what happened.

…in North Carolina, conservative governance has actually reduced the size of state government and significantly improved its fiscal condition. …As a share of the economy, state spending has averaged about 5.8% over the past 45 years. It was well over 6% as recently as 2009. Since fiscally conservative Republicans won control of the General Assembly in 2010, however, budgets have gone up every year in dollar terms but have gone down almost every year when expressed as a share of GDP. That’s because legislative leaders have stuck to their commitment to keep annual spending growth at or below the combined rates of inflation and population growth. …That has, in turn, allowed legislators to rebuild the state’s savings reserves, pay off state debt, and finance several rounds of growth-enhancing tax cuts.

I fully agree that the goal should be to reduce state spending as a share of GDP, so kudos to North Carolina lawmakers.

By limiting annual spending increases, they have strengthened the private sector.

Here’s a chart, based on data from the National Association of State Budget Officers, showing what has happened to state spending since 2010. For background, a simple rule of thumb is that the “general fund” is money a state raises and spends while “total spending” includes that spending plus money that comes from Washington.

By the way, population has increased by about 1 percent annually in North Carolina, so per-capita state spending is only growing by about 1.5 percent per year.

All things considered, a very good job. Too bad Republicans in Washington don’t push for similar policies (to be fair, they did restrain spending during the Tea Party era).

I’ll close with a worrisome observation that North Carolina does not not have a TABOR-style constitutional spending limit.

So while it’s admirable that state lawmakers have restrained spending over the past decade, there are no guarantees that the Tarheel State will enjoy spending restraint in the future.

So North Carolina should copy Colorado and adopt something like TABOR. Or, they can demonstrate their worldliness by copying Switzerland’s “debt brake,” which is another constitutional provision to limit spending.

The goal – for the state and the nation – should be some sort of spending cap.

Read Full Post »

Motivated in part by an excellent graphic that I shared in 2016, I put together a five-column ranking of state personal income tax systems in 2018.

Given some changes that have since occurred, it’s time for a new version. The first two columns are self explanatory and columns 3 and 5 are based on whether the top tax rate on households is less than 5 percent (“Low Rate”) or more than 8 percent (“Class Warfare”).

Column 4, needless to say, is for states where the top tax rate in between 5-8 percent.

The good news is that the above table is better than the one I created in 2018. Thanks to tax competition between states, there have been some improvements in tax policy.

I recently wrote about Louisiana’s shift in the right direction.

Now we have some good news from the Tarheel state. The Wall Street Journal opined today about a new tax reform in North Carolina.

The deal phases out the state’s 2.5% corporate income tax between 2025 and 2031. …The deal also cuts the state’s flat 5.25% personal income tax rate in stages to 3.99% by July 1, 2027. …North Carolina ranks tenth on the Tax Foundation’s 2021 state business tax climate index, and these reforms will make it even more competitive. …North Carolina has an unreserved cash balance of $8.55 billion, and legislators are wisely returning some of it to taxpayers.

What’s especially noteworthy is that North Carolina has been moving in the right direction for almost 10 years.

P.S. Arizona almost moved from column 3 to column 5, but that big decline was averted.

P.P.S. There are efforts in Mississippi and Nebraska to get rid of state income taxes.

P.P.P.S. Kansas tried for a big improvement a few years ago, but ultimately settled for a modest improvement.

Read Full Post »

First we got Biden’s $1.9 trillion so-called stimulus.

Then we got his $1 trillion-plus infrastructure boondoggle.

Now Congress may be on the verge of approving the President’s budget, which (if we use honest numbers) is a $5 trillion plan to expand the welfare state.

And…

So it’s hardly a surprise that recent changes will lead to a much-larger burden of government spending.

This is bad news for our economy, as measured by my recent study (with similar findings from a wide range of academics – as well as normally left-leaning bureaucracies such as the IMF, World Bank, and OECD).

For purposes of today’s column, let’s put America’s fiscal decline in global context.

Here are some excerpts from a very depressing article in the Economist, starting with some discussion of how Biden’s spending binge is similar to the mistakes made by other nations.

President Joe Biden is building on what started as emergency pandemic-related policy, expanding the child-tax credit, creating a universal federally funded child-care system, subsidising paid family leave and expanding Obamacare. America’s government spending remains somewhat below the developed-world average. But this change is not just a matter of catching up; the target is moving. Government spending as a share of gdp in the oecd as a whole has consistently inched higher in the six decades since the club was formed in 1961.

There’s then some discussion about how a few nations – most notably Sweden and New Zealand – enjoyed period of genuine spending restraint, but accompanied by depressing observations about how fiscal responsibility is very rare.

Examples of genuine state retrenchment in developed countries are few and far between. Sweden managed it in the 1980s. In the early 1990s Ruth Richardson, then New Zealand’s finance minister, cut the size of the state drastically. …State spending is now six percentage points lower as a share of gdp than it was in 1990. But this is a rare achievement, and perhaps one doomed to pass. …This is a sorry state of affairs if you believe that low taxes and small government are the right, and possibly the only, conditions for reliable, enduring economic growth. …an argument made by Friedrich Hayek, an Austrian philosopher, Milton Friedman, an American economist, and others in the mid-20th century.

There’s also some historical analysis showing how the burden of government used to be relatively minor.

From 1274 to 1691 the English government raised less than 2% of gdp in tax. …In the 1870s the governments of rich countries were spending about 10% of gdp. In 1920 it was nearer 20%. It has been growing ever since (see chart 2).

Here’s the aforementioned chart 2, and there are a lot of depressing numbers, though notice how Switzerland does better than other nations.

I’ve previously shared a version of this data, calling it the “world’s most depressing chart” – all of which was made possible by the imposition of income taxes.

But there is some good news. The ever-rising fiscal burden of government has been somewhat offset by reductions in other bad policies.

Governments have not grown more powerful by all measures. Bureaucrats no longer, as a rule, set wages or prices, nor impose strict currency controls, as many did in the 1960s or 1970s. In recent decades the public sector has raised hundreds of billions of dollars from privatisations of state assets such as mines and telecoms networks. If you find it faintly amusing to hear that, from 1948 to 1984, the British state ran its own chain of hotels, that is because the “neoliberal” outlook on the proper place of government has triumphed.

Last but not least, there’s some discussion of “public choice,” which explains why politicians and bureaucrats have incentives to expand the size and scope of government.

Governments and bureaucrats are at least partly self-interested: “public-choice theory” says that unrestrained bureaucracies will defend their turf and seek to expand it. …Politicians have their own incentives to expand the state. It is generally more rewarding for a politician to introduce a new programme than it is to close an old one down; costs are spread across all taxpayers while benefits tend to be concentrated, thus eliciting gratitude from interest groups

I’ll close by reiterating my warning that ever-rising spending burdens not only lead to less growth, but they also will lead to Greek-style fiscal crises.

Europe will get hit first, but it’s just a matter of time before the United States suffers a similar fate.

P.S. There is a simple solution to avoid such crises, and a specific policy to achieve that solution. But don’t hold your breath waiting for politicians to tie their own hands.

Read Full Post »

It’s impossible to predict when another pandemic will strike.

But there’s one future crisis that we already know about, and I recently spoke about that issue to the Liberty International World Conference in Medellin.

At first, I wasn’t planning to share this video, particularly since I covered much of the same material in a speech back in January.

But then I saw a story in Yahoo Finance that includes this very sobering chart about how the burden of government spending will climb in G-7 nations over the next four decades.

The main takeaway is that aging populations and poorly designed tax-and-transfer programs (entitlements) are a recipe for long-run fiscal crisis in almost all developed nations.

That includes the United States. The four-decade outlook for America isn’t as bad as it is in nations such as France and Japan, but government will grow more than the fiscal burdens in Canada, Germany, and the United Kingdom.

And here are some details from the story.

The Covid-19 pandemic may have bloated public debt…, but that’s nothing compared to the fiscal difficulties brewing in the coming decades, the OECD said. …states will face rising costs, particular from pensions and health care. To maintain public services and benefits while stabilizing debt in that environment, governments would have to raise revenues by nearly 8% of gross domestic product, the OECD said. In some countries, including France and Japan, the size of the challenge would amount to more than 10% of output, and the economists didn’t even account for new expenditures such as climate change adaptation.

If you want to dig into the details, you can click here to read the underlying report from the Organization for Economic Cooperation.

I think the following excerpts are particularly relevant. As you can see, the problem is demographics, which leads to more spending for entitlement programs such as health and pensions.

And, assuming politicians decide to address the issue with revenues, this implies massive tax increases.

Public health and long-term care expenditure is projected to increase by 2.2 percentage points of GDP in the median country between 2021 and 2060… These projections are based on a pre-pandemic spending baseline, so any permanent increase in health spending in response to experience with COVID-19…would come in addition. Public pension expenditure is projected to increase by 2.8 percentage points of GDP in the median country between 2021 and 2060… Other primary expenditures are projected to rise by 1½ percentage points of GDP… This projection excludes potential new sources of expenditure pressure, such as climate change adaptation. …OECD governments would need to raise taxes in this scenario to prevent gross government debt ratios from rising over time… The median country would need to increase structural primary revenue by nearly 8 percentage points of GDP between 2021 and 2060, but the effort would exceed 10 percentage points in 11 countries.

Most interesting, the two authors of the OECD study point out that are some major problems with the tax “solution.”

The results of this section do not imply that taxes will, or even should, rise in the future. The fiscal pressure indicator is simply a metric serving to quantify and illustrate the fiscal challenge facing OECD governments. Raising taxes is only one of many possible avenues to meet this challenge. …Pushing mainstream taxes on incomes or consumption further up, even by only a few percentage points of GDP, may be politically difficult and fiscally counter-productive if it means reaching the downward-sloping segment of the Laffer curve.

I’m especially impressed that they acknowledge the Laffer Curve (the nonlinear relationship between tax rates and tax revenue that the Biden Administration wishes away).

P.S. The real solution is entitlement reform, and here’s the explanation for how to do it in the United States.

P.P.S. As I’ve regularly noted, the economists who work at the OECD often produce very solid analysis. The problem with that bureaucracy is that it has very statist leadership, which is why the OECD’s policy agenda includes anti-growth policies such as big tax increases and tax harmonization.

Read Full Post »

The good news is that President Biden wants the United States to be at the top. The bad news is that he wants America to be at the top in bad ways.

  • The highest corporate income tax rate.
  • The highest capital gains tax rate.
  • The highest level of double taxation.

We can now add another category, based on the latest iteration of his budget plan.

According to the Tax Foundation, the United States would have the developed world’s most punitive personal income tax.

Worse than France and worse than Greece. How embarrassing.

In their report, Alex Durante and William McBride explain how the new plan will raise tax rates in a convoluted fashion.

High-income taxpayers would face a surcharge on modified adjusted gross income (MAGI), defined as adjusted gross income less investment interest expense. The surcharge would equal 5 percent on MAGI in excess of $10 million plus 3 percent on MAGI above $25 million, for a total surcharge of 8 percent. The plan would also redefine the tax base to which the 3.8 percent net investment income tax (NIIT) applies to include the “active” part of pass-through income—all taxable income above $400,000 (single filer) or $500,000 (joint filer) would be subject to tax of 3.8 percent due to the combination of NIIT and Medicare taxes. Under current law, the top marginal tax rate on ordinary income is scheduled to increase from 37 percent to 39.6 percent starting in 2026. Overall, the top marginal tax rate on personal income at the federal level would rise to 51.4 percent. In addition to the top federal rate, individuals face taxes on personal income in most U.S. states. Considering the average top marginal state-local tax rate of 6.0 percent, the combined top tax rate on personal income would be 57.4 percent—higher than currently levied in any developed country.

Needless to say, this will make the tax code more complex.

Lawyers and accountants will win and the economy will lose.

I’m not sure why Biden and his big-spender allies have picked a complicated way to increase tax rates, but that doesn’t change that fact that people will have less incentive to engage in productive behavior.

What matters is the marginal tax rate on people who are thinking about earning more income.

And they’ll definitely choose to earn less if tax rates increase, particularly since well-to-do taxpayers have considerable control over the timing, level, and composition of their income.

P.S. Based on what happened in the 1980s, we can safely assume that Biden’s class-warfare plan won’t raise much money.

Read Full Post »

President Biden’s fiscal agenda of higher taxes and bigger government is not a recipe for prosperity.

How much will it hurt the economy?

Last month, I shared the results of a new study I wrote with Robert O’Quinn for the Club for Growth Foundation.

We based our results on a wide range of economic research, especially a scholarly study from the Congressional Budget Office, and found a big drop in economic output, employment and labor income.

Most troubling was the estimate of a long-run drop in living standards, which would be especially bad news for young people.

Today, I want to share some different estimates of the potential impact of Biden’s agenda.

A study for the Texas Public Policy Foundation, authored by  E. J. Antoni, Vance Ginn, and Stephen Moore, found even higher levels of economic damage. Here are some main excerpts.

President Biden and congressional Democrats seek to spend another $6.2 trillion over the next decade, spread across at least two bills that comprise their “Build Back Better” plan. This plan includes heavy taxing, spending, and debt, which contributes to reducing growth rates for GDP, employment, income, and capital stock.  Compared to baseline growth over the next decade, this plan will result in estimated dynamic economic effects of 5.3 million fewer jobs, $3.7 trillion less in GDP, $1.2 trillion less in income, and $4.5 trillion in new debt. …There are many regulatory changes and transfer payments in current legislation whose effects have not been included in this paper but are worth mentioning in closing since they will have many of the same effects as the tax increases discussed in this paper. Extending or expanding the enhanced Child Tax Credit, Earned Income Tax Credit, Child and Dependent Care Tax Credit, and more, disincentivizes working, reducing incomes, investment, and GDP. Just the changes to these three tax credits alone are expected to cause a loss of 15,000 jobs… Permanently expanding the health insurance premium tax credits would similarly have a negative effect… Regulatory changes subsidizing so-called green energy while increasing tax and regulatory burdens on fossil fuels also result in a less efficient allocation of resources.

If we focus on gross domestic product (GDP), the TPPF estimates a drop in output of $3.7 trillion, which is higher than my study, which showed a drop of about $3 trillion.

Part of the difference is that TPPF looked at the impact of both the so-callled infrastructure spending package and Biden’s so-called Build Back Better plan, while the study for the Club for Growth Foundation only looked at the impact of the latter.

So it makes sense that TPPF would find more aggregate damage.

And part of the difference is that economists rarely agree on anything because there are so many variables and different experts will assign different weights to those variables.

So the purpose of sharing these numbers is not to pretend that any particular study perfectly estimates the effect of Biden’s agenda, but rather to simply get a sense of the likely magnitude of the economic damage.

Speaking of economic damage, here’s a table from the TPPF showing state-by-state job losses.

I’ll close by noting that you can also use common sense to get an idea of what will happen if Biden’s agenda is approved.

He wants to make the United States more like Western Europe’s welfare states, so all we have to do is compare U.S. living standards and economic performance to what’s happening on the other side of the Atlantic Ocean.

And when you do that, the clear takeaway is that it’s crazy to “catch up” to nations that are actually way behind.

Read Full Post »

Having been in Washington for close to 40 years, I’ve seen lots of budget dishonesty, but nothing compares to Joe Biden’s claim that his profligate budget proposals have zero cost.

According to the official numbers, that’s a $3.5 trillion lie.

In reality, as I noted in July, it’s much bigger.

Let’s investigate this issue. I’ll start by noting that I have mixed feelings about the Committee for a Responsible Federal Budget (CRFB). They think controlling red ink should be the main focus of fiscal policy, whereas I think controlling spending should be the top goal.

That being said, CRFB’s staff have a well-deserved reputation for being thorough and careful when producing fiscal analysis.

So it’s worth noting that the group estimates that the Biden’s fiscal agenda would actually cost between $5 trillion and $5.5 trillion over 10 years, much higher than the “official” estimate of $3.5 trillion.

Here are some of the bottom-line numbers from their report.

That’s a truncated version of their table. If you want to see all the gory details, click here.

You’ll also be able to read the group’s analysis, including these key excerpts.

While the actual cost of this new legislation will ultimately depend heavily on details that have yet to be revealed, we estimate the policies under consideration could cost between $5 trillion and $5.5 trillion over a decade, assuming they are made permanent. In order to fit these proposals within a $3.5 trillion budget target, lawmakers apparently intend to have some policies expire before the end of the ten-year budget window, using this oft-criticized budget gimmick to hide their true cost. …To fit $5 trillion to $5.5 trillion…into a $3.5 trillion budget, background documents to reporters explain that “the duration of each program’s enactment will be determined based on scoring and Committee input.”  In other words, tax credits and spending programs will be set to expire at some point before the end of the decade, in the hope that future lawmakers will extend these programs. …This budget gimmick…would obscure the true cost of the legislation

The Wall Street Journal opined about Biden’s gimmickry.

Democrats are grasping for ways to finance their cradle-to-grave welfare state, with the left demanding what they claim is $3.5 trillion over 10 years. The truth is that even that gargantuan number hides the real cost of their plans. The bills moving through committees are full of delayed starts, phony phase-outs, and cost shifting to states designed to fit $3.5 trillion into a 10-year budget window… Start with the child allowance… Democrats have hidden the real cost by extending the allowance only through 2025. Even if Republicans gain control of Congress and the White House in 2024, Democrats and their media allies will bludgeon them to extend the payments… Democrats are using a different time shift to disguise the cost of their Medicare expansion…delaying the phase-in of the much more expensive dental benefit to 2028. This “saves” $420 billion over 10 years, but the costs explode after that. …the new universal child-care entitlement…gives $90 billion to the states—but only from 2022 to 2027. …The bottom line: $3.5 trillion is merely the first installment of a bill that would put government at the commanding heights of family life and the economy for decades to come. Tax increases will follow as far as the eye can see.

Regarding the final sentence of the above excerpt, the tax increases in Biden’s budget are merely an appetizer.

Ultimately, a European-sized welfare state requires European-style taxes on lower-income and middle-class households.

In other words, a value-added tax, along with higher payroll taxes, higher energy taxes, and higher income tax rates on ordinary workers (with this unfortunate Spaniard being a tragic example).

But we do have a tiny bit of good news.

A small handful of Democrats are resisting Biden’s budget, which means the package presumably will have to shrink in order to get sufficient votes.

But this good news may be fake news if Biden and his allies in Congress simply expand the use of dishonest accounting.

Brian Riedl of the Manhattan Institute documents some of this likely dishonesty in a column for the New York Post.

How does Congress cut a $3.5 trillion spending bill down to $1.5 trillion? By using gimmicks to hide its true cost. …Progressives have been abusing these gimmicks from the start. They began with a reconciliation proposal that would cost nearly $5 trillion over the decade. Then, in order to cut the bill’s “official” cost closer to $4 trillion, the bill’s authors included a December 2025 expiration of the $130 billion annual expansion of the child tax credit… Of course, no one believes that Congress will actually allow the child tax credit to be reduced at the end of 2025… Democrats purposely selected for “expiration” a popular middle-class benefit that they know even a future Republican Congress or president would not dare take away from voters. …expensive child care subsidies, family leave, and “free” community college benefits may also have their full cost hidden with fake expiration dates early into the 10-year scoring window. Lawmakers fully expect to extend these policies later, ultimately raising the cost of the total reconciliation bill closer to the $3.5 trillion target (or even higher). …Progressives are also discussing delaying the proposed new Medicare dental benefits until 2028, which legitimately saves money within the 10-year scoring window but also hides a larger long-term cost.

I realize that it’s not a big revelation to write that politicians are dishonest (Washington, after all, is a “wretched hive of scum and villainy“).

And I also realize that that the main problem with Biden’s plan is the economic damage it will cause, not the reliance on phony accounting.

But truth should matter a little bit, even in a town where lying about fiscal policy is a form of art.

Read Full Post »

There are lots of reasons (here are five of them) to dislike the version of the Biden tax hike that was approved by the tax-writing committee in the House of Representatives.

From an economic perspective, it is bad for prosperity to penalize work, saving, investment, and productivity.

So why, then, do politicians pursue such policies?

Part of the answer is spite, but I think the biggest reason is they simply want more money to spend.

And if the economy suffers, they don’t worry about that collateral damage so long as their primary objective – getting more money to buy more votes – is achieved.

But the rest of us should care, and a new report from the Tax Foundation offers a helpful way of showing why pro-tax politicians are misguided.

Here’s a table showing that the economy will lose almost $3 of output for every $1 that politicians can use for vote buying.

I added my commentary (in red) to the table.

My takeaway is that it is reprehensible for politicians to cause nearly $3 of foregone prosperity so that they can spend another $1.

Garrett Watson, author of the report, uses more sedate language to describes the findings.

Using Tax Foundation’s General Equilibrium Model, we estimate that the Ways and Means tax plan would reduce long-run GDP by 0.98 percent, which in today’s dollars amounts to about $332 billion of lost output annually. We estimate the plan would in the long run raise about $152 billion annually in new tax revenue, conventionally estimated in today’s dollars, meaning for every $1 in revenue raised, economic output would fall by $2.18. When the model accounts for the smaller economy, it estimates that the plan’s dynamic effects would reduce expected new tax collections to about $112 billion annually over the long run (also in today’s dollars), meaning for every $1 in revenue raised, economic output would fall by $2.96.

This is excellent analysis.

But I think it’s important to specify that political cost-benefit analysis (from the perspective of politicians) is not the same as economic cost-benefit analysis.

From an economic perspective, the foregone economic growth is a cost and the additional tax revenue for politicians also is a cost.

And I’ve augmented the table (again, in red) to show that the additional spending is yet another cost.

In other words, politicians are the main winners from Biden’s tax hike, and some of the interest groups getting additional handouts also might be winners (though I’ve previously pointed out that many of them wind up being losers as well in the long run).

P.S. The Tax Foundation model only measures the economic damage of higher taxes. If you also measure the harmful impact of more spending, the estimates of foregone economic output are much bigger.

Read Full Post »

Last week, I wrote about a new study which estimates that Biden’s fiscal agenda of bigger government and higher taxes would reduce economic output by about $3 trillion over the next decade.

Perhaps more relevant, that foregone economic growth would translate into more than $10,000 of lost compensation per job. And a lifetime drop in living standards of more than 4 percent for younger people.

And these numbers are based on research by the Congressional Budget Office, which is hardly a bastion of libertarian analysis.

The Biden White House has a different perspective.

How different? Well, the President actually claims that expanding the burden of government won’t cost anything.

I’m not joking. Here are some excerpts from an article in the Washington Post by Seung Min Kim and Tony Romm.

President Biden promised Friday that his sweeping domestic agenda package will cost “nothing” because Democrats will pay for it through tax hikes on the wealthy and corporations… The remarks were an attempt by Biden to assuage some of the cost concerns pointedly expressed by the moderate Democrats about the size of the legislation… The total spending outlined in the plan is $3.5 trillion… “It is zero price tag on the debt we’re paying. We’re going to pay for everything we spend,” Biden said in remarks from the State Dining Room at the White House.

Biden’s strange analysis has generated some amusing responses.

For instance, Gerard Baker opined in the Wall Street Journal about Biden’s magical approach.

…this is a novel way of estimating the cost of something. That eye-wateringly expensive dinner you had last week didn’t really cost you anything because you paid for it. …You could have used the money to invest in your children’s college fund. You could have paid off some of your credit card bill, the debt on which has quadrupled in the last year. But you chose instead to blow it on a few morsels of raw fish and a couple of bottles of 1982 Château Lafite Rothschild. Don’t worry, It didn’t cost you anything.

Biden and his team definitely deserve to be mocked for their silly argument.

For all intents and purposes, they want us to believe that there’s no downside if you combine anti-growth spending increases with anti-growth tax increases – so long as there’s no increase in red ink.

But there’s actually a fiscal theory that sort of supports what the White House is saying.

  • Capital (saving and investment) is a key driver of productivity and long-run growth.
  • Budget deficits divert capital from the economy’s productive sector to government.
  • Budget deficits raise interest rates, reducing incentives for investment.
  • Therefore, budget deficits are bad for prosperity.

For what it’s worth, all four of those statements are correct.

But the theory is nonetheless wrong because it elevates one variable – fiscal balance – while ignoring other variables that have a much bigger impact on economic performance.

For instance, the Congressional Budget Office at one point embraced this approach – even though it led to absurd implications such as growth being maximized with tax rates of 100 percent.

For further background, here’s a table I prepared back in 2012.

The White House today is basically embracing the IMF’s “austerity” argument that deficits/surpluses are the variable that has the biggest impact on growth.

P.S. Folks on the left must get whiplash because some days they embrace the Keynesian argument that deficits are good for growth and other days they argue that a big expansion of government will have zero cost because there is no increase in the deficit.

P.P.S. The folks on the right who focus solely on tax cuts also are guilty of elevating one variable while ignoring others (humorously depicted in this cartoon strip).

Read Full Post »

More than 12 years ago, I shared this video containing lots of data and research on the negative relationship between government spending and economic performance.

Since then, I’ve share numerous additional studies showing that bigger government dampens growth, mostly from scholars in academia.

Now it’s time for me to directly contribute to this debate.

In a study just published by the Club for Growth Foundation, co-authored with Robert O’Quinn (former Chief Economist at the Department of Labor), we estimated the likely economic impact of President Biden’s so-called Build Back Better plan to expand the welfare state.

Here are our main findings.

What’s especially noteworthy about our study is that we based our analysis on research published earlier this year by the Congressional Budget Office. In other words, a very establishment source.

And here are some excerpts from what we wrote.

President Biden has proposed to increase the burden of federal spending substantially over the next 10 years, diverting nearly $5.5 trillion from the private sector to the government… Most, but not all, of this new spending would be financed with higher tax rates on work, saving, investment, and entrepreneurship. …Based on scholarly academic research, including new findings from the nonpartisan Congressional Budget Office, Biden’s tax-and-spend agenda contained in his reconciliation bill will accelerate America’s fiscal decline and undermine economic performance. …the Biden’s reconciliation bill, which increases the spending burden by 1.9 percent of GDP, will reduce the economy’s growth rate by about 0.2 percent each year. That…translates into more than $3 trillion less national income over the next decade. And the nation’s economic output will be $613 billion lower in 2031 compared to what it would be in the absence of President Biden’s fiscal agenda. …The cumulative loss of employee income over the next 10 years will exceed $1.6 trillion. Some of that will be in the form of lower wages and some of that will be a consequence of lost jobs. On average, each worker in a nonfarm job will lose $10,391 in total compensation.

These results shouldn’t be a surprise.

Biden’s fiscal agenda would made the United States more like Europe and the economic data unambiguously demonstrate that Europeans suffer from significantly lower living standards.

P.S. I especially like the CBO study because it shows the amount of damage caused by more spending varies based on how the outlays are financed.

As this chart illustrates, class-warfare taxation is the worst way of financing a bigger burden of government.

P.P.S. The good news is that Biden probably won’t be able to convince Congress to approve all of his proposals for new spending and higher tax rates. The bad news is even approving half of the Biden’s plan would cause considerable damage to American prosperity and competitiveness.

P.P.P.S. For policy wonks, there are two main types of research involving the economic impact of government spending. For those focusing on short-run economic results, there’s a debate about Keynesian economics – whether more government spending can artificially generate some growth, particularly if the outlays are financed with debt.

I’m skeptical of the Keynesian argument, but it’s not relevant for today’s column, which focuses on how government spending impacts long-run economic results. And when looking at long-run data, most of the research suggests that government is too big. Indeed, it’s worth noting that there’s even research supporting my view from generally left-leaning international bureaucracies such as the World Bank, the International Monetary Fund, the Organization for Economic Cooperation and Development, and the European Central Bank.

Read Full Post »

With regards to fiscal policy, part of my mission is to proselytize in favor of lower tax rates and a smaller burden of government spending.

But another goal is simply to make sure people understand basic facts about the budget.

For instance, how many people know that Republican presidents (notwithstanding their rhetoric) generally increase spending at a faster rate than Democrats?

Not many.

And ever fewer people know that Republican presidents even increase domestic spending (discretionary outlays plus entitlements) faster than Democrats.

The only exception to this rule is Ronald Reagan.

Which explains why folks on the left don’t like him, which is a perfectly reasonable reaction from their perspective.

But what’s not reasonable is the way some of them butcher facts in pursuit a big-government agenda.

For instance, Paul Waldman of the Washington Post has a column claiming that Joe Biden is finally, after 40 years, ending the Reagan revolution.

…the old-school plutocrats who have long controlled the party’s policy agenda…are getting very frightened of the reconciliation bill Democrats are negotiating. …The reconciliation bill really does represent an undoing of Reaganism. …The bill would reverse what Ronald Reagan wrought on government spending… Reagan famously said that “government is not the solution to our problem; government is the problem.” His great achievement was to make that the default assumption of public debate, the paradigm under which the country would operate for decades. It held sway even during periods of Democratic rule. Bill Clinton embraced the Reagan paradigm… the Democratic reconciliation bill is most revolutionary. It would reinforce the safety net — largely temporary programs such as unemployment insurance and food stamps, meant to help when you experience a crisis — but it would also create a new system of social infrastructure… All of which would go far beyond what was in place before Reagan. …it really is a threat to the legacy of Reaganism.

Some of what Waldman wrote is correct.

Reagan did point out that “government is the problem.”

And we did get a bit of Reagan-style spending restraint under Bill Clinton (though one can certainly argue that the post-1994 GOP Congress deserves some or all of the credit).

But he is wildly wrong in his main point about a dominant Reagan-inspired paradigm on government spending.

Let’s go to the Historical Tables of the Budget, published by the Office of Management and Budget.

Here’s a chart based on Table 8.2, which shows total domestic spending (column E + column H) in inflation-adjusted dollars. As you can see, outlays have exploded in the post-Reagan years (and I included both 2019 and 2020 data to show that it’s not just the coronavirus-related spending increases from last year).

Now let’s look at Table 8.4, which allows us to show domestic spending (also column E + column H) as a share of economic output.

We see that the burden of such outlays declined significantly under Reagan. Sadly, all that progress evaporated (and then some) by 2019.

The bottom line is that Biden does have a big-government agenda.

But that’s not exactly a new paradigm. Every other president in the post-Reagan era has sided with government over taxpayers.

I miss the Gipper.

Read Full Post »

The Biden Administration’s approach to tax policy is awful, as documented here, here, here, and here.

We’ve now reached the stage where bad ideas are being turned into legislation. Today’s analysis looks at what the House Ways & Means Committee (the one in charge of tax policy) has unveiled. Let’s call this the Biden-Pelosi plan.

And we’re going to use some great research from the Tax Foundation to provide a visual summary of what’s happening.

We’ll start with a very depressing look at the decline in American competitiveness if the proposal becomes law (the good news is that we’ll still be ahead of Greece!).

Next, let’s look at the Tax Foundation’s map of capital gains tax rates if the plan is approved.

Unsurprisingly, this form of double taxation will be especially severe in California.

Our third visual is good news (at least relatively speaking).

Biden wanted the U.S. to have the developed world’s highest corporate tax rate. But the plan from the House of Representatives would “only” put America in third place.

Here’s another map, in this case looking at tax rates on non-corporate businesses (small businesses and other entities that get taxed by the 1040 form).

This is not good news for America’s entrepreneurs. Especially the ones unfortunate enough to do business in New York.

Last but not least, here’s the Tax Foundation’s estimate of what will happen to the economy if the Biden-Pelosi tax plan is imposed on the nation.

There are two things to understand about these depressing growth numbers.

  • First, small differences in growth rates produce very large consequences when you look 20 years or 30 years into the future. Indeed, this explains why Americans enjoy much higher living standards than Europeans (and also why Democrats are making a big economic mistake to copy European fiscal policy).
  • Second, the Tax Foundation estimated the economic impact of the Biden-Pelosi tax plan. But don’t forget that the economy also will be negatively impacted by a bigger burden of government spending. So the aggregate economic damage will be significantly larger when looking at overall fiscal policy.

One final point. In part because of the weaker economy (i.e., a Laffer Curve effect), the Tax Foundation also estimated that the Biden-Pelosi tax plan will generate only $804 billion over the next 10 years.

P.S. Here’s some background for those who are not political wonks. Biden proposed a budget with his preferred set of tax increases and spending increases. But, in America’s political system (based on separation of powers), both the House and Senate get to decide what they like and don’t like. And even though the Democrats control both chambers of Congress, they are not obligated to rubber stamp what Biden proposed. The House will have a plan, the Senate will have a plan, and they’ll ultimately have to agree on a joint proposal (with White House involvement, of course). The same process took place when Republicans did their tax bill in 2017.

P.P.S. It’s unclear whether the Senate will make things better or worse. The Chairman of the Senate Finance Committee, Ron Wyden, has some very bad ideas about capital gains taxation and politicians such as Elizabeth Warren are big proponents of a wealth tax.

Read Full Post »

When I discuss class-warfare tax policy, I want people to understand deadweight loss, which is the term for the economic output that is lost when high tax rates discourage work, saving, investment, and entrepreneurship.

And I especially want them to understand that the economic damage grows exponentially as tax rates increase (in other words, going from a 30 percent tax rate to a 40 percent tax rate is a lot more damaging than going from a 10 percent tax rate to a 20 percent tax rate).

But all of this analysis requires a firm grasp of supply-and-demand curves. And most people never learned basic microeconomics, or they forgot the day after they took their exam for Economics 101.

So when I give speeches about the economics of tax policy, I generally forgo technical analysis and instead appeal to common sense.

Part of that often includes showing an image of a “philoso-raptor” pondering whether the principle that applies to tobacco taxation also applies to taxes on work.

Almost everyone gets the point, especially when I point out that politicians explicitly say they want higher taxes on cigarettes because they want less smoking.

And if you (correctly) believe that higher taxes on tobacco lead to less smoking, then you also should understand that higher taxes on work will discourage productive behavior.

Unfortunately, these common-sense observations don’t have much impact on politicians in Washington. Joe Biden and Democrats in Congress are pushing a huge package of punitive tax increases.

Should they succeed, all taxpayers will suffer. But some will suffer more than others. In an article for CNBC, Robert Frank documents what Biden’s tax increase will mean for residents of high-tax states.

Top earners in New York City could face a combined city, state and federal income tax rate of 61.2%, according to plans being proposed by Democrats in the House of Representatives. The plans being proposed include a 3% surtax on taxpayers earning more than $5 million a year. The plans also call for raising the top marginal income tax rate to 39.6% from the current 37%. The plans preserve the 3.8% net investment income tax, and extend it to certain pass-through companies. The result is a top marginal federal income tax rate of 46.4%. …In New York City, the combined top marginal state and city tax rate is 14.8%. So New York City taxpayers…would face a combined city, state and federal marginal rate of 61.2% under the House plan. …the highest in nearly 40 years. Top earning Californians would face a combined marginal rate of 59.7%, while those in New Jersey would face a combined rate of 57.2%.

You don’t have to be a wild-eyed “supply-sider” to recognize that Biden’s tax plan will hurt prosperity.

After all, investors, entrepreneurs, business owners, and other successful taxpayers will have much less incentive to earn and report income when they only get to keep about 40 cents out of every $1 they earn.

Folks on the left claim that punitive tax rates are necessary for “fairness,” yet the United States already has the developed world’s most “progressive” tax system.

I’ll close with the observation that the punitive tax rates being considered will generate less revenue than projected.

Why? Because households and businesses will have big incentives to use clever lawyers and accountants to protect their income.

Looking for loopholes is a waste of time when rates are low, but it’s a very profitable use of time and energy when rates are high.

P.S. Tax rates were dramatically lowered in the United States during the Reagan years, a policy that boosted the economy and led to more revenues from the rich. Biden now wants to run that experiment in reverse, so don’t expect positive results.

P.P.S. Though if folks on the left are primarily motivated by envy, then presumably they don’t care about real-world outcomes.

Read Full Post »

In an ideal world, Americans would have personal retirement accounts, just like workers in Australia, Sweden, Chile, Hong Kong, Israel, Switzerland, and a few dozen other nations.

But we’re not in that ideal world. We are forced to participate in a Ponzi Scheme known as Social Security.

By the way, that’s not necessarily a disparaging description. A Ponzi Scheme can work if there are always enough new people in the system to pay off the old people.

But because of demographic changes (increasing lifespans and decreasing birthrates), that’s not what we have in the United States.

And this is why Social Security faces serious long-run problems.

How serious? The Social Security Administration finally released the annual Trustees Report. This document has a wealth of data on the program’s financial condition, and Table VI.G9 is where the rubber meets the road.

As you can see from this chart, there will be an ever-increasing burden of Social Security taxes and spending over the next 75 years. And these numbers are adjusted for inflation!

The good news (relatively speaking) is that the economy also will be growing over the next 75 years, both in nominal terms and inflation-adjusted terms.

The bad news is that spending on Social Security will grow at a faster rate, so the program will consume a larger share of the economy’s output.

And because Social Security spending is growing faster than the economy (and also faster than tax revenue), this next chart shows there is going to be more and more red ink in the future. Once again, you’re looking at inflation-adjusted data.

As indicated by the chart’s title, the cumulative shortfall over the next 75 years is nearly $48 trillion. That’s a lot of money, even by Washington standards.

And with each passing year, the problem seems to worsen. The 75-year shortfall was $44.7 trillion according to the 2020 report and $42.1 trillion according to the 2019 report.

I’ll conclude by observing that today’s column focuses on the big-picture fiscal problems with Social Security.

But let’s not forget the program’s second crisis, which is the fact that Americans are deprived of the ability to enjoy much higher levels of retirement income.

Certain groups are particularly harmed by this aspect of the current program, including minorities, women, older workers, and low-income workers.

P.S. Our friends on the left argue that the program’s fiscal problems (the first crisis) can be solved with tax increases. Perhaps that is true, but it will mean a weaker economy and it will exacerbate the second crisis by forcing workers to pay more to get less.

P.P.S. I once made a $16 trillion dollar mistake on national TV when discussing Social Security’s shaky finances.

P.P.P.S. Much of the news coverage about the Trustees Report has focused on the year the Social Security Trust Fund supposedly runs out of money. But this is sloppy journalism since the Trust Fund has nothing but IOUs (as illustrated by this joke).

Read Full Post »

Public finance theory teaches us that the capital gains tax should not exist. Such a levy exacerbates the bias against saving and investment, which reduces innovation, hinders economic growth, and lowers worker compensation.

All of which helps to explain why President Biden’s proposals to increase the tax burden on capital gains are so misguided.

Thanks to some new research from Professor John Diamond of Rice University, we can now quantify the likely damage if Biden’s proposals get enacted.

Here’s some of what he wrote in his new study.

We use a computable general equilibrium model of the U.S. economy to simulate the economic effects of these policy changes… The model is a dynamic, overlapping generations, computable general equilibrium model of the U.S. economy that focuses on the macroeconomic and transitional effects of tax reforms. …The simulation results in Table 1 show that GDP falls by roughly 0.1 percent 10 years after reform and 0.3 percent 50 years after reform, which implies per household income declines by roughly $310 after 10 years and $1,200 after 50 years. The long run decline in GDP is due to a decline in the capital stock of 1.0 percent and a decline in total hours worked of 0.1 percent. …this would be roughly equivalent to a loss of approximately 209,000 jobs in that year. Real wages decrease initially by 0.2 percent and by 0.6 percent in the long run.

Here is a summary of the probable economic consequences of Biden’s class-warfare scheme.

But the above analysis should probably be considered a best-case scenario.

Why? Because the capital gains tax is not indexed for inflation, which means investors can wind up paying much higher effective tax rates if prices are increasing.

And in a world of Keynesian monetary policy, that’s a very real threat.

So Prof. Diamond also analyzes the impact of inflation.

…capital gains are not adjusted for inflation and thus much of the taxable gains are not reflective of a real increase in wealth. Taxing nominal gains will reduce the after-tax rate of return and lead to less investment, especially in periods of higher inflation. …taxing the nominal value will reduce the real rate of return on investment, and may do so by enough to result in negative rates of return in periods of moderate to high inflation. Lower real rates of return reduce investment, the size of the capital stock, productivity, growth in wage rates, and labor supply. …Accounting for inflation in the model would exacerbate other existing distortions… An increase in the capital gains tax rate or repealing step up of basis will make investments in owner-occupied housing more attractive relative to other corporate and non-corporate investments.

Here’s what happens to the estimates of economic damage in a world with higher inflation?

Assuming the inflation rate is one percentage point higher on average (3.2 percent instead of 2.2 percent) implies that a rough estimate of the capital gains tax rate on nominal plus real returns would be 1.5 times higher than the real increase in the capital gains tax rate used in the standard model with no inflation. Table 2 shows the results of adjusting the capital gains tax rates by a factor of 1.5 to account for the effects of inflation. In this case, GDP falls by roughly 0.1 percent 10 years after reform and 0.4 percent 50 years after reform, which implies per household income declines by roughly $453 after 10 years and $1,700 after 50 years.

Here’s the table showing the additional economic damage. As you can see, the harm is much greater.

I’ll conclude with two comments.

P.S. If (already-taxed) corporate profits are distributed to shareholders, there’s a second layer of tax on those dividends. If the money is instead used to expand the business, it presumably will increase the value of shares (a capital gain) because of an expectation of higher future income (which will be double taxed when it occurs).

Read Full Post »

Back in 2019, I listed “Six Principles to Guide Policy on Government Spending.”

If I was required to put it all in one sentence (sort of), here’s the most important thing to understand about fiscal policy.

This does not mean, by the way, that we should be anarcho-capitalists and oppose all government spending.

But it does mean that all government spending imposes a burden on the economy and that politicians should only spend money to finance “public goods” that generate offsetting benefits.

Assuming, of course, that the goal is greater prosperity.

I’m motivated to address this topic because Philip Klein wrote a column for National Review about Biden’s new spending. He points out that this new spending is bad, regardless of whether it is debt-financed or tax-financed.

As Democrats race toward squandering another $4.1 trillion — perhaps with some Republican help — we are being told over and over how the biggest stumbling block is figuring out how the new spending will be “paid for.” …Senator Joe Manchin (D., W.Va.), who is trying to maintain his image as a moderate, insisted that he doesn’t believe the spending should be passed if it isn’t fully financed. “Everything should be paid for,” Manchin has told reporters. …Republican members of the bipartisan group have also made similar comments. …But it is folly to consider massive amounts of new spending to be “responsible” as long as members of Congress come up with enough taxes to raise… At some point in the next few weeks, Democrats (and possibly Republicans) will announce that they have reached a deal on some sort of major spending compromise. They will claim that it is fully paid for, and assert that it is fiscally responsible. But there is nothing responsible about adding trillions in new obligations at a time when the nation is already heading for fiscal catastrophe.

Klein is correct.

Biden’s spending binge will be just as damaging to prosperity if it is financed with taxes rather than financed by debt.

The key thing to realize is that we’ll have less growth if more of the economy’s output is consumed by government spending.

Giving politicians and bureaucrats more control over the allocation of resources is a very bad idea (as even the World Bank, OECD, and IMF have admitted).

Read Full Post »

Back in 2009, there was strong and passionate opposition to Bush’s corrupt TARP scheme and Obama’s fake stimulus boondoggle – both of which had price tags of less than $1 trillion.

Today, Biden has already squandered $1.9 trillion on his version of “stimulus” and has asked Congress to expand the federal government’s budgetary burden by another $3.5 trillion (plus about $600 billion for so-called infrastructure).

Yet there doesn’t seem to be the same intensity of opposition, even though Biden is proposing policies that are far more costly.

Is this simply because Republicans were corrupted by Trump’s profligacy and are now comfortable with big government?

Or are they distracted by cultural battles over issues such as critical race theory?

I don’t know, but I’m very worried that insufficient opposition may result in Biden’s dependency agenda getting enacted.

And I’m even more worried because we now know that the left intends to increase the spending burden by a lot more than $3.5 trillion. Especially since Bernie Sanders is Chairman of the Senate Budget Committee.

The Wall Street Journal opined on this topic a couple of days ago.

Democrats have provided few details of what they plan to include in Sen. Bernie Sanders’s $3.5 trillion budget proposal, and now we know why. The real cost is $5 trillion or more… Their plan is to include every program but start small and pretend they’re temporary. This will let them skirt the budget-reconciliation rule that spending can’t add to the deficit outside a 10-year budget window without triggering a 60-vote threshold to pass. The nonprofit Committee for a Responsible Federal Budget examined the budget outline… Assuming the major provisions will be made permanent and continue through the 10-year budget window, the group says, the “policies under consideration could cost between $5 trillion and $5.5 trillion over a decade.” …All of this false accounting will let Democrats pretend the overall cost of their budget spending is lower than it really is… Any way you add it up, Democrats are attempting to pass the biggest expansion of government since the 1960s with narrow majorities and no electoral mandate. No wonder they want to disguise its real cost.

By the way, it’s not just Democrats who play this game. Some provisions of the Trump tax cut expire in 2025 because Republicans also finagled to get around restrictions that govern the 10-year budget process.

That being said, I don’t think there’s moral equivalency between proposals to let people keep their own money and the Biden-Bernie scheme to buy votes with other people’s money.

Anyhow, here’s the relevant table from the Committee for a Responsible Federal Budget’s report.

P.S. This battle is not just an issue of dollars and cents. Some of the Biden-Bernie proposals, such as per-child handouts, would increase dependency by undoing Bill Clinton’s welfare reform.

P.P.S. Don’t forget all the debilitating taxes that will accompany all the new spending.

P.P.P.S. But at least we’ll “catch up” with Europe if Biden-Bernie agenda is enacted.

Read Full Post »

President Biden pushed through $1.9 trillion of new spending earlier this year, but that so-called stimulus plan was mostly for one-time giveaways. As I warn in this recent discussion on Denver’s KHOW, we should be much more worried about his proposals to permanently expand the welfare state.

When I first got to Washington, I would be upset that politicians wanted to add billions of dollars to the burden of government.

Well, those were the good ol’ days. Biden is proposing to divert trillions of dollars from the private sector to expand the welfare state.

Even worse, he wants to make more Americans dependent on the federal government.

Maybe that’s a smart way of buying votes, but it will erode societal capital.

John Cogan and Daniel Heil of the Hoover Institution warned about the consequences of this dependency agenda in a column for the Wall Street Journal.

The federal government’s system of entitlements is the largest money-shuffling machine in human history, and President Biden intends to make it a lot bigger. His American Families Plan—which he recently attempted to tie to a bipartisan infrastructure deal—proposes to extend the reach of federal entitlements to 21 million additional Americans, the largest expansion since Lyndon B. Johnson’s Great Society. …more than half of working-age households would be on the entitlement rolls if the plan were enacted in its current form. …57% of all married-couple children would receive federal entitlement benefits, and more than 80% of single-parent households would be on the entitlement rolls.

Many of the handouts would go to people with middle-class incomes.

And higher.

…The American Families Plan proposes several new entitlement programs. One promises students the government will pick up the entire cost of community-college tuition; another promises families earning 1.5 times their state’s median income that Washington will cover all daycare expenses above 7% of family income for children under 5; still another promises workers up to 12 weeks of federally financed wage subsidies to take time off to care for newborns or sick family members. …Two-parent households with two preschool-age children and incomes up to $130,000 would qualify for federal cash assistance for daycare. Single parents with two preschoolers and incomes up to $113,000 would qualify. And some families with incomes over $200,000 would be eligible for health-insurance subsidies. Other parts of the plan, such as paid leave and free community college, have no income limits at all.

The Wall Street Journal opined on this issue last month. Here are the key passages from their editorial.

The entitlements are by far the biggest long-term economic threat from the Biden agenda. …entitlements that spend automatically based on eligibility are nearly impossible to repeal, or even reform, and they represent a huge tax-and-spend wedge far into the future. …We’d highlight two points. First is the dishonesty about costs. Entitlements always start small but then soar. The Biden Families Plan is even more dishonest than usual. For example, it pretends the child tax credit ends in 2025, so its cost is $449 billion over the 10-year budget window that is used for reconciliation bills that require only 51 votes to pass the Senate. But a future Congress will never repeal the credit. …Second, these programs aren’t intended as a “safety net” for the poor or those temporarily down on their luck. They are explicitly designed to make the middle class dependent on government handouts.

The editorial explicitly warns that the United States will economically suffer if politicians copy Europe’s counterproductive redistributionism.

…on present trend the U.S. is falling into the same entitlement trap as Western Europe. Entitlement spending requires higher taxes, which grab 40% or more of GDP. Economic growth declines as more money flows to transfer payments instead of investment. The entitlement state becomes too large to afford but also too politically entrenched to reform. …Only a decade ago the Tea Party fought ObamaCare. Now most Beltway conservatives worry more about Big Tech than they do Big Government. If the Biden Families Plan passes, these conservatives will find themselves spending the rest of their careers as tax collectors for the entitlement state.

Amen. I’m baffled when folks on the left argue that we should “catch up” with Europe.

Are they not aware that American living standards are far higher? Do they not understand that low-income people in the United States often have more income than middle-class people on the other side of the Atlantic Ocean?

P.S. As I mentioned in the interview, the 21st century has been bad news for fiscal policy, with two big-government Republicans and two big-government Democrats.

For what it’s worth, the $3,000-per-child handouts are Biden’s most damaging idea. In one fell swoop, he would create a trillion-dollar entitlement program and repeal the successful Clinton-Gingrich welfare reform.

Read Full Post »

I’m not optimist about America’s fiscal future. Thanks primarily to entitlement programs, the long-run outlook shows an ever-increasing burden of government spending.

And rather than hit the brakes, Biden wants to step on the gas with new giveaways, especially his plan to gut Bill Clinton’s welfare reform by creating new per-child handouts that would subsidize idleness and family dissolution.

But that doesn’t mean the problems can’t be fixed. We simply need to replace fiscal profligacy with spending restraint.

To set the stage for this discussion, here’s a look at what’s happened to the budget over the past several decades.  You can see how the burden of federal spending has steadily increased, with noticeable one-time bumps in 2008-2009 (TARP and Obama’s so-called stimulus) and 2020-2021 (coronavirus).

The chart also includes projections between 2021 and 2031, based on new numbers from the Congressional Budget Office.

For today’s column, I want to focus on the next 10 years and show how the current fiscal mess can be averted with some modest spending restraint.

This second chart shows that spending actually drops over the next two years as coronavirus-related spending comes to an end. But once we get to 2023, the orange line shows that “baseline” spending (what happens to the budget if things are left on autopilot) climbs rapidly, more than twice the rate needed to keep pace with inflation.

But if there’s any sort of fiscal restraint (a freeze or some sort of spending cap), then the numbers look much better.

More specifically, a freeze or a 1-percent spending cap would actually produce a budget surplus by the year 2031.

But I’m not fixated on getting to a balanced budget. What’s more important is that the burden of government spending shrinks when the budget grows slower than the private sector.

In other words, we get good results when policy makers follow fiscal policy’s Golden Rule.

P.S. While it’s difficult to convince politicians to support spending restraint, it’s worth noting that the nation enjoyed a five-year spending freeze between 2009-2014.

P.P.S. In the long run, a spending freeze almost certainly requires genuine entitlement reform.

Read Full Post »

« Newer Posts - Older Posts »