The Congressional Budget Office has released its new Long-Term Budget Outlook and I will continue my annual tradition (see 2018, 2019, 2020, 2021, 2022, 2023) of sharing some very bad news about America’s fiscal future.
Most budget wonks focus on what CBO says about deficits and debt. And those numbers are grim.
But it’s much more important to focus on the underlying problem of excessive spending. After all, red ink is merely one of the symptoms of a government that is too big.
So here’s CBO’s forecast of spending and revenue over the next three decades. As you can see, both taxes and spending are becoming bigger burdens.
The bad news is that the tax burden is rising over time
The worse news is that the spending burden also is rising over time. And the worst news is that the spending burden is rising even faster than the tax burden in rising.
Here’s what CBO wrote in the report.
In the Congressional Budget Office’s projections, deficits…grow larger over the next 30 years because…spending…increases faster than revenues over the subsequent 30 years. Both federal spending and federal revenues equal a larger percentage of the nation’s gross domestic product (GDP) in coming years than they did, on average, over the past 50 years. Under current law, total federal outlays would equal 23.1 percent of GDP in 2024, remain near that level through 2028, and then increase each year as a share of the economy, reaching 27.3 percent in 2054… From 1974 to 2023, outlays averaged 21 percent of GDP; over the 2024–2054 period, projected outlays average about 25 percent of GDP… The key drivers of that increase over the next 30 years are higher net interest costs, which result from rising interest rates and growing federal debt, and growth in spending on major health care programs, particularly Medicare, which is caused by the rising cost of health care and the aging of the population.
To elaborate on that final sentence, our next visual is CBO’s forecast for both health entitlements and Social Security.
You can see that Social Security is becoming a bigger burden, but programs such as Medicare and Medicaid are easily the nation’s main budget problem.
We either have entitlement reform or we have massive tax increases. Sadly, the two main presidential candidates in 2024 prefer the wrong option.
P.S. Here’s one final excerpt from the report. CBO acknowledges that higher tax burdens will be bad for growth.
The agency’s economic projections…incorporate the effects of changes in federal tax policies scheduled under current law, including the expiration of certain provisions of the 2017 tax act. Under current law, tax rates on individuals’ income are scheduled to increase at the end of 2025, when those provisions are scheduled to expire. Those changes aside, as income rises faster than inflation, more income is pushed into higher tax brackets over time. That real bracket creep results in higher effective marginal tax rates on labor income and capital. Higher marginal tax rates on labor income reduce people’s after-tax wages and weaken their incentive to work. Likewise, an increase in the marginal tax rate on capital income lowers people’s incentives to save and invest, thereby reducing the stock of capital and, in turn, labor productivity. In CBO’s projections, that reduction in labor productivity puts downward pressure on wages. All told, less private investment and a smaller labor supply decrease economic output and income in CBO’s extended baseline projections.
Way back in 2010, and then over and over again in subsequent years, I have showed that it is very simple to balance the budget.
All that is necessary is some reasonable spending restraint, sort of like what happened during the Tea Party era in the early part of last decade.
Today, let’s see if that’s still true. The Congressional Budget Office just released its Economic and Budget Outlook, which includes a 10-year forecast of what will happen if spending and revenue are left on autopilot.
As I almost always do when that happens, I calculate what amount of spending restraint would be necessary to balance the budget over 10 years.
As you can see in the chart, limited spending so it grows by 1.4 percent yearly is all that is needed to balance the budget.
The budget can be balanced much quicker with a spending freeze. And the deficit can be largely eliminated if spending grows by 2 percent annually.
By the way, CBO projects that inflation will average close to 2 percent over the next decade.
So the main takeaway is that we can basically eliminate red ink if the federal budget grows slightly less than the rate of inflation.
There are two points worth mentioning.
There is no need for any tax increases. Revenues already are projected to grow by 4.2 percent yearly, nearly twice the estimated rate of inflation. Plus, tax increases would surely give politicians an excuse to increase spending.
Spending restraint is a simple concept, but it would not be politically easy. Interest groups want to leave spending on autopilot, or have it grow even faster. Plus, some entitlement reform almost surely would be necessary.
One further point is that the CBO baseline assumes that the Trump tax cuts expire at the end of 2025. Extending those tax cuts would lower the revenue baseline, thus requiring additional spending restraint to achieve a balanced budget over the 10-year window.
P.S. Balancing the budget is a good idea, but spending restraint should be the main goal of fiscal policy. Fortunately, the evidence shows that spending restraint is the only effective way of achieving fiscal balance (whereas tax increases have a track record of failure).
And you can see from this chart that the fiscal burden of the federal government is projected to grow at a very rapid pace over the next decade.
Other fiscal experts fret that deficits and debt are increasing between now and 2033, but the above chart shows that the real problem is that the spending burden is rising faster than the tax burden.
The real fiscal fight in Washington is how to close the gap between the red spending line and the green revenue line (supporters of Modern Monetary Theory say we can just print money to finance big government, but let’s ignore them for purposes of today’s column).
Since I think Washington is spending far too much, I want to close the gap by restraining the growth of government.
So here’s a second chart illustrating what would happen if there was some sort of spending cap. As you can see, a spending freeze (like we had from 2009-2014) would balance the budget by 2030.
And spending would have to be limited to 1.3 percent annual growth if the goal is to balance the budget within 10 years,
And, even if they did want to do the right thing, adhering to a 1.3 percent spending cap would require serious entitlement reform. So don’t hold your breath hoping for immediate progress.
P.S. The numbers are out of date, but here’s a video that explains how spending restraint is the key to fiscal balance. And here’s a video on how some other nations made enormous progress with multi-year spending restraint.
Yesterday’s column analyzed some depressing data in the new long-run fiscal forecast from the Congressional Budget Office.
Simply stated, if we leave fiscal policy on auto-pilot, government spending is going to consume an ever-larger share of America’s economy. Which means some combination of more taxes, more debt, and more reckless monetary policy.
Today, let’s show how that problem can be solved.
My final chart yesterday showed that the fundamental problem is that government spending is projected to grow faster than the private economy, thus violating the “golden rule” of fiscal policy.
Here’s a revised version of that chart. I have added a bar showing how fast tax revenues are expected to grow over the next 30 years, as well as a bar showing the projection for population plus inflation.
As already stated, it’s a big problem that government spending is growing faster (an average of 4.63 percent per year) than the growth of the private economy (an average of 3.75 percent per years.
But the goal of fiscal policy should not be to maintain the bloated budget that currently exists. That would lock in all the reckless spending we got under Bush, Obama, and Trump. Not to mention the additional waste approved under Biden.
Ideally, fiscal policy should seek to reduce the burden of federal spending.
If government spending can only grow as fast as inflation plus population, we avoid giant future deficits. Indeed, we eventually get budget surpluses.
But I’m not overly concerned with fiscal balance. The proper goal should be to reduce the burden of spending, regardless of how it is financed.
And a spending cap linked to population plus inflation over the next 30 years would yield impressive results. Instead of the federal government consuming more than 30 percent of the economy’s output, only 17.8 percent of GDP would be diverted by federal spending in 2052.
P.S. A spending cap also could be modeled on Switzerland’s very successful “debt brake.”
P.P.S. Some of my left-leaning friends doubtlessly will think a federal budget that consumes “only” 17.8 percent of GDP is grossly inadequate. Yet that was the size of the federal government, relative to economic output, at the end of Bill Clinton’s presidency.
We’ll start with projections over the next three decades for taxes and spending, measured as a share of economic output (gross domestic product). As you can see, the tax burden is increasing, but the spending burden is increasing even faster.
By the way, some people think America’s main fiscal problem is the gap between the two lines. In other words, they worry about deficits and debt.
But the real problem is government spending. And that’s true whether the spending burden is financed by taxes, borrowing, or printing money.
So why is the burden of government spending projected to get larger?
As you can see from Figure 2-2, entitlement programs deserve the lion’s share of the blame. Social Security spending is expanding as a share of GDP, and health entitlements (Medicare, Medicaid, and Obamacare) are expanding even faster.
Now let’s confirm that the problem is not on the revenue side.
As you can see from Figure 2-7, taxation is expected to consume an ever-larger share of economic output in future decades. And that’s true even if the Trump tax cuts are made permanent.
Having shared three charts from CBO’s report, it’s now time for a chart that I created using CBO’s long-run data.
My chart shows that America’s main fiscal problem is that we are not abiding by fiscal policy’s Golden Rule. To be more specific, the burden of government is projected to grow faster than the economy.
When I first started writing this daily column, the Congressional Budget Office was infamous for dodgy economics.
In the short run, CBO believed in the very simplistic Keynesian notionthat a bigger burden of government spending somehow stimulated the economy. The bureaucracy was infamous for reflexively claiming that job losses were actually job gains.
The good news is that CBO is more of a mainstream organization today.
It’s far from being libertarian, to be sure, but it no longer seems to have the left-leaning bias that plagued the bureaucracy in the past (it had gotten so bad that I advised Republicans not to cite CBO numbers even when they seemed helpful to the cause of less government).
For instance, I grudgingly acknowledged a few years ago that CBO was better (but still not good) when analyzing potential repeal of Obamacare.
And I was actually impressed last year when CBO published a report showing that a bigger burden of government spending would reduce growth.
And now we have another report that reaches similar conclusions.
The new study, released last month, considers what would happen if lawmakers decided to control red ink by either raising taxes of by restraining spending.
A perpetually rising debt-to-GDP ratio is unsustainable over the long term because financing deficits and servicing the debt would consume an ever-growing proportion of the nation’s income. In this report, CBO analyzes the effects of measures that policymakers could take to prevent debt as a percentage of GDP from continuing to climb. Policymakers could restrain the growth of spending, raise revenues, or pursue some combination of those two approaches. …or this analysis, CBO examined two simplified policies. The first would raise federal tax rates on different types of income proportionally. The second would cut spending for certain government benefit programs—mostly for Social Security, Medicare, and Medicaid. Under each of the two stylized policy options, debt as a percentage of GDP would be fully stabilized 10 years after the changes were implemented.
Trimming spending for existing programs is better than nothing, of course, but the goal should be to achieve both structural reforms and budgetary savings.
But I’m digressing. Let’s get back to what was actually in the report. Here’s what CBO projects if policy makers choose to raise taxes.
…the higher tax rates that would be required if implementation of the policy was delayed would reduce after-tax wages, which would discourage work and lower the aggregate supply of labor. Those reductions in capital stock and the labor supply would cause GDP to be lower… As a result, GDP would be 0.9 percent lower in 2051 if implementation of the policy was delayed by 5 years and 2.6 percent lower if it was delayed by 10 years.
And here’s what happens if they decide to trim benefits.
…a drop in benefits would reduce people’s income and induce some people to work more to, at least partially, maintain their standard of living, thereby increasing the aggregate labor supply. …a drop in expected future retirement benefits would induce workers to save more before they retired, and that increased saving would, in turn, increase the aggregate capital stock.
Figure 3 from the report allows readers to compare how the different options affect the economy’s output.
In other words, we get lower living standards if taxes go up and higher living standards if spending is restrained.
How big is the difference? As you can see, the tax increase options (light green) cause significant long-run reductions in gross domestic product.
Trimming benefits by contrast (the dark green lines) actually lead to a slight increase in economic output.
The report accurately explains why the two policy choices produce such different results.
…GDP would be lower after an increase in income tax rates than it would be after cuts in benefit payments… Whereas benefit cuts strengthen people’s incentives to work and save, tax increases weaken those incentives and thus reduce the capital stock, the labor supply, and output.
In other words, it’s not a good idea to copy nations such as France, Italy, and Greece.
Which is a good description of Biden’s so-called plan to Build Back Better.
And rather than hit the brakes, Biden wants to step on the gas with new giveaways, especially his plan to gut Bill Clinton’s welfare reform by creating new per-child handouts that would subsidize idleness and family dissolution.
But that doesn’t mean the problems can’t be fixed. We simply need to replace fiscal profligacy with spending restraint.
To set the stage for this discussion, here’s a look at what’s happened to the budget over the past several decades. You can see how the burden of federal spending has steadily increased, with noticeable one-time bumps in 2008-2009 (TARP and Obama’s so-called stimulus) and 2020-2021 (coronavirus).
The chart also includes projections between 2021 and 2031, based on new numbers from the Congressional Budget Office.
For today’s column, I want to focus on the next 10 years and show how the current fiscal mess can be averted with some modest spending restraint.
This second chart shows that spending actually drops over the next two years as coronavirus-related spending comes to an end. But once we get to 2023, the orange line shows that “baseline” spending (what happens to the budget if things are left on autopilot) climbs rapidly, more than twice the rate needed to keep pace with inflation.
But if there’s any sort of fiscal restraint (a freeze or some sort of spending cap), then the numbers look much better.
More specifically, a freeze or a 1-percent spending cap would actually produce a budget surplus by the year 2031.
But I’m not fixated on getting to a balanced budget. What’s more important is that the burden of government spending shrinks when the budget grows slower than the private sector.
In other words, we get good results when policy makers follow fiscal policy’s Golden Rule.
P.S. While it’s difficult to convince politicians to support spending restraint, it’s worth noting that the nation enjoyed a five-year spending freeze between 2009-2014.
That’s true if you look at average levels of consumption in different nations, but the most compelling data is the fact that lower-income people in the United States generally enjoy living standards that are equal to or even higher than those for middle-class people in most European countries.
A bigger burden of government is not just a theoretical concern. President Biden has already pushed through a $1.9 trillion spending bill that includes some temporary provisions – such as per-child handouts – that, if made permanent, could add several trillion dollars to the burden of government spending.
And the White House has signaled support for $3 trillion of additional spending for items such as infrastructure, green energy, and other boondoggles.
So what will it mean for America if our medium-sized welfare state morphs into a European-style large welfare state?
The answer to that question is rather unpleasant, at least if some new research from the Congressional Budget Office is any indication. The study, authored by Jaeger Nelson and Kerk Phillips, considers the impact on growth based on six different scenarios (based on how much the spending burden increases and what taxes are increased).
If permanent spending is financed by new or increased taxes, then those taxes influence people’s decisions about how much to work and save. Those decisions then affect how much the economy produces and businesses invest and, ultimately, how much people can consume. Different types of taxes have different economic effects. Taxes on labor income reduce after-tax wages, so they reduce the return on each additional hour worked. …Higher taxes on capital income, such as dividends and capital gains, lower the average after-tax rate of return on private wealth holdings (or the return on investment), which reduces the incentive to save and invest and leads to reductions in saving, investment, and the capital stock. …we compare the effects of raising additional revenues through three illustrative tax policies: a flat tax on labor income, a flat tax on all income (including both labor and capital income), and a progressive tax on all income. The additional revenues generated by these policies are in addition to the revenues raised by taxes that already exist and are used to finance two specific increases in government spending. The two increases in government spending are set to 5 percent and 10 percent of GDP in 2020.
Here are some of the key results, as illustrated by the chart.
The least-worst result (the blue line) is a decline in GDP of about 3 percent, and that happens if the spending burden expand by 5-percentage points of GDP and is financed by a flat tax.
The worst-worst result (dashed red line) is a staggering decline in GDP of about 10 percent, and that happens if the spending burden climbs by 10-percentage points and is financed by a progressive tax.
Here’s some additional analysis, including a description of why progressive taxes impose the most damage.
This paper shows that flat labor and flat income tax policies have similar effects on output; labor taxes reduce the labor supply more, and income taxes reduce the capital stock more. For all three policies, the decline in income contracts the tax base considerably over time. As a result, to continuously generate enough revenues to finance the increase in government spending in each year, tax rates must steadily increase over time to account for the decline in the tax base. Moreover, labor and capital taxes put upward pressure on interest rates by reducing the capital-to-labor ratio over time… The largest declines in economic activity among the financing methods considered occur with the progressive tax on all income. Those declines occur because high-productivity workers reduce their hours worked and because higher taxes on asset income reduce the incentive to save and invest relatively more than under the two flat taxes.
There’s lots of additional information in the study, but I definitely want to draw attention to Table 4 because it shows that lower-income people will suffer big reductions in living standards if there’s an increase in the burden of government spending (circled in red).
What makes these results especially remarkable is that the authors only look at the damage caused by higher taxes.
Yet we know from other research that the economy also will suffer because of the higher spending burden. This is because of the various ways that growth is reduced when resources are diverted from the productive sector to the government.
For background, here’s a video on the theoretical reasons why government spending hinders growth.
And here’s a video with some of the scholarly evidence.
P.S. The CBO study also points out that financing new spending with a value-added tax wouldn’t avert economic damage.
…by reducing the cost of time spent not working for pay relative to other goods, a consumption tax could reduce hours worked through a channel like that of a tax on labor.
And most of the people who have written about the report also have focused – incorrectly – on the rising levels of debt.
That’s the bad news.
The good news is that the report also contains lots of data on the variables – the spending burden and the tax burden – that should command our attention.
Here are four visuals from the report. We’ll start with Figure 7, which shows what will happen to spending and taxes over the next three decades. I’ve highlighted in red the most important numbers.
The right-most column gives you the big picture. The main takeaway (and it’s been this way for a while) is that more than 100 percent of America’s long-run fiscal problem is driven by the fact that government spending (“total outlays”) will consume a much greater share of our economic output.
The top-left of Figure 7 shows the growth of entitlement programs (which captures the fiscal problems of Social Security, Medicare, and Medicaid).
So lot’s look at Figure 9, which presents the same data in a different way.
Why did I write above that government spending is responsible for “more than 100 percent of America’s long-run fiscal problem”?
Because, as depicted in Figure 11, there’s a built-in tax increase over the next three decades.
In other words, the fiscal mess in Washington is not the result of inadequate tax revenue.
Last but not least, Figure 13 is worth sharing because it shows how small differences in some variables can make a big difference over time. I’m especially interested in the top chart, which shows how slight differences in productivity (which determines the all-important variable of per-capita growth) have a big impact on long-run debt.
It would be preferable, of course, if the CBO report showed how greater productivity impacts both revenue and spending. We would see that faster growth generates more tax revenue (without raising tax rates) and reduces spending (people with good jobs are less likely to be dependent on government redistribution programs).
P.S. Yes, government debt matters. It matters in the short run because it’s a measure of how much private saving is being diverted to finance government. And it matters in the long run because excessive red ink can trigger a fiscal crisis when investors decide that a government no longer can be trusted to pay back lenders (see Greece, for instance). But we should never forget that it is excessive spending that drives the debt. Cure the disease of excessive spending and it is all but certain that you eliminate the symptom of red ink.
P.P.S. For what it’s worth, the United States is not Greece. At least not yet.
Almost everybody has focused on CBO’s projections for record levels of red ink. And it is worrisome that debt is heading to Greek/Japanese levels (especially if the folks who buy government bonds think American politicians are more like Greek politicians rather than Japanese politicians).
But what should really have us worried, both in the short run and the long run, is that the burden of government spending is on an upward trajectory.
CBO has some charts showing that federal government spending will consume more than 30 percent of GDP by 2050, assuming the budget is left on autopilot.
But I dug into CBO’s database and created my own chart because I think it does a much better job of illustrating our problem.
As you can see, the problem is that government spending is projected to grow too fast, violating the Golden Rule of fiscal policy.
And if we control the growth of spending (preferably so that it grows no more than the rate of inflation), the projections for ever-rising levels of red ink will disappear.
In other words, you can get rid of symptoms (red ink) when you cure the underlying disease (big government).
P.S. Given all the profligacy over the past year, you won’t be surprised to learn that this year’s long-run forecast from CBO is more depressing than last year’s forecast.
P.P.S. While the solution is simple, it’s not easy. Restraining the growth of spending – especially in the long run – will require entitlement reforms, especially for Medicare and Medicaid.
When the Congressional Budget Office released its Budget and Economic Outlook yesterday, almost everyone in Washington foolishly fixated on the estimate of $1 trillion-plus annual deficits.
What’s far more important – and much more worrisome – is that the burden of government spending is projected to relentlessly increase, violating the Golden Rule of fiscal policy.
More specifically, the federal budget currently is consuming 21 percent of gross domestic product, but will consume 23.4 percent of economic output in 2030 if fiscal policy is left on autopilot.
Here is a chart, based on CBO’s new data, that shows why we should be very concerned.
We’re in trouble today because government has been growing too fast, and we’ll be in bigger trouble in the future for the same reason.
But the situation is not hopeless. The problem can be fixed with some long-overdue and much-needed spending restraint.
We don’t even need to cut spending, though that would be very desirable.
As this next chart illustrates, our budgetary problems can be solved if there’s some sort of spending cap.
The grey line shows the current projection for federal spending and the orange line shows how much tax revenue Washington expects to collect (assuming the Trump tax cut is made permanent). There’s a big gap between those two lines (the $1 trillion-plus deficits everyone else is worried about).
My contribution to the discussion is to show we can have a budget surplus by 2028 if spending only grows by 1 percent annually and we can balance the budget by 2030 if spending grows by 1.7 percent per year.
Needless to say, I’m not fixated on balancing the budget and eliminating red ink.
The real goal is to change budgetary trend lines with a spending cap so that the fiscal burden of government begins to shrink as a share of the nation’s economy.
The bottom line is that modest spending restraint (government growing at 1.7 percent annually, nearly as fast as projected inflation) would slowly but surely achieve that goal by gradually reversing the big-government policies of Bush, Obama, and Trump.
What really matters are the trends for both taxes and spending.
Here are the three things that you need to know.
First, America’s tax burden is increasing. Immediately below are two charts. The first one shows that revenues will consume an addition three percentage points of GDP over the next three decades. As I’ve repeatedly pointed out, our long-run problem is not caused by inadequate revenue.
The second of the two charts shows that most of the increase is due to “real bracket creep,” which is what happens when people earn more income and wind up having to pay higher tax rates.
So even if Congress extends the “Cadillac tax” on health premiums and extends all the temporary provisions of the 2017 Tax Act, the aggregate tax burden will increase.
Second, the spending burden is growing even faster than the tax burden.
And if you look closely at the top section of Figure 1-7, you’ll see that the big problems are the entitlements for health care (i.e., Medicare, Medicaid, and Obamacare).
By the way, the lower section of Figure 1-7 shows that corporate tax revenues are projected to average about 1.3 percent of GDP, which is not that much lower than what CBO projected (about 1.7 percent of GDP) before the rate was reduced by 40 percent.
I’m going to show that it’s actually rather simple to balance the budget with modest spending restraint.
This statement shocks many people because they’ve read about out-of-control entitlement spending, pork-filled appropriations bills, big tax cuts, and trillion-dollar deficits.
But the first thing to understand when contemplating how to fix America’s fiscal problems is that tax revenues, according to the new CBO numbers, are going to increase by an average of nearly 5 percent annually over the next 10 years. And that means receipts will be more than $2.1 trillion higher in 2029 than they are in 2019.
And since this year’s deficit is projected to be “only” $897 billion, that presumably means that it shouldn’t be that difficult to balance the budget.
By the way, I don’t even think balance should be the goal. It’s far more important to focus on reducing the burden of government spending. After all, the economy is adversely affected if wasteful outlays are financed by taxes, just as the economy is hurt when wasteful outlays are financed by borrowing.
In other words, too much government spending is the disease. Deficits are best understood as a symptom of the disease.
But I’m digressing. The point for today is simply that the symptom of borrowing can be addressed if a good chunk of that additional $2.1 trillion of new revenue is used to get rid of the $897 billion of red ink.
Unfortunately, the CBO report projects that the burden of government spending also is on an upward trajectory. As you can see from our next chart, outlays will jump by about $2.6 trillion by 2029 if the budget is left on autopilot.
The solution to this problem is very straightforward.
All that’s needed is a bit of spending restraint to put the budget on a glide path to balance.
I’m a big fan of spending caps, so this next chart shows the 10-year fiscal outlook if annual spending increases are limited to 1% growth, 2% growth, or 2.5% growth.
As you can see, modest spending discipline is a very good recipe for fiscal balance.
Our final chart adds a bit of commentary to illustrate how quickly we could move from deficit to surplus based on different spending trajectories.
The numbers are different today, but the analysis hasn’t changed.
As I noted at the end of the video, balancing the budget with spending restraint may be simple, but it won’t be easy.
If we want spending to grow, say, 2% annually rather than 5% annually, that will require some degree of genuine entitlement reform. And it means finally enforcing some limits on annual appropriations.
Back in 2015, I basically applauded the Congressional Budget Office for its analysis of what would happen if Obamacare was repealed. The agency’s number crunchers didn’t get it exactly right, but they actually took important steps and produced numbers showing how the law was hurting taxpayers and the economy.
Now we have a new set of Obamacare numbers from CBO based on the partial repeal bill approved by the House of Representatives. The good news is that the bureaucrats show substantial fiscal benefits. There would be a significant reduction in the burden of spending and taxation.
But the CBO did not show very favorable numbers in other areas, most notably when it said that 23 million additional people would be uninsured if the legislation was enacted.
Part of the problem is that Republicans aren’t actually repealing Obamacare. Many of the regulations that drive up the cost of health insurance are left in place.
My colleague at Cato, Michael Cannon, explains why this is a big mistake.
Rather than do what their supporters sent them to Washington to do – repeal ObamaCare and replace it with free-market reforms – House Republicans are pushing a bill that will increase health-insurance premiums, make health insurance worse for the sick… ObamaCare’s core provisions are the “community rating” price controls and other regulations that (supposedly) end discrimination against patients with preexisting conditions. …Community rating is the reason former president Bill Clinton called ObamaCare “the craziest thing in the world” where Americans “wind up with their premiums doubled and their coverage cut in half.” Community rating is why women age 55 to 64 have seen the highest premium increases under ObamaCare. It is the principal reason ObamaCare has caused overall premiums to double in just four years. Community rating literally penalizes quality coverage for the sick… ObamaCare is community rating. The AHCA does not repeal community rating. Therefore, the AHCA does not repeal ObamaCare.
It would be ideal if Republicans fully repealed Obamacare.
But maybe that’s hoping for too much since many Republicans are squeamish about supporting even a watered-down proposal to modify Obamacare.
That being said, there are some reasonable complaints that CBO overstated the impact of the GOP bill.
Doug Badger and Grace Marie Turner, for instance, were not impressed by CBO’s methodology.
The Congressional Budget Office (CBO) launched its latest mistaken Obamacare-related estimate this week, predicting that a House-passed bill to repeal and replace the embattled law would lead to 23 million more uninsured people by 2026. …the agency’s errors are not only massive – one of their predictions of 2016 exchange-based enrollment missed by 140%… Undaunted by failure and unschooled by experience, CBO soldiers on, fearlessly predicting that millions will flock to the exchanges any day now. …CBO measures the House-passed bill against this imaginary baseline and finds it wanting. …One reason CBO gets it so wrong so consistently is its fervent belief that the individual mandate has motivated millions to enroll in coverage. …CBO’s belief in the power of the individual mandate is misplaced. …The IRS reports that in the 2015 tax year, 6.5 million uninsured filers paid the tax penalty, 12.7 million got an exemption and additional 4.2 million people simply ignored the penalty. They left line 61 on their form 1040 blank, refusing to tell the government whether or not they had insurance. …In all, that is a total of 23.4 million uninsured people – out of an estimated 28.8 million uninsured – who either paid, avoided or ignored the penalty. That hardly suggests that the mandate has worked.
The Wall Street Journal also was quite critical of the CBO analysis.
…the budget scorekeepers claim the House bill could degrade the quality of insurance. This editorializing could use some scrutiny. Without government supervision of insurance minutiae and a mandate to buy coverage or pay a penalty, CBO asserts, “a few million” people will turn to insurance that falls short of the “widely accepted definition” of “a comprehensive major medical policy.” They might select certain forms of coverage that Obama Care banned, like “mini-med” plans with low costs and low benefits. Or they might select indemnity plans that pay a fixed-dollar amount per day for illness or hospitalization, or dental-only or vision-only single-service plans. CBO decided to classify these people as “uninsured,” though without identifying who accepts ObamaCare’s definition of standardized health benefits and why they deserve to substitute their judgment for the choices of individual consumers. …But the strangest part of CBO’s preoccupation with “high-cost medical events” is that the analysts never once mention catastrophic coverage—not once. These types of plans didn’t cover routine medical expenses but they did protect consumers against, well, a high-cost medical event like an accident or the diagnosis of a serious illness. Those plans answered what most people want most out of insurance—financial security and a guarantee that they won’t be bankrupted by cancer or a distracted bus driver. …under the House reform Americans won’t have any problem insuring against a bad health event, even if CBO won’t admit it. …CBO has become a fear factory because it prefers having government decide for everybody.
Drawing on his first-hand knowledge, Dr. Marc Siegel wrote on the issue for Fox News.
…23 million…will lose their health insurance by 2026 if the American Health Care Act, the bill the House passed to replace ObamaCare, is passed in the Senate and signed by President Trump. This number is concerning — until you look at it and the CBO’s handling of the health care bills more closely. …First, the CBO was wildly inaccurate when it came to ObamaCare, predicting that 23 million people would be getting policies via the exchanges by 2016. The actual number ended up being only 10.4 million… Second, many who chose to buy insurance on the exchanges did so only because they wanted to avoid paying the penalty, not because they needed or wanted the insurance. Many didn’t buy insurance until they got sick.
IN the real world, people who don’t have insurance coverage cannot lose it. Yet…the CBO estimates 14 million fewer people will have coverage in 2018 if the House bill is enacted than would be the case if the ACA is left intact, and 23 million fewer by 2026. …In 2016, there were roughly 10 million people obtaining insurance through an Obamacare exchange. The CBO estimated that number would suddenly surge to 18 million by 2018 if the law was left intact, but that far fewer people would be covered if the House reforms became law. Put simply, the CBO estimated that millions of people who don’t have insurance through an exchange today would “lose” coverage they would otherwise obtain next year. That’s doubtful. …At one point, the office estimated 22 million people would receive insurance through an Obamacare exchange by 2016. As already noted, the actual figure was less than half that. One major reason for the CBO being so far off the mark is that federal forecasters believed Obamacare’s individual mandate would cause people to buy insurance, regardless of cost. That hasn’t proven true. …In a nutshell, the CBO predicts reform would cause millions to lose coverage they don’t now have, and that millions more would eagerly reject the coverage they do have because it’s such a bad deal. Those aren’t conclusions that bolster the case for Obamacare.
CBO says 14 million fewer people on net would be insured in 2018 relative to the ObamaCare status quo, rising to 23 million in 2026. The political left has defined this as “losing coverage.” But 14 million would roll off Medicaid as the program shifted to block grants, which is a mere 17% drop in enrollment after the ObamaCare expansion. The safety net would work better if it prioritized the poor and disabled with a somewhat lower number of able-bodied, working-age adults. The balance of beneficiaries “losing coverage” would not enroll in insurance, CBO says, “because the penalty for not having insurance would be eliminated.” In other words, without the threat of government to buy insurance or else pay a penalty, some people will conclude that ObamaCare coverage isn’t worth the price even with subsidies. …CBO’s projections about ObamaCare enrollment…were consistently too high and discredited by reality year after year. CBO is also generally wrong in the opposite direction about market-based reforms, such as the 2003 Medicare drug benefit whose costs the CBO badly overestimated.
Here are excerpts from Seth Chandler’s Forbescolumn.
My complaints about the CBO largely revolve around its dogged refusal to adjust its computations to the ever-more-apparent failings of the Affordable Care Act. When the CBO says that 23 million fewer people will have insurance coverage under the AHCA than under the ACA — a statistic that politics have converted into a mantra — that figure is predicated on an ACA that no longer exists. It is based on the continuing assumption that the ACA will have 18 million people enrolled on its exchanges in 2018 and that this situation will persist until 2026. I know no one on any side of the political spectrum who believes this to be true. The ACA has about 11 million people currently enrolled on its exchanges in 2017 and, with premiums going up, some insurers withdrawing from various markets, and the executive branch fuzzing up whether the individual mandate will actually be enforced. The consensus is that ACA enrollment will stay the same or go down, not increase 60%.
And here’s some of what Drew Gonshorowski wrote for the Daily Signal.
…reducing premium levels by rolling back regulations could actually have the effect of making plans more desirable for individuals looking to pay less. The CBO lacks any real discussion of these positive effects. …The CBO’s score on Medicaid…reflects that it assumes more states would likely have expanded in the future under the Affordable Care Act. Thus, its projection that 14 million fewer people would be insured due to not having Medicaid under the American Health Care Act might be overstated… CBO…assumes the Affordable Care Act will enroll 7 to 8 million more people in the individual market, when in reality it does not appear this will be the case
Last but not least, my former colleague Robert Moffit expressed concerns in a column for USA Today. The part that caught my eye was that CBO has a less-than-stellar track record on Obamacare projections.
The GOP should be skeptical of CBO’s coverage estimates. It has been an abysmal performance. For example, CBO projected initially that 21 million persons would enroll in exchange plans in 2016. The actual enrollment: 11.5 million.
The bottom line is that CBO overstated the benefits of Obamacare, at least as measured by the number of people who would sign up for the program.
The bureaucrats were way off.
Yet CBO continues to use those inaccurate numbers, creating a make-believe baseline that is then used to estimate a large number of uninsured people if the Republican bill is enacted.
P.S. You may be wondering why Republicans don’t fully repeal Obamacare so that they can get credit for falling premiums. Part of the problem is that they are using “reconciliation” legislation that supposedly is limited to fiscal matters. In other words, you can’t repeal red tape and regulation. At least according to some observers. I think that’s silly since such interventions drive up the cost of health care, which obviously has an impact on the budget. Also, Republicans are a bit squeamish about reducing subsidies for various groups, whether explicit (like the Medicaid expansion) or implicit (like community rating). In other words, the Second Theorem of Government applies.
But I can’t help myself. I feel like I’m watching a surreal version of Titanic where the captain and crew know in advance that the ship will hit the iceberg, yet they’re still allowing passengers to board and still planning the same route. And in this dystopian version of the movie, the tickets actually warn the passengers that tragedy will strike, but most of them don’t bother to read the fine print because they are distracted by the promise of fancy buffets and free drinks.
We now have the book version of this grim movie. It’s called The 2017 Long-Term Budget Outlook and it was just released today by the Congressional Budget Office.
If you’re a fiscal policy wonk, it’s an exciting publication. If you’re a normal human being, it’s a turgid collection of depressing data.
But maybe, just maybe, the data is so depressing that both the electorate and politicians will wake up and realize something needs to change.
I’ve selected six charts and images from the new CBO report, all of which highlight America’s grim fiscal future.
The first chart simply shows where we are right now and where we will be in 30 years if policy is left on autopilot. The most important takeaway is that the burden of government spending is going to increase significantly.
Interestingly, even CBO openly acknowledges that rising levels of red ink are caused solely by the fact that spending is projected to increase faster than revenue.
And it’s also worth noting that revenues are going up, even without any additional tax increases.
The bottom part of this chart shows that revenues from the income tax will climb by about 2 percent of GDP. In other words, more than 100 percent of our long-run fiscal mess is due to higher levels of government spending. So it’s absurd to think the solution should involve higher taxes.
This next image digs into the details. We can see that the spending burden is rising because of Social Security and the health entitlements. By the way, the top middle column on “other noninterest spending” shows one thing that is real, which is that defense spending has fallen as a share of GDP since the mid-1960s, and one thing that may not be real, which is that politicians somehow will limit domestic discretionary spending over the next three decades.
This bottom left part of the image also gives the details on built-in growth in revenues from the income tax, further underscoring that we don’t have a problem of inadequate revenue.
Last but not least, here’s a graphic that shows the amount of fiscal policy changes that would be needed to either reduce or stabilize government debt.
We need to invoke my Golden Rule so that government grows slower than the private sector. In the long run, that will require genuine entitlement reform.
It’s not a big day for normal people, but today is exciting for fiscal policy wonks because the Congressional Budget Office has released its new 10-year forecast of how much revenue Uncle Sam will collect based on current law and how much the burden of government spending will expand if policy is left on auto-pilot.
Most observers will probably focus on the fact that budget deficits are projected to grow rapidly in future years, reaching $1 trillion in 2024.
But let’s temporarily set that issue aside because the really big news from the CBO report is that we have new evidence that it’s actually very simple to balance the budget without tax increases.
According to CBO’s new forecast, federal tax revenue is projected to grow by an average of 4.3 percent each year, which means receipts will jump from 3.28 trillion this year to $4.99 trillion in 2026.
And since federal spending this year is estimated to be $3.87 trillion, we can make some simple calculation about the amount of fiscal discipline needed to balance the budget.
A spending freeze would balance the budget by 2020. But for those who want to let government grow at 2 percent annually (equal to CBO’s projection for inflation), the budget is balanced by 2024.
So here’s the choice in front of the American people. Either allow spending to grow on autopilot, which would mean a return to trillion dollar-plus deficits within eight years. Or limit spending so it grows at the rate of inflation, which would balance the budget in eight years.
Seems like an obvious choice.
By the way, when I crunched the CBO numbers back in 2010, they showed that it would take 10 years to balance the budget if federal spending grew 2 percent per year.
So why, today, can we balance the budget faster if spending grows 2 percent annually?
Everything I said back then is still true, other than simply adjusting the numbers to reflect a new forecast.
The bottom line is that modest spending restraint is all that’s needed to balance the budget.
That being said, I can’t resist pointing out that eliminating the deficit should not be our primary goal. It’s not good to have red ink, to be sure, but the more important goal should be to reduce the burden of federal spending.
That’s why I keep promoting my Golden Rule. If government grows slower than the private sector, that means the burden of spending (measured as a share of GDP) will decline over time.
And it’s why I’m a monomaniacal advocate of spending caps rather than a conventional balanced budget amendment. If you directly address the underlying disease of excessive government, you’ll automatically eliminate the symptom of government borrowing.
Which is why I very much enjoy sharing this chart whenever I’m debating one of my statist friends. It shows all the nations that have enjoyed great success with multi-year periods of spending restraint.
During these periods of fiscal responsibility, the burden of government falls as a share of economic output and deficits also decline as a share of GDP.
I then ask my leftist pals to show a similar table of countries that have gotten good results by raising taxes.
As you can imagine, that’s when there’s an uncomfortable silence in the room, perhaps because the European evidence very clearly shows that higher taxes lead to bigger government and more red ink (I also get a response of silence when I issue my challenge for statists to identify a single success story of big government).
*Congress has reverted to (bad) form, voting last year to weaken spending caps.
The Congressional Budget Office has just released the 2016 version of its Long-Term Budget Outlook.
It’s filled with all sorts of interesting data if you’re a budget wonk (and a bit of sloppy analysis if you’re an economist).
If you’re a normal person and don’t want to wade through 118 pages, you’ll be happy to know I’ve taken on that task.
And I’ve grabbed the six most important images from the report.
First, and most important, we have a very important admission from CBO that the long-run issue of ever-rising red ink is completely the result of spending growing too fast. I’ve helpfully underlined that portion of Figure 1-2.
And if you want to know the underlying details, here’s Figure 1-4 from the report.
Once again, since I’m a thoughtful person, I’ve highlighted the most important portions. On the left side of Figure 1-4, you’ll see that the health entitlements are the main problem, growing so fast that they outpace even the rapid growth of income taxation. And on the right side, you’ll see confirmation that our fiscal challenge is the growing burden of federal spending, exacerbated by a rising tax burden.
And if you want more detail on health spending, Figure 3-3 confirms what every sensible person suspected, which is that Obamacare did not flatten the cost curve of health spending.
Medicare, Medicaid, Obamacare, and other government health entitlements are projected to consume ever-larger chunks of economic output.
Now let’s turn to the revenue side of the budget.
Figure 5-1 is important because it shows that the tax burden will automatically climb, even without any of the class-warfare tax hikes advocated by Hillary Clinton.
The bottom line is that we’re becoming more like Greece at a faster pace.
Last but not least, here’s a chart that underscores why our healthcare system is such a mess.
Figure 3-1 shows that consumers directly finance only 11 percent of their health care, which is rather compelling evidence that we have a massive government-created third-party payer problem in that sector of our economy.
Yes, this is primarily a healthcare issue, especially if you look at the economic consequences, but it’s also a fiscal issue since nearly half of all health spending is by the government.
The Congressional Budget Office has just released its new 10-year fiscal forecast and the numbers are getting worse.
Most people are focusing on the fact that the deficit is rising rather than falling and that annual government borrowing will again climb above $1 trillion by 2022.
Here’s a chart that shows what’s been happening. It shows the rolling average of annual changes in revenue and spending. With responsible fiscal policy, the red line (spending) will be close to 0% and have no upward trend.
Unfortunately, federal outlays have been moving in the wrong direction since 2014 and government spending is now growing twice as fast as inflation.
By the way, don’t forget that we’re at the very start of the looming tsunami of retiring baby boomers, so this should be the time when spending restraint is relatively easy.
Yet if you’ll allow me to mix metaphors, bipartisan profligacy is digging a deeper hole as we get closer to an entitlement cliff.
Now let’s shift to the good news. It’s actually relatively simple to solve the problem.
Here’s a chart that shows projected revenues (blue line) and various measures of how quickly the budget can be balanced with a modest bit of spending restraint.
That being said, when you impose some restraint on the spending side of the fiscal ledger, you automatically solve the symptom of deficits.
With a spending freeze, the budget is balanced in 2020. If spending is allowed to climb 1 percent annually, the deficit disappears in 2022. And if outlays climb 2 percent annually (about the rate of inflation), the budget is balanced in 2024. And if you want to give the politicians a 10-year window, you get to balance by 2026 if spending is “only” allowed to grow 2.5 percent per year.
Here’s my video on spending restraint and fiscal balance from 2010. The numbers obviously have changed, but the message is still the same because good policy never goes out of style.
Needless to say, a simple solution isn’t the same as an easy solution. The various interest groups in Washington will team up with bureaucrats, politicians, and lobbyists to resist spending restraint.
P.S. A final snow update. Since my neighbors were kind enough to help me finish my driveway yesterday, I was inspired to “pay it forward” by helping to clear an older couple’s driveway this morning (not that I was much help since another neighbor brought a tractor with a plow).
It’s amazing that these good things happen without some government authority directing things!
The Bureaucrat Hall of Fame, created to highlight government workers who go above and beyond the call of duty, is apparently such a prestigious honor that there’s been a strong competition between Americans and foreigners to engage in behavior that merits this great award.
Consider the U.S. bureaucrats who have earned membership so far in 2015.
As I look at these 2015 honorees, I feel like the system is a bit unfair. Maybe it’s just me, but it appears that the foreign bureaucrats are more deserving than their American counterparts.
And I’m guessing that a senior-level bureaucrat at the Department of Veterans Affairs felt the same way. So he decided to take matters into his own hands.
Literally.
Here are some excerpts from a report in the Daily Caller.
…the Department of Veterans Affairs’ former top watchdog, resigned after being caught masturbating in the agency’s all-glass conference room in full view of people across the street, including school teachers at an education conference. …investigators confronted him with detailed instances of public masturbation in multiple states, according to a previously undisclosed report by the Department of the Interior inspector general and obtained by The Daily Caller News Foundation.
Obviously a very deserving member of the of the Bureaucrat Hall of Fame. And he’s definitely upped the ante on what it take to become a member.
For all intents and purposes, he’s thrown down the gauntlet to foreign bureaucrats: What can they do to…um…beat this?
But let’s set aside the U.S. vs. foreigners aspect of this issue and look more closely at our new honoree.
He apparently had lots of time on his hands (so to speak) because his office decided that it was okay for the Department to operate de facto death panels.
It was during Wooditch’s tenure as deputy inspector general that the VA IG first uncovered — then all but ignored — dozens of clues of the widespread patient wait-list manipulation that contributed to the deaths of dozens of veterans.
It’s also impressive that he got a promotion shortly after getting caught with porn on his computer.
He was caught with porn on his work computer in 2003, but VA officials only “counseled” him. Not long afterward, he was promoted to the top job.
Wooditch retired with a federal pension without ever facing administrative discipline or criminal charges.
Though I don’t want to think what he’ll be doing with all this extra time on his hands.
And here’s a final excerpt.
IG agents also learned during their investigation of a separate incident…they were told, he made an “inappropriate advance” on his next-door neighbor as she was grieving her husband’s death. …“…she said Wooditch began to pose nude and masturbate in front of a window that was only viewable from her house” repeatedly, the report said. The woman…did have police warn him to stop. Wooditch lectured the police that he was a “high-level government employee.”
P.S. Shifting to a different topic, I can’t resist an I-told-you-so moment.
There was a disagreement last year among advocates of smaller government about whether Doug Elmendorf, the then-Director of the Congressional Budget Office, should be replaced since Republicans were in full control of Capitol Hill.
Elmendorf’s predecessor was a doctrinaire leftist named Peter Orszag. If Orszag’s policy views were a country, they would beFranceorGreece. By contrast, I’m guessing that Elmendorf would be likeSwedenor Germany. In other words, he wants more government than I do, but at least Elmendorf basically understands that there’s no such thing as a free lunch. …That being said, while it’smuch better to be Sweden rather than Greece, I obviously would prefer to beHong Kong(or, even better,pre-1913 America).
The GOP leadership ultimately decided to replace Elmendorf.
Instead, I want to pat myself on the back for being right about Elmendorf. Now that he’s no longer at CBO, he’s come out of the closet and is openly pushing statist policies.
…the incomes of people across most of the income distribution have risen quite slowly, while incomes at the high end have risen rapidly. …There are a variety of ways to increase tax revenue for Social Security by imposing a payroll tax on income above the current-law taxable maximum. …this approach…does not offer a free lunch. …would reduce people’s incentives to work and save.
So the bottom line is that he recognizes his preferred policy (which is what Obama has endorsed) will hurt the economy, but his ideological support for redistribution and his myopic fixation on income distribution leads him to the wrong conclusion.
And here’s something else. The Hillreports he’s urging class-warfare tax policy.
Former Congressional Budget Office Director Doug Elmendorf on Thursday said the tax code should be changed so that the wealthy pay higher taxes…in a video released Thursday by the left-leaning Bookings Institution, where he is a visiting fellow.
I never watched That ’70s Show, but according to Wikipedia, the comedy program “addressed social issues of the 1970s.”
Assuming that’s true, they need a sequel that addresses economic issues of the 1970s. And the star of the program could be the Congressional Budget Office, a Capitol Hill bureaucracy that apparently still believes – notwithstanding all the evidence of recent decades – in the primitive Keynesian view that a larger burden of government spending is somehow good for economic growth and job creation.
I’ve previously written about CBO’s fairy-tale views on fiscal policy, but wondered whether a new GOP-appointed Director would make a difference. And I thought there were signs of progress in CBO’s recent analysis of the economic impact of Obamacare.
But the bureaucracy just released its estimates of what would happen if the spending caps in the Budget Control Act (BCA) were eviscerated to enable more federal spending. And CBO’s analysis was such a throwback to the 1970s that it should have been released by a guy in a leisure suit driving a Ford Pinto blaring disco music.
Here’s what the bureaucrats said would happen to spending if the BCA spending caps for 2016 and 2017 were eliminated.
According to CBO’s estimates, such an increase would raise total outlays above what is projected under current law by $53 billion in fiscal year 2016, $76 billion in fiscal year 2017, $30 billion in fiscal year 2018, and a cumulative $19 billion in later years.
And here’s CBO’s estimate of the economic impact of more Washington spending.
Over the course of calendar year 2016,…the spending changes would make real (inflation-adjusted) gross domestic product (GDP) 0.4 percent larger than projected under current law. They would also increase full-time-equivalent employment by 0.5 million. …the increase in federal spending would lead to more aggregate demand than under current law. …Over the course of calendar year 2017…CBO estimates that the spending changes would make real GDP 0.2 percent larger than projected under current law. They would also increase full-time-equivalent employment by 0.3 million.
Huh?
If Keynesian spending is so powerful and effective in theory, then why does it never work in reality? Itdidn’t work for Hoover and Rooseveltin the 1930s. It didn’t work for Nixon, Ford, and Carter in the 1970s. Itdidn’t work for Japanin the 1990s. And it hasn’t worked this century for either Bushor Obama. Or Russia and China.
And if Keynesianism is right, then why did the economy do better after the sequester when the Obama Administration said that automatic spending cuts would dampen growth?
To be fair, maybe CBO wasn’t actually embracing Keynesian primitivism. Perhaps the bureaucrats were simply making the point that there might be an adjustment period in the economy as labor and capital get reallocated to more productive uses.
I’m open to this type of analysis, as I wrote back in 2012.
…there are cases where the economy does hit a short-run speed bump when the public sector is pruned. Simply stated, there will be transitional costs when the burden of public spending is reduced. Only in economics textbooks is it possible to seamlessly and immediately reallocate resources.
But CBO doesn’t base its estimates on short-run readjustment costs. The references to “aggregate demand” show the bureaucracy’s work is based on unalloyed Keynesianism.
But only in the short run.
CBO’s anti-empirical faith in the magical powers of Keynesianism in the short run is matched by a knee-jerk belief that government borrowing is the main threat to the economy’s long-run performance.
…the resulting increases in federal deficits would, in the longer term, make the nation’s output and income lower than they would be otherwise.
Sigh. Red ink isn’t a good thing, but CBO is very misguided about the importance of deficits compared to other variables.
Remarkably, even international bureaucracies such as the World Bank and European Central Bank seem to understand that big government stifles prosperity. But I won’t hold my breath waiting for the 1970s-oriented CBO to catch up with 21st-century research.
I’m a long-time advocate of “dynamic scoring,” which means I want the Congressional Budget Office and Joint Committee on Taxation to inform policy makers about how fiscal policy changes can impact overall economic performance and therefore generate “feedback” effects.
I also think the traditional approach, known as “static scoring,” creates a bias for bigger government because it falsely implies that ever-higher tax rates and an ever-growing burden of government spending don’t have any adverse impact on prosperity.
There’s a famous example to show the lunacy of static scoring. Back in late 1980s, former Oregon Senator Bob Packwood asked the Joint Committee on Taxation to estimate the revenue impact of a 100 percent tax rate on income over $200,000.
When considering such a proposal, any normal person with even the tiniest amount of common sense is going to realize that successful people quickly will figure out it makes no sense to either earn or report income about that level. As such, the government won’t collect any additional revenue.
Heck, it’s not just that the government won’t collect additional revenue. Our normal person with a bit of common sense is going to take the analysis one step further and conclude that revenues will plunge, both because the government will lose the money it collected with the old income tax rates on income above $200,000 (i.e., the income that will disappear) and also because there will be all sorts of additional economic damage because of foregone work, saving, investment, and entrepreneurship.
But the JCT apparently didn’t have any bureaucrats with a shred of common sense. Because, as shown in Part II of my video series on the Laffer Curve, they predicted that such a tax would raise $104 billion in 1989, rising to $299 billion in 1993.
The good news is that both CBO and JCT are now seeking to incorporate some dynamic scoring into their fiscal estimates. Most recently, the CBO (with help from the JCT) released a report on the fiscal impact of repealing Obamacare.
Let’s look at what they did to see whether the bureaucrats did a good job.
I’ll start with something I don’t like. This new CBO estimate is fixated on the what will happen to deficit levels.
Here’s the main chart from the report. It compares what will happen to red ink if Obamacare is repealed, based on the static score (no macro feedback) and the dynamic score (with macro feedback).
There’s nothing wrong, per se, with this type of information. But making deficits the focus of the analysis is akin to thinking that the time of possession is more important than the final score in the Super Bowl.
What matters for more is what happens to the economy, which is affected by the size and structure of government. As such, here’s the most important finding from the report.
Repeal of the ACA would raise economic output…the resulting increase in GDP is projected to average about 0.7 percent over the 2021–2025 period.
There are two reasons the bureaucrats expect better economic performance if Obamacare is repealed. First, people will have more incentive to work because of a reduction in handouts.
CBO and JCT estimate that repealing the ACA would increase the supply of labor and thus increase aggregate compensation (wages, salaries, and fringe benefits) by an amount between 0.8 percent and 0.9 percent over the 2021–2025 period. …the subsidies and tax credits for health insurance that the ACA provides to some people are phased out as their income rises—creating an implicit tax on additional earnings—and those subsidies, along with expanded eligibility for Medicaid, generally make it easier for some people to work less or to stop working.
Second, the analysis also recognizes that there would be positive economic results from repealing the tax hikes in Obamacare, especially the ones that exacerbate the tax code’s bias against saving and investment.
Implementation of the ACA is also expected to shrink the capital stock, on net, over the next decade, so a repeal would increase the capital stock and output over that period. In particular, repealing the ACA would increase incentives for capital investment, both by increasing labor supply (which makes capital more productive) and by reducing tax rates on capital income. …repealing the ACA also would eliminate several taxes that reduce people’s incentives to save and invest—most notably the 3.8 percent tax on various forms of investment income for higher-income individuals and families. The resulting increase in the incentive to save and invest—relative to current law—thus would gradually boost the capital stock; consequently, output would be higher.
And here’s the most important table from the report. And it’s important for a reason that doesn’t get sufficient attention in the report, which is the fact that repeal of Obamacare will reduce the burden of spending and the burden of taxation. I’ve circled the relevant numbers in red.
Returning to something I touched on earlier, the CBO report gives inordinate attention to the fact that there’s a projected increase in red ink because the burden of spending doesn’t fall as much as the burden of taxation.
My grousing about CBO’s deficit fixation is not just cosmetic. To the extent that the report has bad analysis, it’s because of an assumption that the deficit tail wags the economic dog.
Here’s more of CBO’s analysis.
Although the macroeconomic feedback stemming from a repeal would continue to reduce deficits after 2025, the effects would shrink over time because the increase in government borrowing resulting from the larger budget deficits would reduce private investment and thus would partially offset the other positive effects that a repeal would have on economic growth. …CBO and JCT…estimate that repealing the act ultimately would increase federal deficits—even after accounting for other macroeconomic feedback. Larger deficits would leave less money for private investment (a process sometimes called crowding out), which reduces output. …The same macroeconomic effects that would generate budgetary feedback over the 2016–2025 period also would operate farther into the future. …the growing increases in federal deficits that are projected to occur if the ACA was repealed would increasingly crowd out private investment and boost interest rates. Both of those developments would reduce private investment and thus would dampen economic growth and revenues.
Some of this is reasonable, but I think CBO is very misguided about the importance of deficit effects compared to other variables.
To give you an idea of why CBO’s deficit fixation is wrong, consider the fact that its report got a glowing review from Vox’s Matt Yglesias. Matt, you may remember, recently endorsed a top tax rate of 90 percent, so if he believes A on fiscal policy, you can generally assume the right answer is B.
Here’s some of what he wrote.
Let us now praise Keith Hall. …his CBO appointment was bound up with a push by the GOP for more “dynamic scoring” of tax policy. …Yet today Hall’s CBO released its first big dynamic score of something controversial, and it’s … perfectly sensible.
Yes, parts of the report are sensible, as I wrote above.
But Matt thinks it’s sensible because it focuses on deficits, which allows his side to downplay the negative economic impact of Obamacare.
…the ACA makes it less terrible to be poor. By making it less terrible to be poor, the ACA reduces the incentive to do an extra hour or three at an unpleasant low-wage job in order to put a little more money in your pocket. CBO’s point is that when you do this, you shrink the overall size of GDP and thus the total amount of federal tax revenue. …The change…is big enough to matter economically (tens of billions of dollars a year are at stake) but not big enough to matter for the world of political talking points where the main question is does the deficit go up or down.
Yes, you read correctly. He’s celebrating the fact that people now have less incentive to be self-reliant.
P.S. On a totally different topic, it’s time to brag about America having better policy than Germany. At least with regard to tank ownership.
I’ve previously written about legal tank ownership in the United States. But according to a BBCreport, Germans apparently don’t have this important freedom.
The Panther tank was removed from the 78-year-old’s house in the town of Heikendorf, along with a variety of other military equipment, including a torpedo and an anti-aircraft gun, Der Tagesspiegel website reports. …the army had to be called in with modern-day tanks to haul the Panther from its cellar. It took about 20 soldiers almost nine hours to extract the tank… It seems the tank’s presence wasn’t much of a secret locally. Several German media reports mention that residents had seen the man driving it around town about 30 years ago. “He was chugging around in it during the snow catastrophe in 1978,” Mayor Alexander Orth was quoted as saying.
You know what they say: If you outlaw tanks, only outlaws will have tanks.
I’m also impressed the guy had an anti-aircraft gun. The very latest is self defense!
And a torpedo as well. Criminals would have faced resistance from the land, air, and sea.
If nothing else, he must have a big house.
One that bad guys probably avoided, at least if they passed the famous IQ test for criminals and liberals.
Last September, I wrote about some very disturbing 10-year projections that showed a rising burden of government spending.
Those numbers were rather depressing, but a recently released long-term forecast from the Congressional Budget Office make the 10-year numbers look benign by comparison.
The new report is overly focused on the symptom of deficits and debt rather than the underlying disease of excessive government. But if you dig into the details, you can find the numbers that really matter. Here’s some of what CBO reported about government spending in its forecast.
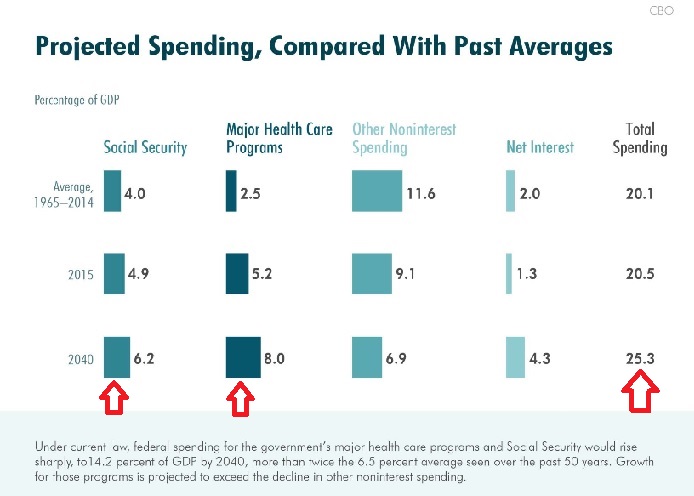
The long-term outlook for the federal budget has worsened dramatically over the past several years, in the wake of the 2007–2009 recession and slow recovery. …If current law remained generally unchanged…, federal spending rises from 20.5 percent of GDP this year to 25.3 percent of GDP by 2040.
…spending for Social Security and the government’s major health care programs—Medicare, Medicaid, the Children’s Health Insurance Program, and subsidies for health insurance purchased through the exchanges created by the Affordable Care Act—would rise sharply, to 14.2 percent of GDP by 2040, if current law remained generally unchanged. That percentage would be more than twice the 6.5 percent average seen over the past 50 years.
By the way, while it’s bad news that the overall burden of federal spending is expected to rise to more than 25 percent of GDP by 2040, I worry that the real number will be worse.
After all, the forecast assumes that other spending will drop by 2.2 percent of GDP between 2015 and 2040. Yet is it really realistic to think that politicians won’t increase – much less hold steady – the amount that’s being spent on non-health welfare programs and discretionary programs?
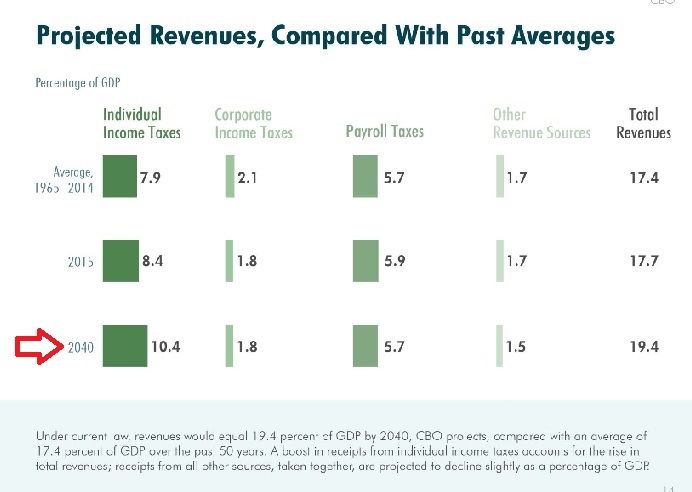
Another key takeaway from the report is that it is preposterous to argue (like Obama’s former economic adviser) that our long-run fiscal problems are caused by inadequate tax revenue.
Indeed, tax revenues are projected to rise significantly over the next 25 years.
Federal revenues would also increase relative to GDP under current law… Revenues would equal 19.4 percent of GDP by 2040, CBO projects, which would be higher than the 50-year average of 17.4 percent.
Here’s another slide from the CBO. I’ve added a red arrow to show that the increase in taxation is due to a climbing income tax burden.
These CBO numbers are grim, but they could be considered the “rosy scenario.”
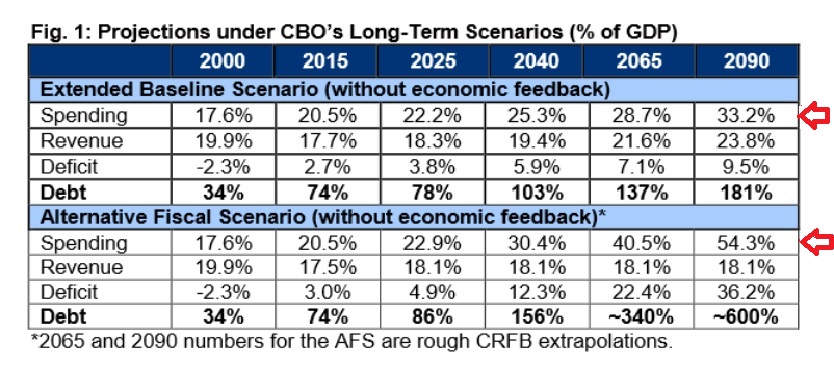
The Committee for a Responsible Federal Budget (CRFB) produced their own analysis of the long-run fiscal outlook.
Like the CBO, CRFB is too fixated on deficits and debt, but their report does have some additional projections of government spending.
Here’s the key table from the CRFB report. Not only do they show the CBO numbers for 2065 and 2090 under the baseline scenario, they also pull out CBO’s “alternative fiscal scenario” projections, which are based on more pessimistic (some would say more realistic) assumptions.
As you can see from my red arrows, federal spending will consume one-third of our economy’s output based on the “extended baseline scenario” as we get close to the end of the century. So if you add state and local spending to the mix, the overall burden of spending will be higher than it is in Greece today.
But if you really want to get depressed, look at the “alternative fiscal scenario.” The burden of federal spending soars to more than 50 percent of output. So when you add state and local government spending, the overall burden would be higher than what currently exists in any of Europe’s welfare states.
In other words, America is destined to become Greece.
Unless, of course, politicians can be convinced to follow my Golden Rule and exercise some much-needed spending restraint.
This would require genuine entitlement reform and discipline in other parts of the budget, steps that would not be popular from the perspective of Washington insiders.
Which is why we need some sort of external tool that mandates spending restraint, such as an American version of Switzerland’s Debt Brake (which you can learn more about by watching a presentation from a representative of the Swiss Embassy).
Heck, even the IMF agrees that spending caps are the only feasible solution.
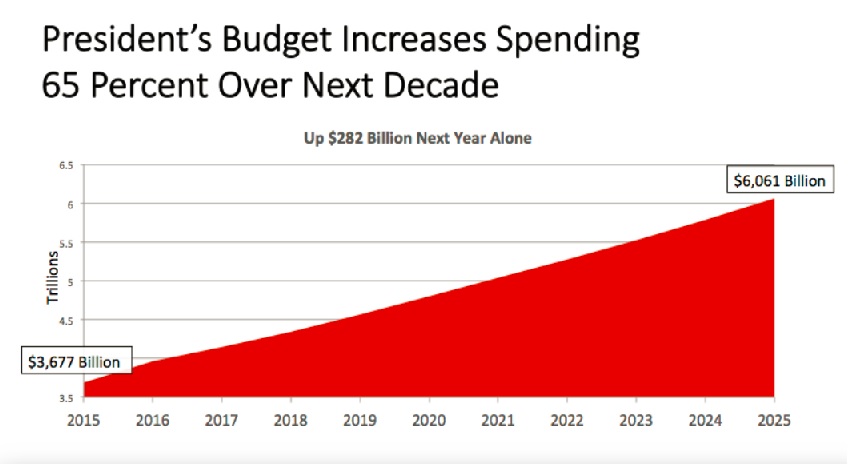
Earlier this year, President Obama proposed a budget that would impose new taxes and add a couple of trillion dollars to the burden of government spending over the next 10 years.
The Republican Chairmen of the House and Senate Budget Committees have now weighed in. You can read the details of the House proposal by clicking here and the Senate proposal by clicking here, but the two plans are broadly similar (though the Senate is a bit vaguer on how to implement spending restraint, as I wrote a couple of days ago).
So are any of these plans good, or at least acceptable? Do any of them satisfy my Golden Rule?
Here’s a chart showing what will happen to spending over the next 10 years, based on the House and Senate GOP plans, as well as the budget proposed by President Obama.
Keep in mind, as you look at these numbers, that economy is projected to expand, in nominal terms, by an average of about 4.3 percent annually.
The most relevant data is that the Republican Chairmen want spending to climb by about $1.4 trillion over the next decade (annual spending increases averaging about 3.3 percent per year), while Obama wants spending to jump by about $2.4 trillion over the same period (with annual spending climbing by an average of almost 5.1 percent per year).
At this point, some of you may be wondering how to reconcile this data with news stories you may have read about GOP budgets that supposedly include multi-trillion spending cuts?!?
The very fist sentence in a report from The Hill, for instance, asserted that the Senate budget would “cut spending by $5.1 trillion.” And USA Today had a story headlined, “House GOP budget cuts $5.5 trillion in spending.”
But these histrionic claims are based on dishonest math. The “cuts” only exist if you compare the GOP budget numbers to the “baseline,” which is basically an artificial estimate of how fast spending would grow if government was left on auto-pilot.
Which is sort of like a cad telling his wife that he reduced his misbehavior because he only added 4 new mistresses to his collection rather than the 5 that he wanted.
I explained this biased and deceptive budgetary scam in theseJohn Stossel andJudge Napolitanointerviews, and also nailed the New York Times for using this dishonest approach when reporting about sequestration.
Interestingly, the Senate plan tries to compensate for this budgetary bias by including a couple of charts that properly put the focus on year-to-year spending changes.
Here’s their chart on Obama’s profligate budget plan.
And here’s their chart looking at what happens to major spending categories based on the reforms in the Senate budget proposal.
So kudos to Chairman Enzi and his team for correctly trying to focus the discussion where it belongs.
By the way, in addition to a better use of rhetoric, the Senate GOP plan actually is more fiscally responsible than the House plan. Under Senator Enzi’s proposal, government spending would increase by an average of 3.25 percent per year over the next 10 years, which is better than Chairman Price’s plan, which would allow government spending to rise by an average of 3.36 percent annually.
Though both Chairman deserve applause for having more spending restraint than there was in the last two Ryan budgets.
But this doesn’t mean I’m entirely happy with the Republican fiscal plans.
Even though the two proposals satisfy my Golden Rule, that’s simply a minimum threshold. In reality, there’s far too much spending in both plans, and neither Chairman proposes to get rid of a single Department. Not HUD, not Education, not Transportation, and not Agriculture.
But the one thing that got me the most agitated is that the House and Senate proposals both indirectly embrace very bad economic analysis by the Congressional Budget Office.
Here’s some language that was included with the House plan (the Senate proposal has similar verbiage).
CBO’s analysis…estimates that reducing budget deficits, thereby bending the curve on debt levels, would be a net positive for economic growth. …The analysis concludes that deficit reduction creates long-term economic benefits because it increases the pool of national savings and boosts investment, thereby raising economic growth and job creation.
But here’s the giant problem. The CBO would say – and has said – the same thing about budget plans with giant tax increases.
To elaborate, CBO has a very bizarre view of how fiscal policy impacts the economy. The bureaucrats think that deficits are very important for long-run economic performance, while also believing that the overall burden of government spending and the punitive structure of the tax code are relatively unimportant.
And this leads them to make bizarre claims about tax increases being good for growth.
Moreover, the bureaucrats not only think deficits are the dominant driver of long-run growth, they also use Keynesian analysis when measuring the impact of fiscal policy on short-run growth. Just in case you think I’m exaggerating, or somehow mischaracterizing CBO’s position, check out page 12 of the Senate GOP plan and page 37 of the House GOP plan. You’ll see the “macroeconomic” effects of the plans cause higher deficits in 2016 and 2017, based on the silly theory that lower levels of government spending will harm short-run growth.
So hopefully you can understand why GOPers, for the sake of intellectual credibility, should not be citing bad analysis from the CBO.
But even more important, they should stop CBO from producing bad analysis is the future. The Republicans did recently replace a Democrat-appointed CBO Director, so it will be interesting to see whether their new appointee has a better understanding of how fiscal policy works.
I’ve written several times about the importance of appointing sensible people to head the Congressional Budget Office (CBO) and Joint Committee on Taxation (JCT). Heck, making reforms to these Capitol Hill bureaucracies is a basic competency test for Republicans.
That’s because CBO and JCT are the official scorekeepers when politicians consider changes in fiscal policy and it has a big (and bad) impact if they rely on outdated methods and bad analysis.
The JCT, by contrast, prepares estimates of what will happen to revenue if politicians make various changes in tax policy. Sounds like a simple task, but what if the bureaucrats make the ridiculous assumption that tax policy has no measurable impact on jobs, growth, or competitiveness, which leads to the preposterous conclusion that you maximize revenue with 100 percent tax rates?
Writing for Investor’s Business Daily, former Treasury Department officials Ernie Christian and Gary Robbins explain why the controversy over these topics – sometimes referred to as “static scoring” vs “dynamic scoring” – is so important.
It is Economics 101 that many federal taxes, regulations and spending programs create powerful incentives for people not to work, save, invest or otherwise efficiently perform the functions essential to their own well-being. These government-induced changes in behavior set off a chain reaction of macroeconomic effects that impair GDP growth, kill jobs, lower incomes and restrict upward mobility, especially among lower- and middle-income families. …Such measurements are de rigueur among credible academic and private-sector researchers who seek to determine the true size of the tax and regulatory burden on the economy and the true value of government spending, taking into account the economic damage it often causes.
And what’s amazing is that the official scorekeepers in Washington are the ones who refuse to recognize the real-world impact of changes in government policy.
These indirect costs of government, in particular or in total, have not been calculated and disclosed in the Budget of the United States or in analyses by the Congressional Budget Office. The result of this deliberate omission by Washington has been to understate many costs of government, often by more than 100%, and grossly overstate its benefits. …It is on this foundation of disinformation that the highly disrespected, overly expensive and too often destructive federal government in Washington has been built.
Christian and Robbins look specifically at the direct and indirect costs of the income tax.
The income tax is a two-part tax, one acknowledged and one deliberately concealed. First, almost $2 trillion of income tax is collected by the IRS for government to spend for presumably beneficial purposes. Then there is the tax-induced economic damage, a stealth tax, indirectly picked from people’s pockets in the form of fewer jobs and lower incomes. This stealth tax is $3.2 trillion each year. …economists often refer to the stealth tax as a deadweight loss. …When the $2 trillion of income tax taken directly out of the economy by the IRS is added to the $3.2 trillion of indirect economic cost, the total private-sector cost of the income tax is $5.2 trillion — and the government has only $2 trillion of income tax revenues to spend in trying to repair the damage.
By the way, I must disagree with the last part of this excerpt.
Let’s now get back to the part of the editorial that I like. Ernie and Gary make the very important point that some taxes do more damage than others.
…when the IRS collects a dollar of income tax from corporations, the damage to the overall economy is about $4. Similarly, a dollar of tax on capital gains sets off a ripple effect that does about $6 of damage. Poison pills such as capitalizing (instead of expensing) the job-creating cost of machinery and equipment, taxing dividends, double-taxing personal saving and imposing high tax rates result in stealth taxes ranging from $3 to $8 per dollar of revenues. …Low tax rates do less damage to economic growth per dollar of revenues raised and are preferable to high tax rates, which have the opposite effect.
Here’s a chart based on their analysis.
I’m not overly fixated on their specific estimates. Even good economists, after all, have a hard time making accurate forecasts and correctly isolating the impact of discrete policies on overall economic performance. Moreover, it’s very difficult to factor in the economic impact of America’s tax-haven policies for foreign investors, which help offset the damage of high tax burdens on American citizens.
But Christian and Robbins are completely correct about certain taxes doing more damage than other taxes.
And the less fortunate are particularly disadvantaged when bad methodology at CBO and JCT perpetuates bad policy.
…it is self-defeating and harmful to require that tax reforms always be revenue neutral in a near-term static sense. Imagine a tax reform that initially costs the IRS $1. Through economic growth, it promptly increases taxable income and well-offness by $2.50. At an average tax rate of 20%, the reform-induced $2.50 increase in taxable income at the outset recoups only 50 cents of the initial $1 cost to the IRS, thereby leaving the IRS 50 cents short in the near term. But who in the White House or Congress would refuse to make mostly lower and middle-income families $2.50 better off at a cost of only 50 cents to Washington’s already overflowing coffers?
The final sentence of the excerpt hits the nail on the head.
I’ve previously cited academic research and expert analysis to show that it is pointlessly punitive to raise tax rates if the damage to the private sector is several times greater than the additional revenue collected by government.
Yet there are plenty of examples of this type of short-sighted analysis, such as Obama’s proposal to expand the Social Security payroll tax (see the 6:43-7:41 section of this video)
Since I’ve accused the Congressional Budget Office of “witch doctor economics and gypsy forecasting,” it’s obvious I’m not a big fan of the organization’s approach to fiscal analysis.
I’ve even argued that Republicans shouldn’t cite CBO when the bureaucrats reach correct conclusions on policy (at least when such findings are based on bad Keynesian methodology).
So nobody should be surprised that I think the incoming Republican majority should install new leadership at CBO (and the Joint Committee on Taxation as well).
So why, then, are some advocates of smaller government – such as Greg Mankiw, Keith Hennessey, Alan Viard, and Michael Strain – arguing that Republicans should keep the current Director, Doug Elmendorf, who was appointed by the Democrats back in 2009?
Before answering that question, let’s look at some of what was written today for the Washington Post’s Wonkblog.
After a series of highly-regarded conservativesvoiced their support for Doug Elmendorf, the director of the Congressional Budget Office whose term is up in January, Elmendorf haters fired back on Friday, urging Republicans to jettison the Democratic appointee as soon as possible. …This argument isadvancedmost forcefully in an open letter to GOP congressional leaders by Grover Norquist of Americans for Tax Reform, who…is most famous as the author of theanti-tax pledge that binds virtually every Republican in Congress never to vote to raise taxes. So why is Norquist against Elmendorf? For one thing, because CBO, under Elmendorf, has not demonized higher taxes. Instead, the agency promotes a “Failed Keynesian Economic Analysis,” Norquist says, that asserts that “higher taxes are good for the economy, even to the point of implying that growth is maximized when tax rates are 100 percent.”
And where did Grover get the idea that CBO believes that ever-higher taxes lead to more growth?
As evidence,Norquist points to a2010 postby the Cato Institute’s Dan Mitchell, titled “Congressional Budget Office Says We Can Maximize Long-Run Economic Output with 100 Percent Tax Rates.” “I hope the title of this post is an exaggeration,” Mitchell writes, “but it’s certainly a logical conclusion based on” CBO’s claim that paying down the national debt — regardless of whether it’s through higher taxes or lower government spending — would be a good thing for the economy. “There’s nothing necessarily wrong with CBO’s concern about deficits,” Mitchell goes on. But “what’s missing from CBO’s analysis is any recognition or understanding that the real problem is excessive government spending.” In other words, what’s missing is conservative ideology about fiscal policy.
I have two reactions, one minor and one major.
My minor point is that the author of the piece is supposed to be a neutral, even-handed reporter, yet she refers to opponents of Elmendorf as “haters” and she implies that we’re simply upset because CBO’s analysis is missing “conservative ideology about fiscal policy.” Given that she was writing for Wonkblog, which is more akin to an editorial page, there’s nothing wrong with being opinionated. But ask yourself whether someone with such hostility can be impartial when doing straight news stories.
My major point is about policy. Why is my concern about the size of government characterized as “ideology” while we’re supposed to believe CBO’s analysis is “scrupulously impartial” even though it produced analysis which implies you maximize growth with 100 percent tax rates?!?
If my views are blind ideology, then why is there research showing the economic damage of excessive government from international bureaucracies such as the World Bank and European Central Bank? And why are there studies about the harmful economic impact of government spending from the International Monetary Fund and the Organization for Economic Cooperation and Development? Nobody has ever accused these institutions of being hotbeds of libertarian thought.
But perhaps I’m not being fair to CBO. Did the bureaucrats really imply, as part of their analysis on what would happen to the economy if the Bush tax cuts were allowed to expire, that you maximize growth with 100 percent tax rates?
You can read my original post, which holds up very well four years later. And here’s some of what I wrote yesterday to someone who asked me to justify my views on the issue.
…let’s focus on the “subsequent years,” when CBO projectst that GDP would be lower with extended tax cuts. …I’m happy to be corrected, but my reading is that CBO was stating that fiscal balance is the tail that wags the economic dog. The extended tax cuts cause larger deficits, and CBO says that these larger deficits will divert national saving from productive investment and lead to lower output. But if the tax burden is higher, as in the baseline forecast, then deficits are lower and more saving is available for productive investment and output is higher. As far as I’m aware, CBO didn’t have any limiting language back then to suggest that higher tax rates led to growth, but only up to X point. So I think I was on solid ground in asserting the CBO’s analysis implied that ever-higher tax rates led to ever-higher growth.
Seems reasonable. Moreover, I strongly suspect the Wonkblog reporter would have found several people to condemn me had I over-stated the implications of CBO’s analysis.
Now let’s return to the issue of whether Mr. Elmendorf should be re-appointed. Which fiscal conservatives are correct, the ones who want to keep him or the ones who want him replaced?
I’m in the latter category, as explained here, but Elmendorf’s defenders make plenty of good points.
The bottom line is that he is a nice guy (based on my limited interactions), a thoughtful economist, and he has been a big improvement over his predecessor. Indeed, he’s almost certainly the best CBO Director ever appointed by Democrats.
Here’s an analogy that may help make sense of this issue. Elmendorf’s predecessor was a doctrinaire leftist named Peter Orszag. If Orszag’s policy views were a country, they would be France or Greece. By contrast, I’m guessing that Elmendorf would be like Sweden or Germany.
In other words, he wants more government than I do, but at least Elmendorf basically understands that there’s no such thing as a free lunch. He realizes 2+2=4, and he’s aware that there are tradeoffs. And since his arrival, CBO has been much better on issues such as the adverse impact of higher marginal tax rates and the debilitating effect of higher transfer payments.
P.S. For more information about the economics of deficits and fiscal balance, here’s a video I narrated for the Center for Freedom and Prosperity.
P.P.S. The Congressional Research Service made the same argument about higher taxes being pro-growth, asserting in 2010 that “The expiration of the tax cuts would nevertheless reduce the budget deficit, absent other policy changes, which economic theory predicts would have a positive effect on the economy in the long run.”
The Congressional Budget Office (CBO) and Joint Committee on Taxation (JCT) are congressional bureaucracies that wield tremendous power on Capitol Hill because of their role as fiscal scorekeepers and referees.
Unfortunately, these bureaucracies lean to the left. When CBO does economic analysis or budgetary estimates, for instance, the bureaucrats routinely make it easier for politicians to expand the burden of government spending. The accompanying cartoon puts it more bluntly.
And when JCT does revenue estimates, the bureaucrats grease the skids for anti-growth tax policy by overstating revenue losses from lower tax rates and overstating revenue gains from higher tax rates.
Here are some examples of CBO’s biased output.
The CBO – over and over again – produced reports based on Keynesian methodology to claim that Obama’s so-called stimulus was creating millions of jobs even as the unemployment rate was climbing.
CBO has produced analysis asserting that higher taxes are good for the economy, even to the point of implying that growth is maximized when tax rates are 100 percent.
When purporting to measure loopholes in the tax code, the CBO chose to use a left-wing benchmark that assumes there should be double taxation of income that is saved and invested.
Because of the failure to properly measure the impact of tax policy on behavior, the JCT significantly overestimated the revenues from the Obamacare tax on tanning salons.
Though I want to be fair. Sometimes CBO and JCT produce garbage because they are instructed to put their thumbs on the scale by their political masters. The fraudulent process of redefining spending increases as spending cuts, for instance, is apparently driven by legislative mandates.
But the bottom line is that these bureaucracies, as currently structured and operated, aid and abet big government.
The CBO’s consistently flawed scoring of the cost of bills is used by Congress to justify legislation that rarely performs as promised and drags down the economy. …CBO relies heavily on Keynesian economic models, like the ones it used during the stimulus debate. Forecasters at the agency predicted the stimulus package would create more than 3 million jobs. …What looks good in the spirit world of the computer model may be very bad in the material realm of real life because people react to changes in policies in ways unaccounted for in these models.
And the Wall Street Journalopines wisely about the real role of the JCT.
Joint Tax typically overestimates the revenue gains from raising tax rates, while overestimating the revenue losses from tax rate cuts. This leads to a policy bias in favor of higher tax rates, which is precisely what liberal Democrats wanted when they created the Joint Tax Committee.
Amen. For all intents and purposes, the system is designed to help statists win policy battles.
That’s a helpful start, but I think the only effective long-run option is to replace the top staff with people who have a more accurate understanding of fiscal policy. Which is exactly what I said to Peter Roff, a columnist for U.S. News and World Report.
…the new congressional leadership should be looking at ways to reform the way the institution does its business – and the first place for it to start is the Congressional Budget Office. Most Americans don’t know what the CBO is, how it was created or what it does. They also don’t know how vitally important it is to the legislative process, especially where taxes, spending and entitlement reform are concerned. As Dan Mitchell, a well-respected economist with the libertarian Cato Institute, puts it in an email, the CBO “has a number-crunching role that gives the bureaucracy a lot of power to aid or hinder legislation, so it is very important for Republicans to select a director who understands the economic consequences of excessive spending and punitive tax rates.”
Heck, it’s not just “very important” to put in a good person at CBO (and JCT). As I’ve written before, it’s a test of whether the GOP has both the brains and resolve to fix a system that’s been rigged against them for decades.
So what will happen? I’m not sure, but Roll Call has a report on the behind-the-scenes discussions on Capitol Hill.
Flush from their capture of the Senate, Republicans in both chambers are reviewing more than a dozen potential candidates to succeed Douglas W. Elmendorf as director of the Congressional Budget Office after his term expires Jan. 3. …The appointment is being closely watched, with a number of Republicans pushing for CBO to change its budget scoring rules to use dynamic scoring, which would try to account for the projected impact of tax cuts and budget changes on the economy.
So who will it be? The Wall Street Journalweighs in, pointing out that CBO has been a tool for the expansion of government.
…the budget rules are rigged to expand government and hide the true cost of entitlements. CBO scores aren’t unambiguous facts but are guesses about the future, biased by the Keynesian assumptions and models its political masters in Congress instruct it to use. Republicans who now run Congress can help taxpayers by appointing a new CBO director, as is their right as the majority. …The Tax Foundation’s Steve Entin would be an inspired pick.
I disagree with one part of the above excerpt. Steve Entin is superb, but he would be an inspired pick for the Joint Committee on Taxation, not the CBO.
But I fully agree with the WSJ’s characterization of the budget rules being used to grease the skids for bigger government.
In a column for National Review, Dustin Siggins writes that Bill Beach, my old colleague from my days at the Heritage Foundation, would be a good choice for CBO.
…few Americans may realize that the budgetprocessis at least as twisted as the budget itself. While one man can’t fix it all, Republicans who want to be taken seriously about budget reform should approve Bill Beach to head the Congressional Budget Office (CBO). Putting the right person in charge as Congress’s official “scorekeeper” would be an important first step in proving that the party is serious about honest, transparent, and efficient government. …CBO has several major structural problems that a new CBO director should fix.
Hmm… Entin at JCT and Beach at CBO. That might even bring a smile to my dour face.
But it doesn’t have to be those two specific people. There are lots of well-regarded policy scholars who could take on the jobs of reforming and modernizing the work of JCT and CBO.
But that will only happen if Republicans are willing to show some fortitude. And that means they need to be ready to deal with screeching from leftists who want to maintain their control of these institutions.
For example, Peter Orszag, a former CBO Director who then became Budget Director for Obama (an easy transition), wrote for Bloomberg that he’s worried GOPers won’t pick someone with his statist views.
The Congressional Budget Office should be able to celebrate its 40th anniversary this coming February with pride. …The occasion will be ruined, however, if the new Republican Congress breaks its long tradition of naming an objective economist/policy analyst as CBO director, when the position becomes vacant next year, and instead appoints a party hack.
By the way, it shows a remarkable lack of self-awareness for someone like Orszag to complain about the possibility of a “party hack” heading up CBO.
In any event, that’s just the tip of the iceberg. I fully expect we’ll also see editorials very soon from the New York Times, Washington Post, and other statist outlets about the need to preserve the “independence” of CBO and JCT.
Just keep in mind that their real goal is to maintain their side’s control over the process.
P.S. There’s another Capitol Hill bureaucracy, the Congressional Research Service, that also generates leftist fiscal policy analysis. Fortunately, the CRS doesn’t have any scorekeeper or referee role, so it doesn’t cause nearly as much trouble. Nonetheless, any bureaucracy that produces “research” about higher taxes being good for the economy needs to be abolished or completely revamped.
P.P.S. This video explains the Joint Committee on Taxation’s revenue-estimating methodology. Pay extra attention to the section beginning around the halfway point, which deals with a request my former boss made to the JCT.
P.P.P.S. If you want to see some dramatic evidence that lower tax rates don’t necessarily lead to less revenue, check out this amazing data from the 1980s.
Well, I don’t even know if there are words that can describe the latest bit of bad news about Obamacare. The Congressional Budget Office, which usually carries water for those who favor bigger government, has been forced to acknowledge that Obamacare is going to wreak havoc with America’s job market.
Today’s Wall Street Journal has a column on the topic, giving considerable and deserved credit to Casey Mulligan, an economics professor at the University of Chicago who has produced first-rate research on implicit marginal tax rates and labor supply incentives.
Rarely are political tempers so raw over an 11-page appendix to a dense budget projection for the next decade. But then the CBO—Congress’s official fiscal scorekeeper, widely revered by Democrats and Republicans alike as the gold standard of economic analysis—reported that by 2024 the equivalent of 2.5 million Americans who were otherwise willing and able to work before ObamaCare will work less or not at all as a result of ObamaCare. As the CBO admits, that’s a “substantially larger” and “considerably higher” subtraction to the labor force than the mere 800,000 the budget office estimated in 2010. The overall level of labor will fall by 1.5% to 2% over the decade, the CBO figures. Mr. Mulligan’s empirical research puts the best estimate of the contraction at 3%. The CBO still has some of the economics wrong, he said in a phone interview Thursday, “but, boy, it’s a lot better to be off by a factor of two than a factor of six.”
But I’ve digressed long enough. Let’s get back to the WSJ column about the latest Obamacare disaster.
Our friends on the left are in a very tough position.
…liberals have turned to claiming that ObamaCare’s missing workers will be a gift to society. Since employers aren’t cutting jobs per se through layoffs or hourly take-backs, people are merely choosing rationally to supply less labor. Thanks to ObamaCare, we’re told, Americans can finally quit the salt mines and blacking factories and retire early, or spend more time with the children, or become artists. Mr. Mulligan reserves particular scorn for the economists making this “eliminated from the drudgery of labor market” argument, which he views as a form of trahison des clercs. …A job, Mr. Mulligan explains, “is a transaction between buyers and sellers. When a transaction doesn’t happen, it doesn’t happen. We know that it doesn’t matter on which side of the market you put the disincentives, the results are the same. . . . In this case you’re putting an implicit tax on work for households, and employers aren’t willing to compensate the households enough so they’ll still work.” Jobs can be destroyed by sellers (workers) as much as buyers (businesses).
By the way, just in case you’re an unsophisticated rube like me, Wiktionary says that trahison des clercs means “a compromise of intellectual integrity by members of an intelligentsia.”
Which is a pretty good description of leftists who are twisting themselves into pretzels trying to rationalize that joblessness and government dependency are good things.
And Prof. Mulligan makes the right analogy.
He adds: “I can understand something like cigarettes and people believe that there’s too much smoking, so we put a tax on cigarettes, so people smoke less, and we say that’s a good thing. OK. But are we saying we were working too much before? Is that the new argument? I mean make up your mind. We’ve been complaining for six years now that there’s not enough work being done. . . . Even before the recession there was too little work in the economy. Now all of a sudden we wake up and say we’re glad that people are working less? We’re pursuing our dreams?” The larger betrayal, Mr. Mulligan argues, is that the same economists now praising the great shrinking workforce used to claim that ObamaCare would expand the labor market. He points to a 2011 letter organized by Harvard’s David Cutler and the University of Chicago’s Harold Pollack, signed by dozens of left-leaning economists including Nobel laureates, stating “our strong conclusion” that ObamaCare will strengthen the economy and create 250,000 to 400,000 jobs annually.
Gee, that “strong conclusion” about an increase in jobs somehow turned into a cold reality that the economy might lose the equivalent of 2.5 million jobs.
This is very grim news. We can be happy that there’s now even more evidence that big government doesn’t work, but we should never forget that there are real victims when statist policies lead to less growth and more joblessness.
So let’s try to bring some cheer to a dismal situation with some new Obamacare cartoons.
Our first entry is from Chip Bok, who is mocking the New York Times for writing that fewer jobs was “a liberating result of the law.”
Gary Varvel’s analysis of the job impact has a seasonal theme.
P.S. If you want to learn more about how redistribution programs such as Obamacare trap people in dependency and discourage them from the job market, click here.
As you can see from this excerpted table, CBO makes the same mistake as the Tax Policy Center and assumes that there should be double taxation of income that is saved and invested. As such, they list IRAs and 401(k)s as tax expenditures, even though those provisions merely enable people to avoid being double-taxed.
Likewise, the CBO report assumes that there should be double taxation of dividends and capital gains, so provisions to guard against such destructive policies also are listed as tax expenditures.
The CBO report says that tax expenditures will total about $12 trillion over the next 10 years, but about one-third of that amount (which I’ve marked with a red X) don’t belong on the list.
By the way, at least the Tax Policy Center has an excuse for putting its thumb on the scale and issuing a flawed estimate of tax expenditures. It’s a project of the Brookings Institution and Urban Institute, both of which are on the left side of the political spectrum. So it’s hardly a surprise that they use a benchmark designed to promote punitive tax policy.
But what’s CBO’s excuse?
To be fair, at least CBO admitted in the report that there’s a different way of seeing the world.
…tax expenditures are measured relative to a comprehensive income tax system. If tax expenditures were evaluated relative to an alternative tax system—for instance, a comprehensive consumption tax, such as a national retail sales tax or a value-added tax—some of the 10 major tax expenditures analyzed here would not be considered tax expenditures. For example, because a consumption tax would exclude all savings and investment income from taxation, the exclusion of net pension contributions and earnings would be considered part of the normal tax system and not a tax expenditure.
But admitting the existence of another approach doesn’t let CBO off the hook. At the very least, the bureaucracy should have produced a a parallel set of estimates for tax expenditures assuming no double taxation. That basic competence and fairness.
By the way, the Government Accountability Office is worse than CBO. When GAO did a report on corporate tax expenditures, that bureaucracy didn’t even acknowledge that there was an alternate way of looking at the data.
*Actually, the ideal approach would be to dramatically reduce the burden of government spending, shrinking the size and scope of the federal government back to what the Founding Fathers had in mind. Under that system, there presumably wouldn’t be a need for any broad-based tax.
P.S. This new report is not even close to being the worst thing produced by CBO. The bureaucrats on several occasions have asserted that higher taxes are good for growth, even to the point of implying that the growth-maximizing tax rate is 100 percent! And CBO is slavishly devoted to Keynesian economics, notwithstanding several decades of evidence that you can’t make an economy richer by taking money out of one pocket and putting it in another pocket.
I’ve commented before how the fiscal fight in Europe is a no-win contest between advocates of Keynesian deficit spending (the so-called “growth” camp, if you can believe that) and proponents of higher taxes (the “austerity” camp, which almost never seems to mean spending restraint).
That’s a left-vs-left battle, which makes me think it would be a good idea if they fought each other to the point of exhaustion, thus enabling forward movement on a pro-growth agenda of tax reform and reductions in the burden of government spending.
That’s a nice thought, but it probably won’t happen in Europe since almost all politicians in places such as Germany and France are statists. And it might never happen in the United States if lawmakers pay attention to the ideologically biased work of the Congressional Budget Office (CBO).
For all intents and purposes, the CBO has a slavish devotion to Keynesian theory in the short run, which means more spending supposedly is good for growth. But CBO also believes that higher taxes improve growth in the long run by ostensibly leading to lower deficits. Here’s what it says will happen if automatic budget cuts are cancelled.
Eliminating the automatic enforcement procedures established by the Budget Control Act of 2011 that are scheduled to reduce both discretionary and mandatory spending starting in January and maintaining Medicare’s payment rates for physicians’ services at the current level would boost real GDP by about three-quarters of a percent by the end of 2013.
…the agency has estimated the effect on output that would occur in 2022 under the alternative fiscal scenario, which incorporates the assumption that several of the policies are maintained indefinitely. CBO estimates that in 2022, on net, the policies included in the alternative fiscal scenario would reduce real GDP by 0.4 percent and real gross national product (GNP) by 1.7 percent. …the larger budget deficits and rapidly growing federal debt would hamper national saving and investment and thus reduce output and income.
In other words, CBO reflexively makes two bold assumption. First, it assumes higher tax rates generate more money. Second, the bureaucrats assume that politicians will use any new money for deficit reduction. Yeah, good luck with that.
To be fair, the CBO report does have occasional bits of accurate analysis. The authors acknowledge that both taxes and spending can create adverse incentives for productive behavior.
…increases in marginal tax rates on labor would tend to reduce the amount of labor supplied to the economy, whereas increases in revenues of a similar magnitude from broadening the tax base would probably have a smaller negative impact or even a positive impact on the supply of labor. Similarly, cutting government benefit payments would generally strengthen people’s incentive to work and save.
But these small concessions do not offset the deeply flawed analysis that dominates the report.
While I’m irritated about CBO’s bias (and the fact that it’s being financed with my tax dollars), that’s not what has me worked up. The reason for this post is to grouse and gripe about the fact that some people are citing this deeply flawed analysis to oppose Obama’s pursuit of class warfare tax policy.
Why would some Republican politicians and conservative commentators cite a publication that promotes higher spending in the short run and higher taxes in the long run? Well, because it also asserts – based on Keynesian analysis – that higher taxes will hurt the economy in the short run.
…extending the tax reductions originally enacted in 2001, 2003, and 2009 and extending all other expiring provisions, including those that expired at the end of 2011, except for the payroll tax cut—and indexing the alternative minimum tax (AMT) for inflation beginning in 2012 would boost real GDP by a little less than 1½ percent by the end of 2013.
At the risk of sounding like a doctrinaire purist, it is unethical to cite inaccurate analysis in support of a good policy.
Consider this example. If some academic published a study in favor of the flat tax and it later turned out that the data was deliberately or accidentally wrong, would it be right to cite that research when arguing for tax reform? I hope everyone would agree that the answer is no.
Yet that’s precisely what is happening when people cite CBO’s shoddy work to argue against tax increases.
I’ve also cited my Cato colleague Chris Edwards, who has made a more comprehensive (and well-documented) claim that government officials systematically lie about the cost of new projects.
In 2002, the British government estimated the cost of hosting the Olympic Games at $2.8 billion. Ten years later, the price has passed $15 billion and is still rising. When everything is added up — lost business, as many as 13,500 British soldiers patrolling the streets of London (more than are in Afghanistan) — the expenses may come to $38 billion.
Wow, cost overruns of somewhere between 500 percent and 1300 percent. That’s bad, even by government standards.
Though I imagine that moronic advocates of Keynesian economics will argue that the $15 billion-$38 billion is a form of stimulus that will percolate through the economy – conveniently forgetting that the money had to be taxed and borrowed from the private economy in the first place.
P.S. The top cartoon in this post is a good description of how government officials come up with their fiscal estimates.
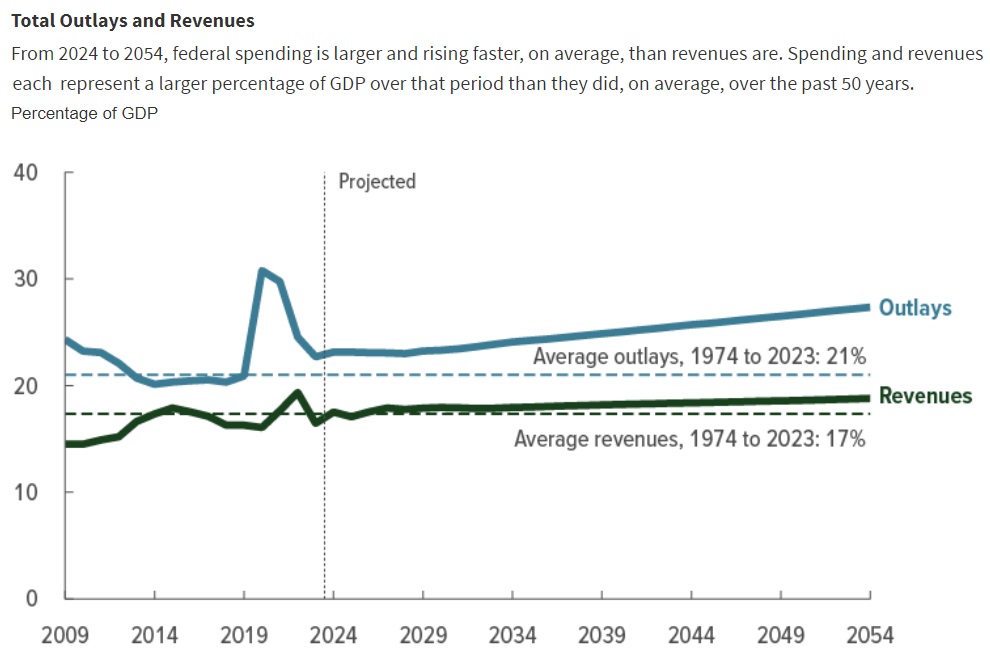
Under current law, total federal outlays would equal 23.1 percent of GDP in 2024, remain near that level through 2028, and then increase each year as a share of the economy, reaching 27.3 percent in 2054… From 1974 to 2023, outlays averaged 21 percent of GDP; over the 2024–2054 period, projected outlays average about 25 percent of GDP… The key drivers of that increase over the next 30 years are higher net interest costs, which result from rising interest rates and growing federal debt, and growth in spending on major health care programs, particularly Medicare, which is caused by the rising cost of health care and the aging of the population.
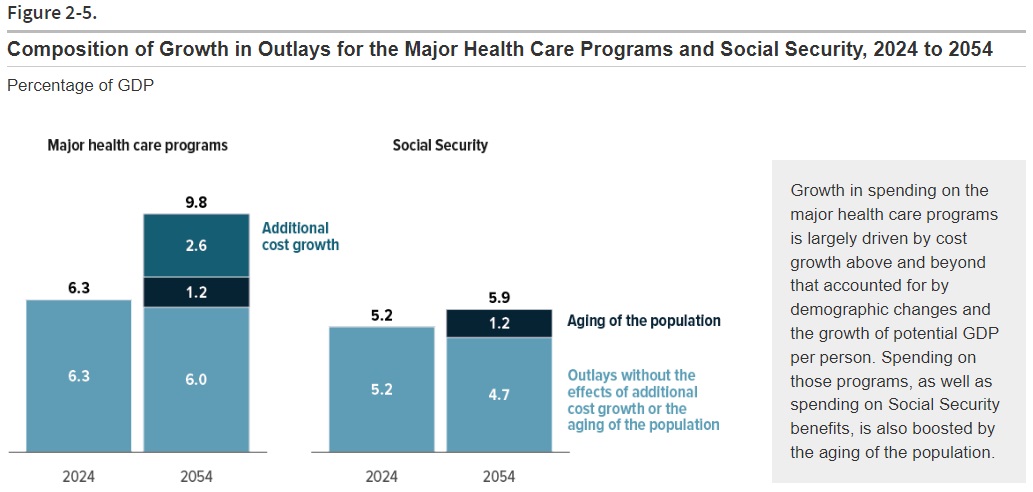
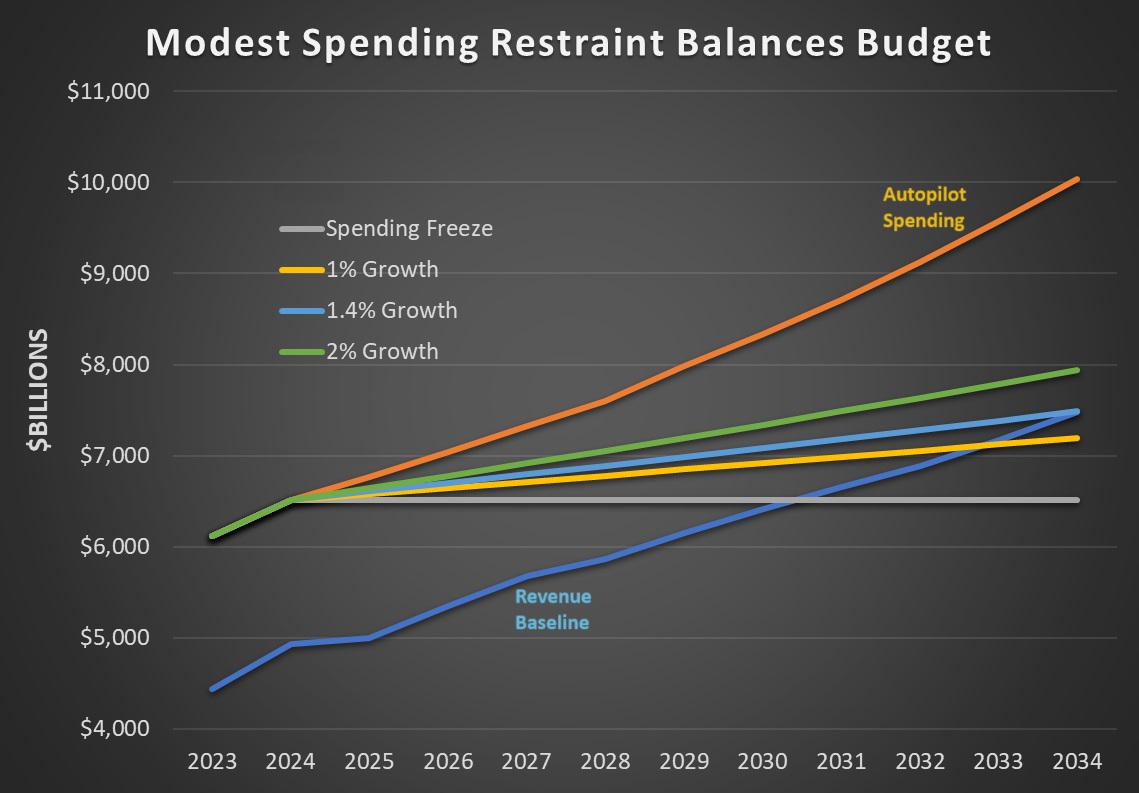
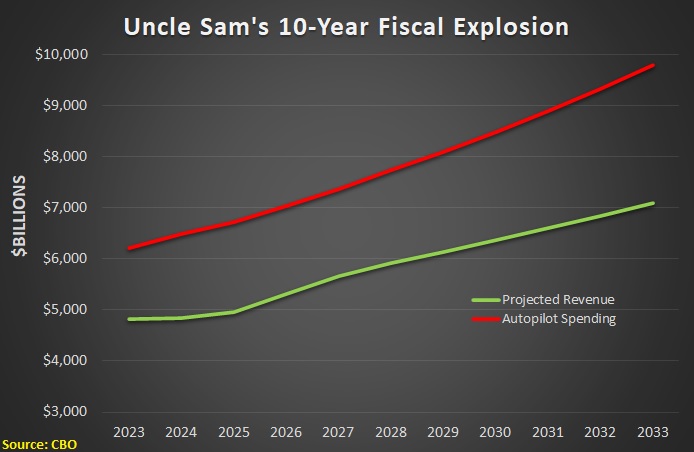
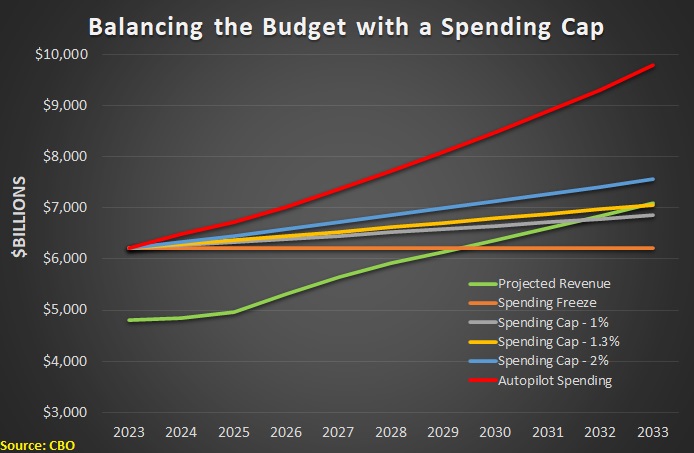
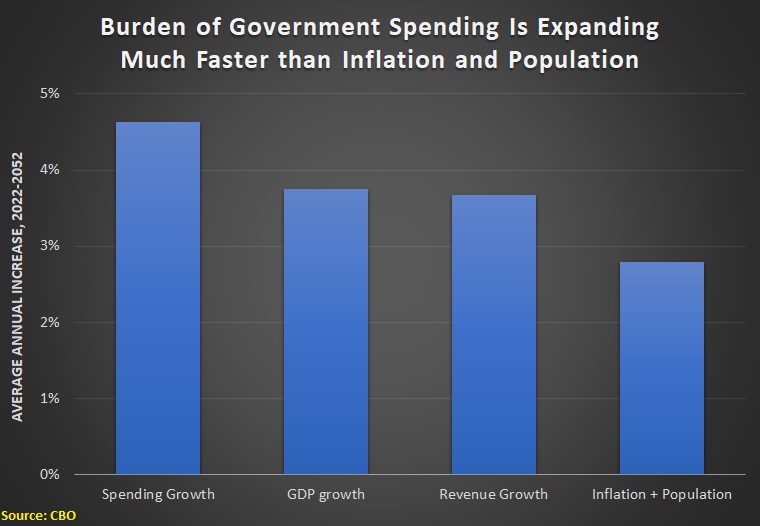
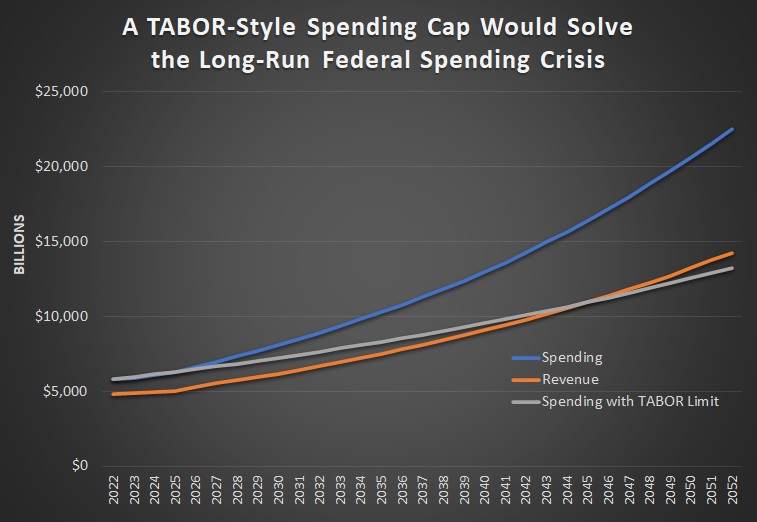
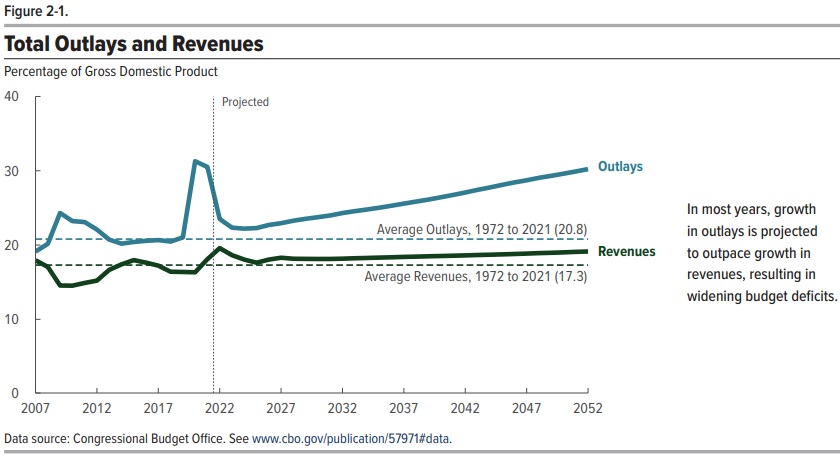
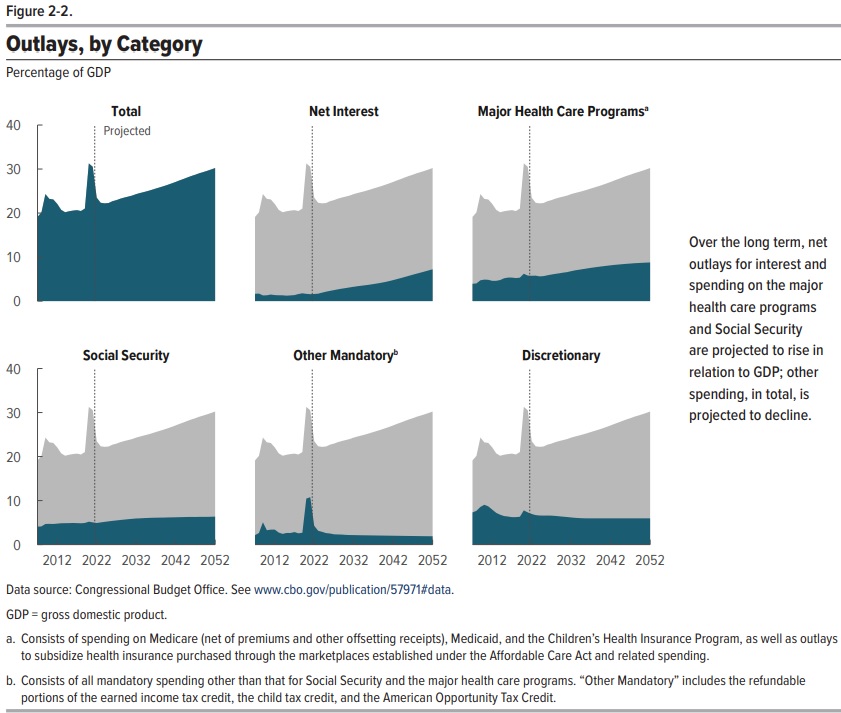
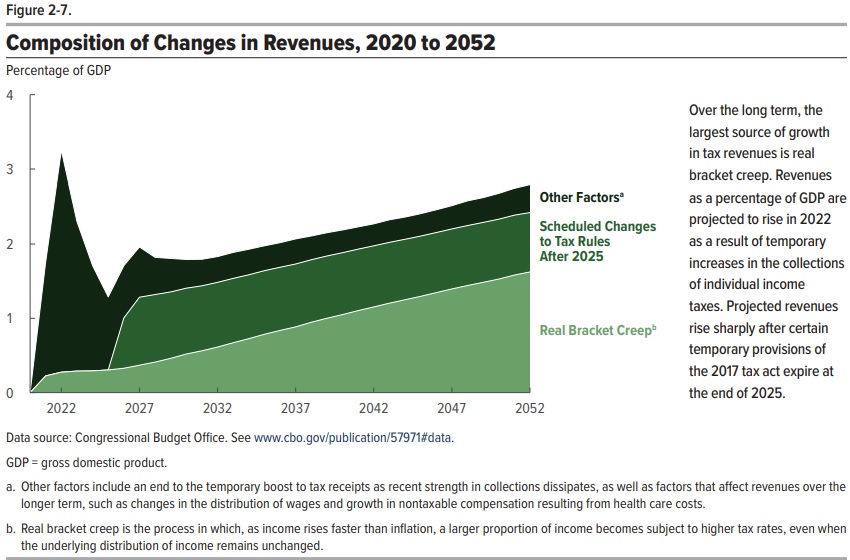
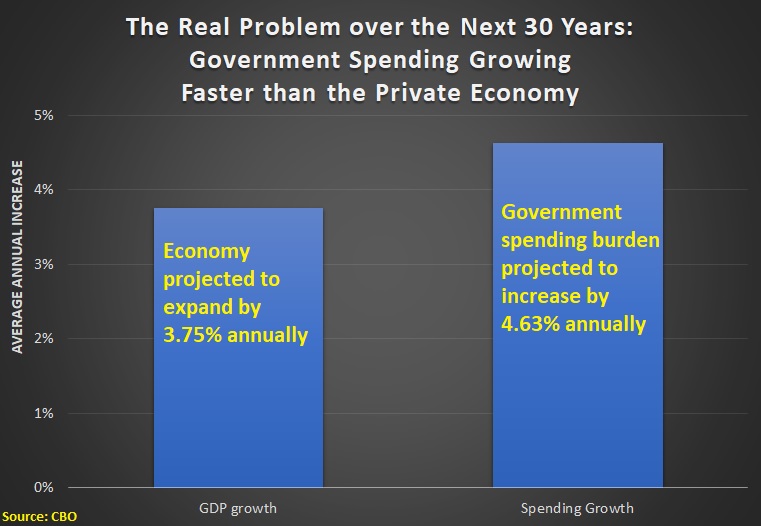

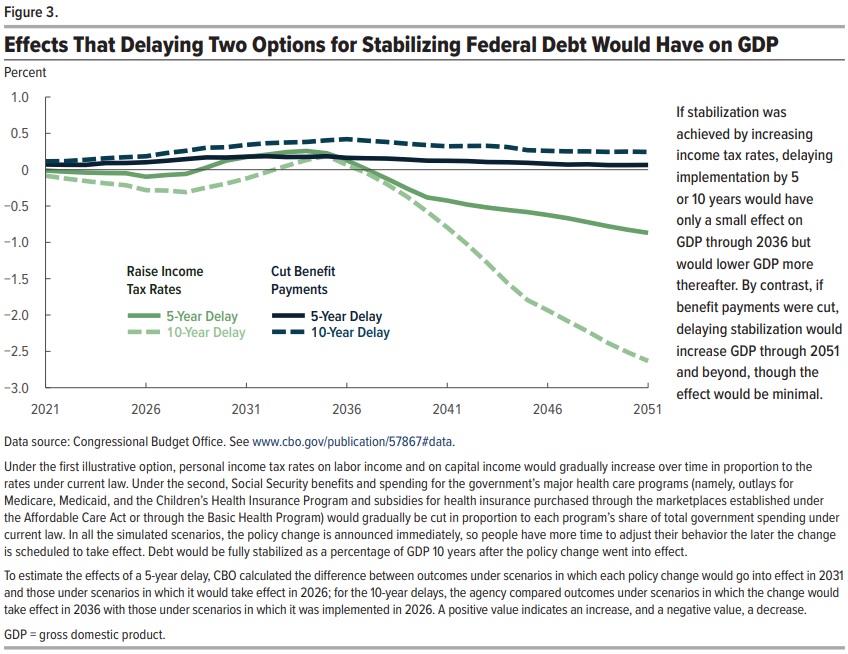
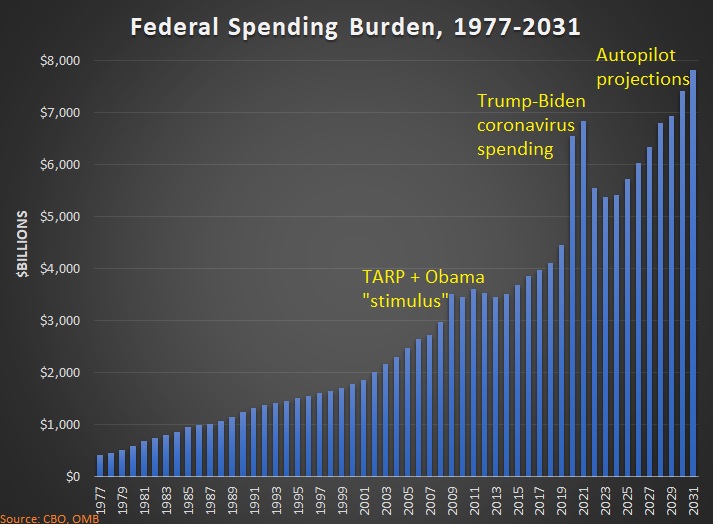
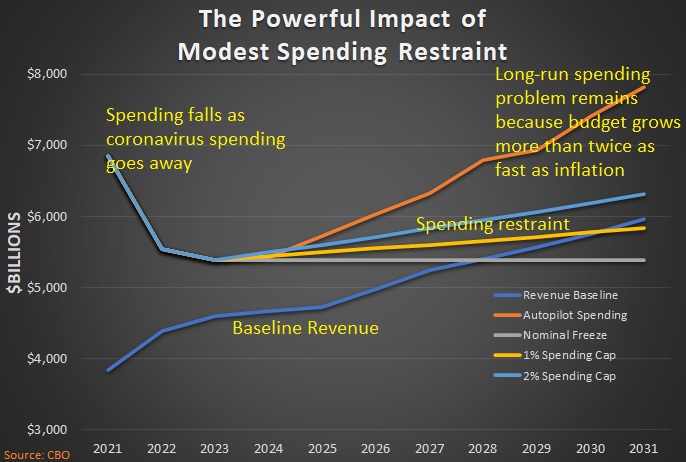

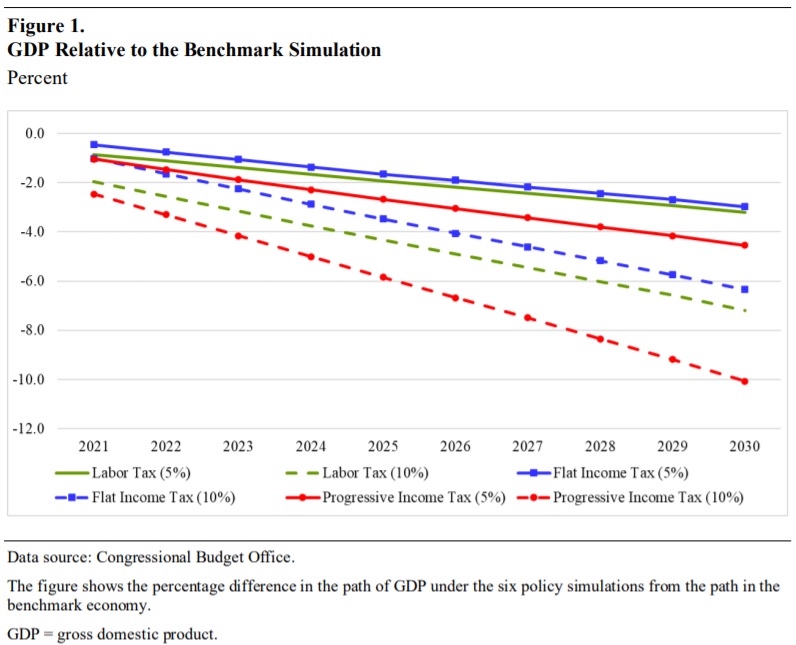
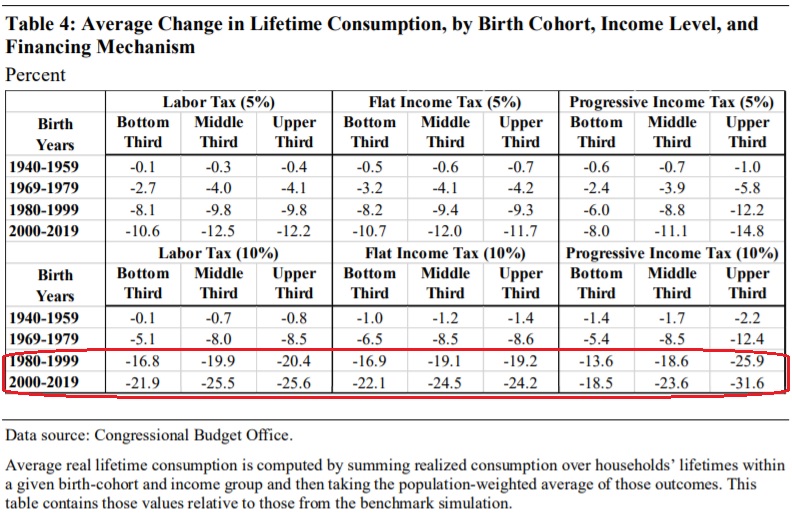
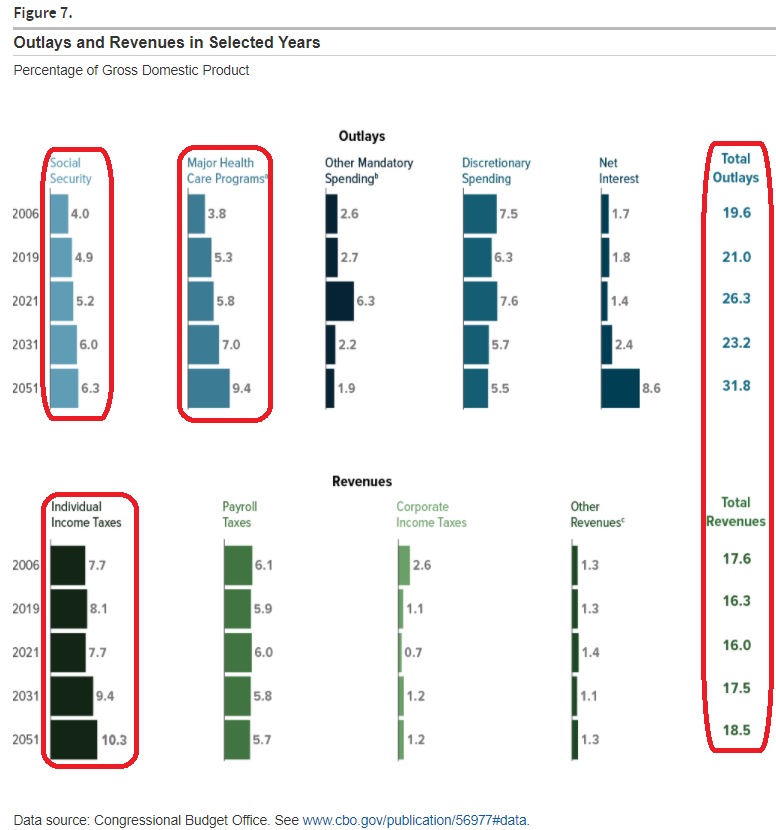
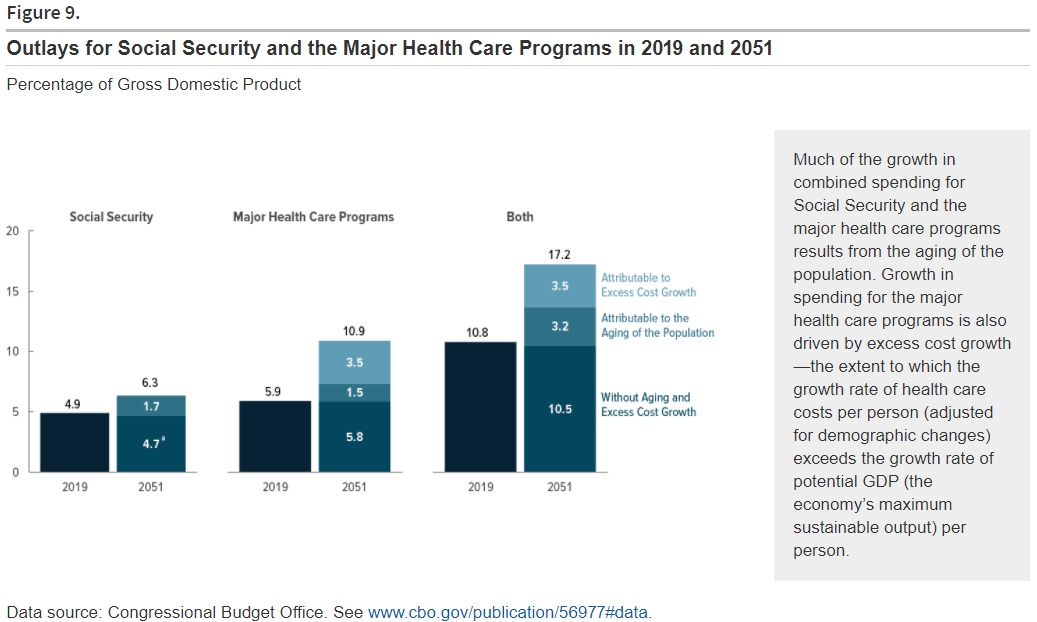
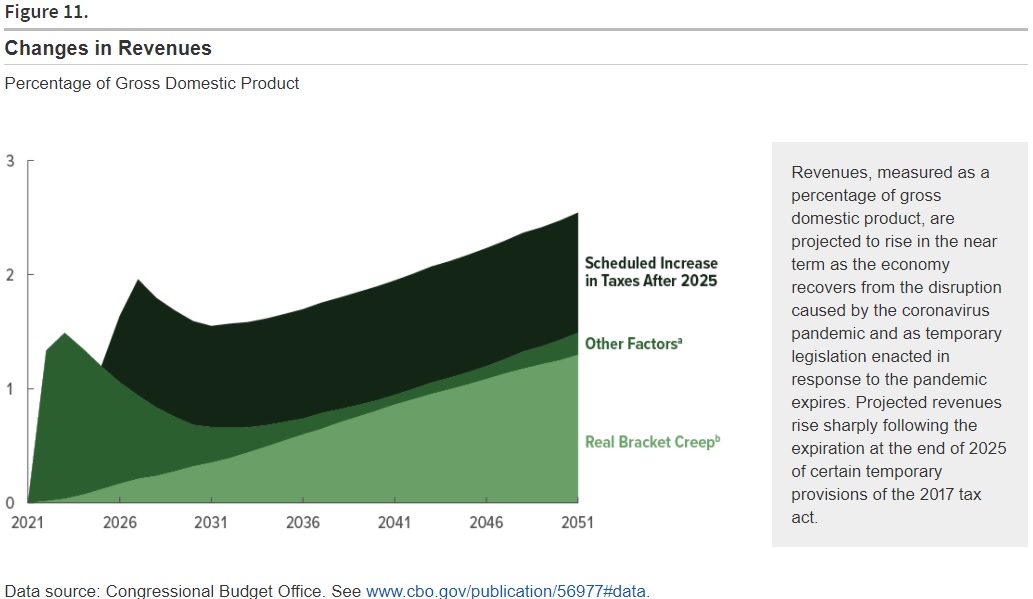
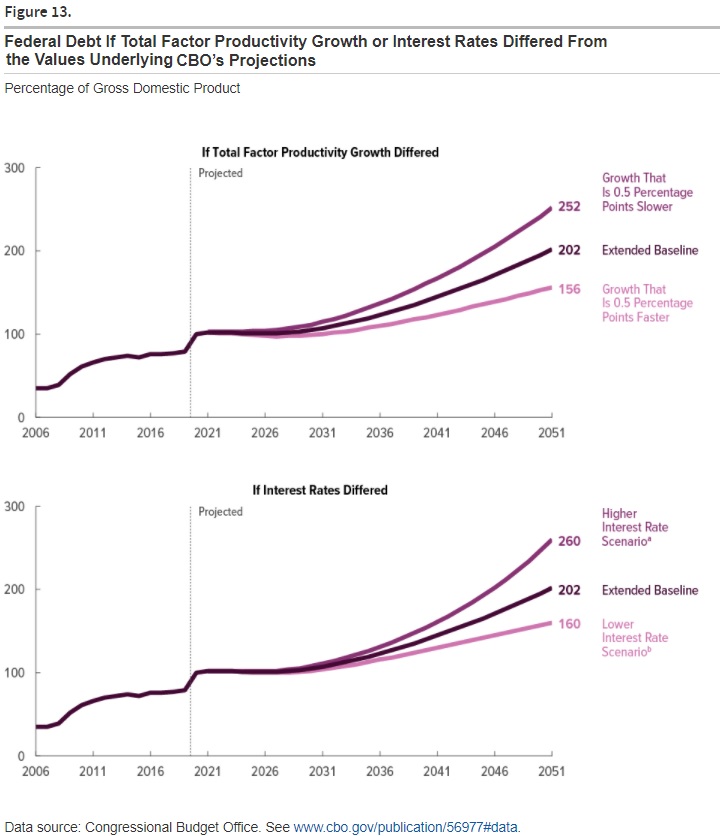
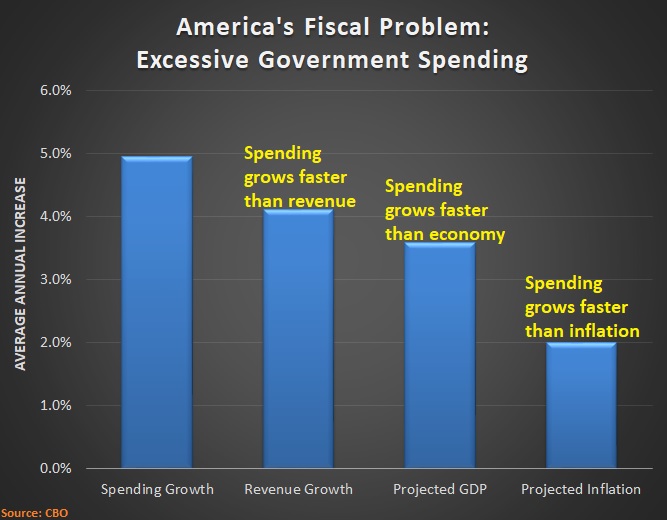
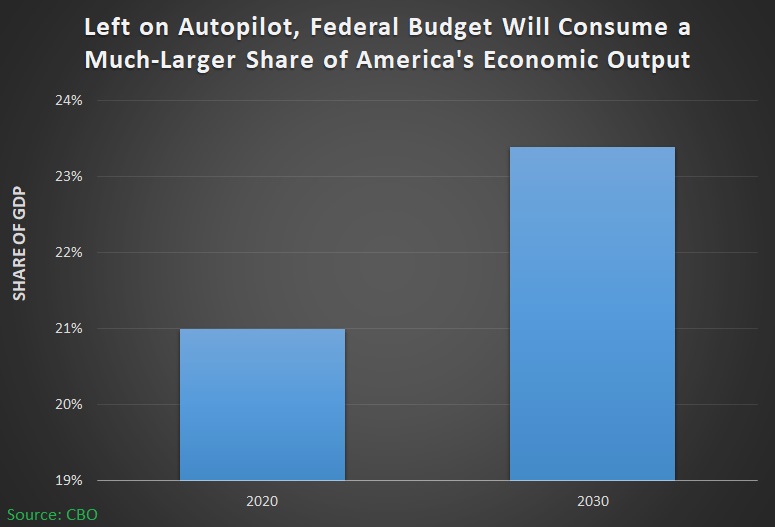

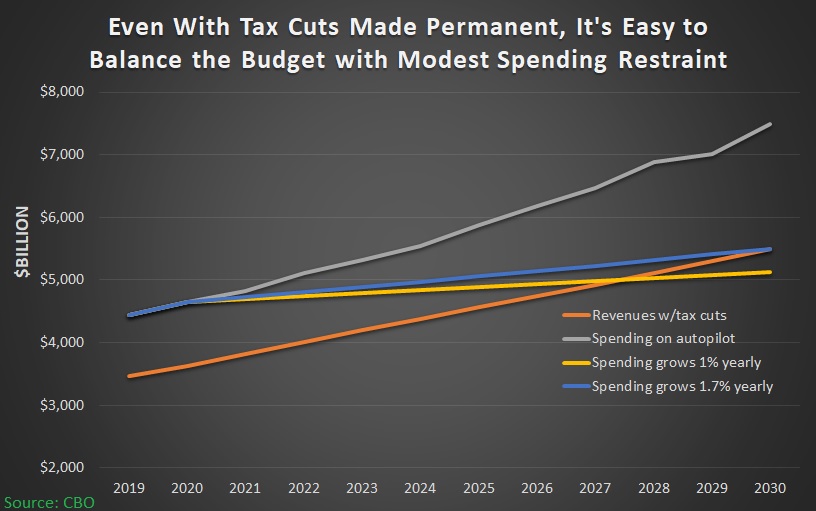


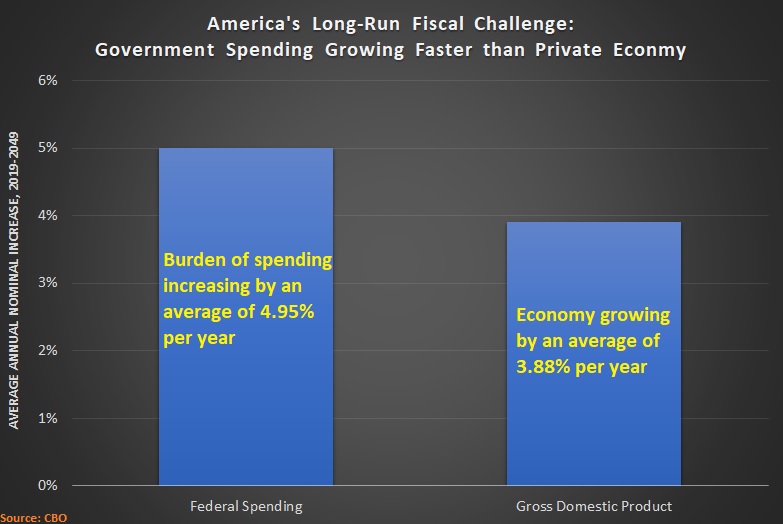
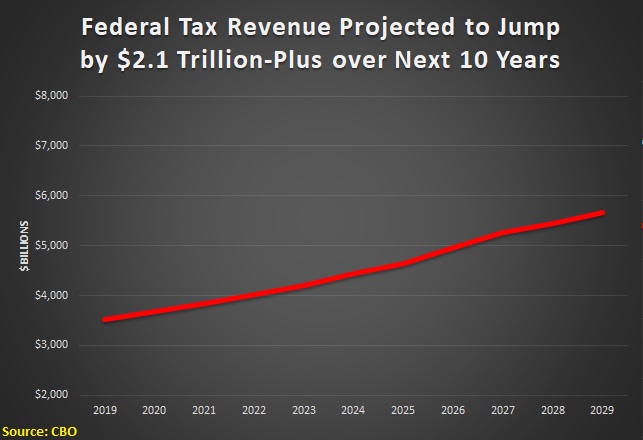
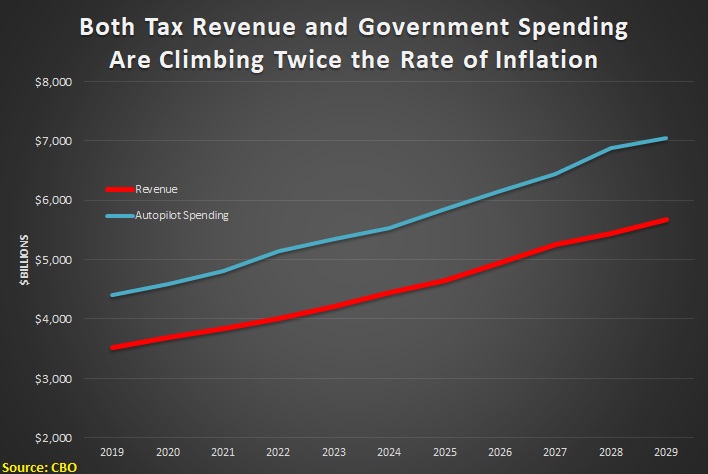
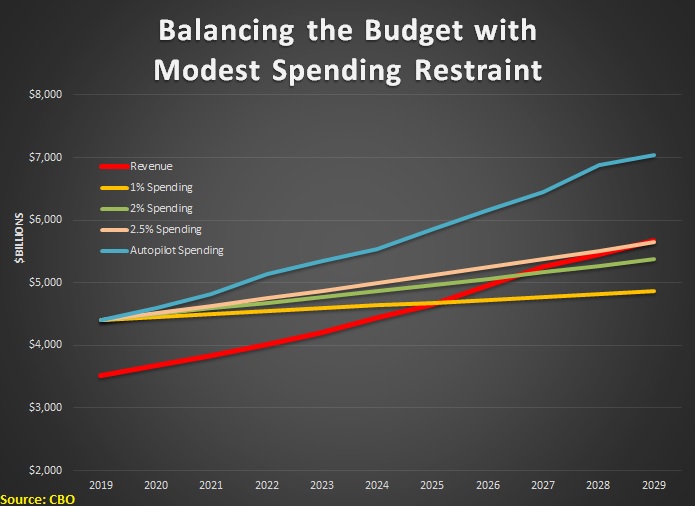
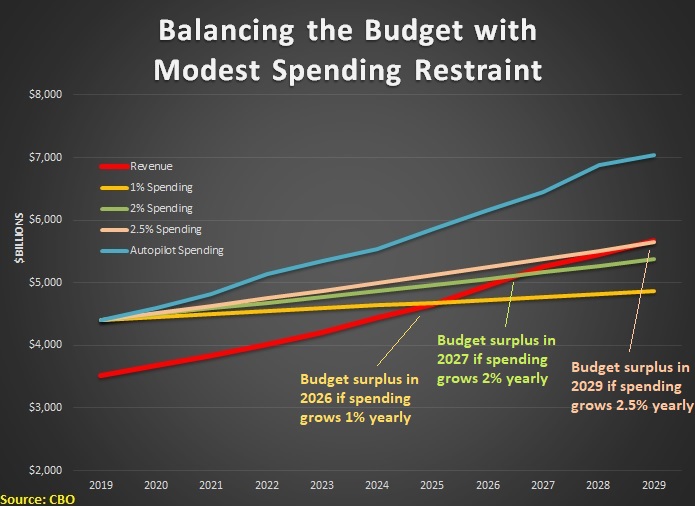


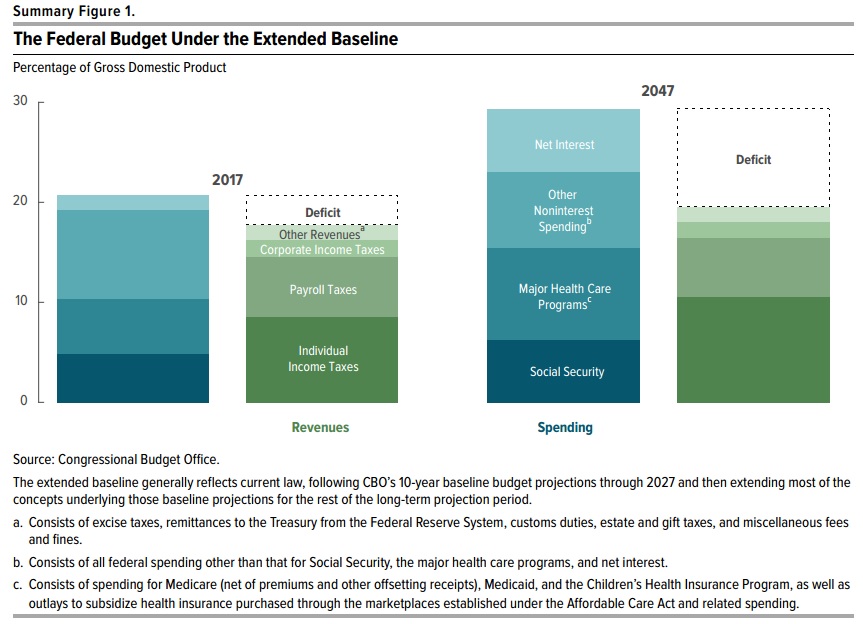
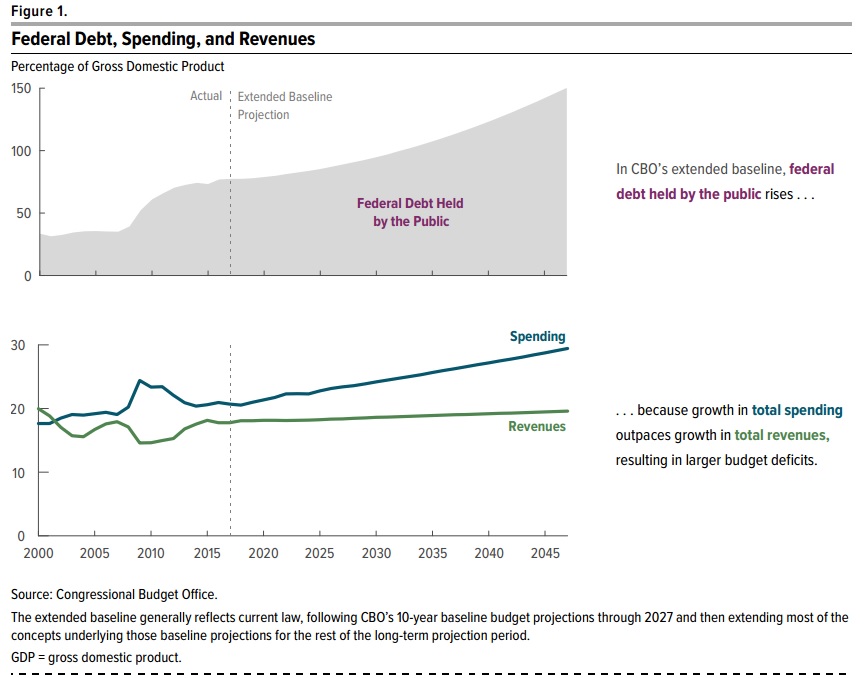
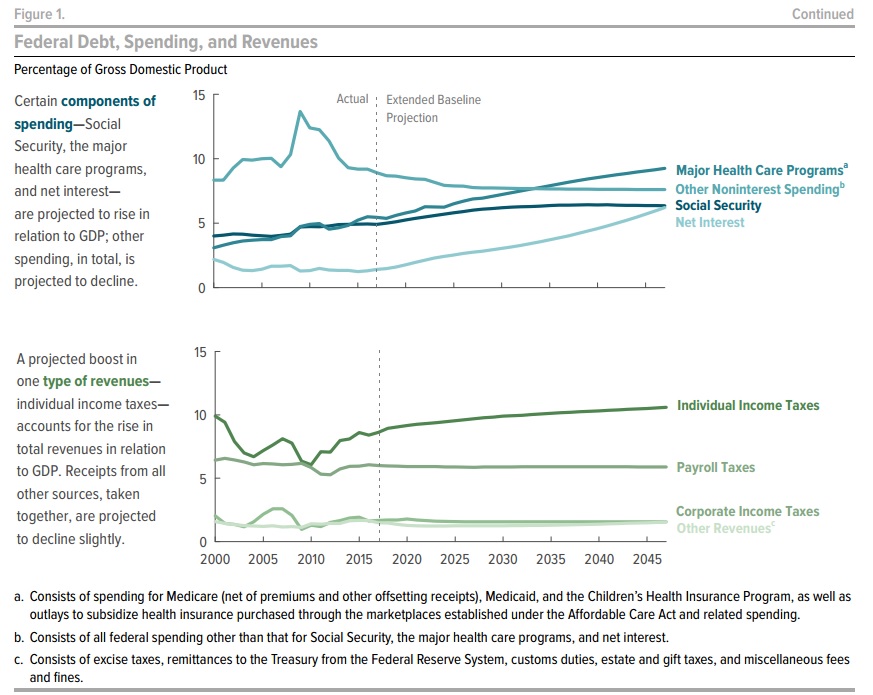
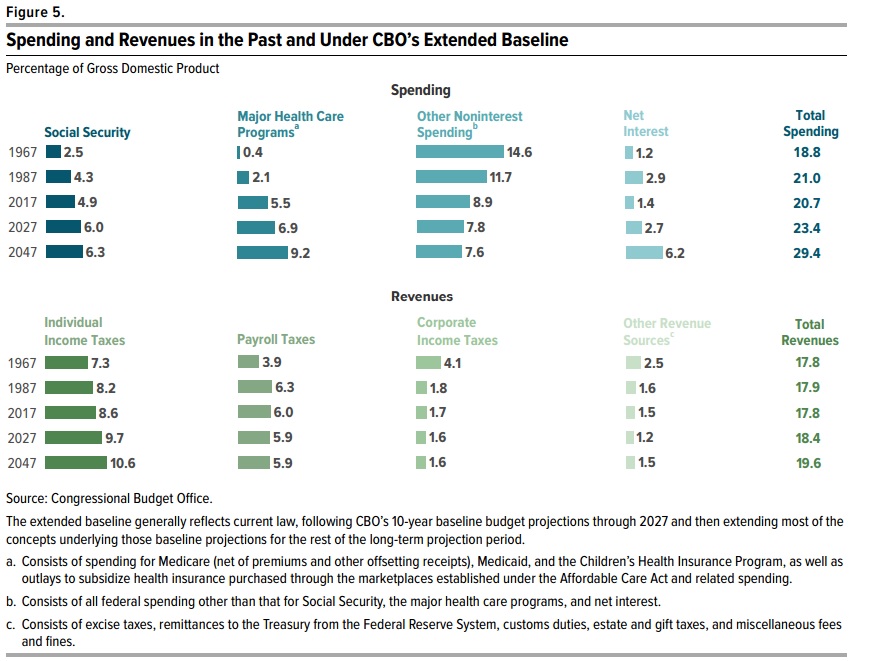
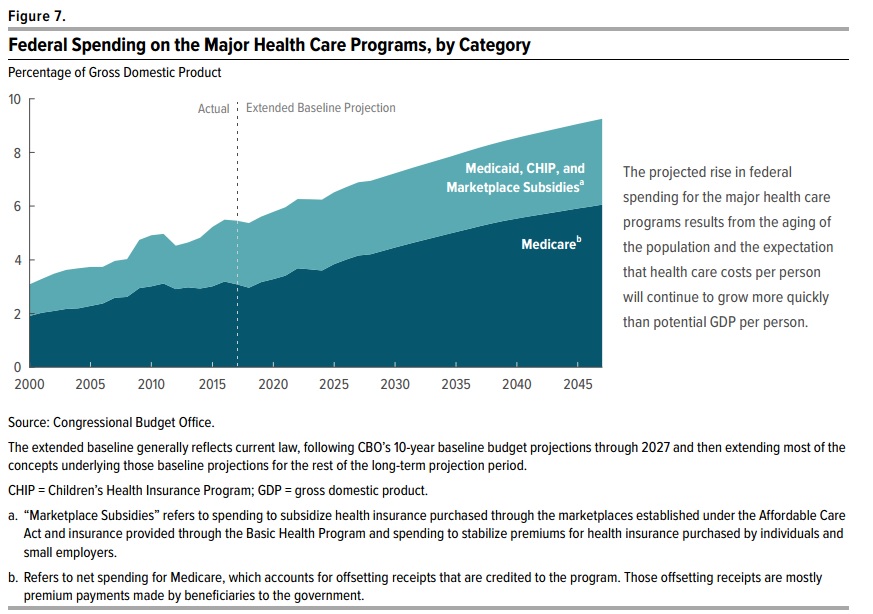

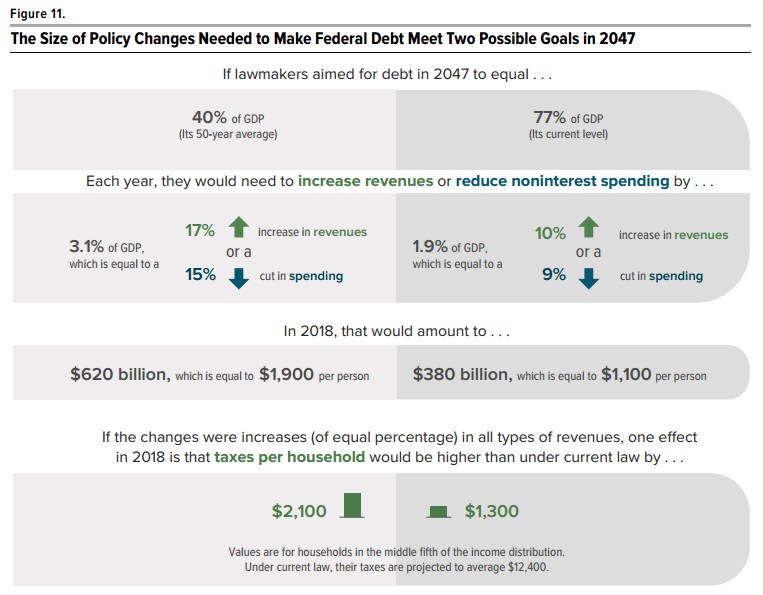
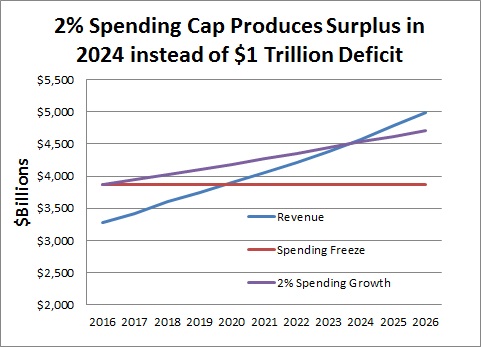

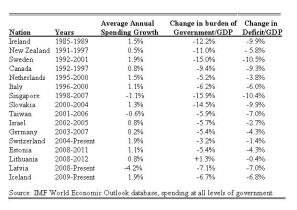

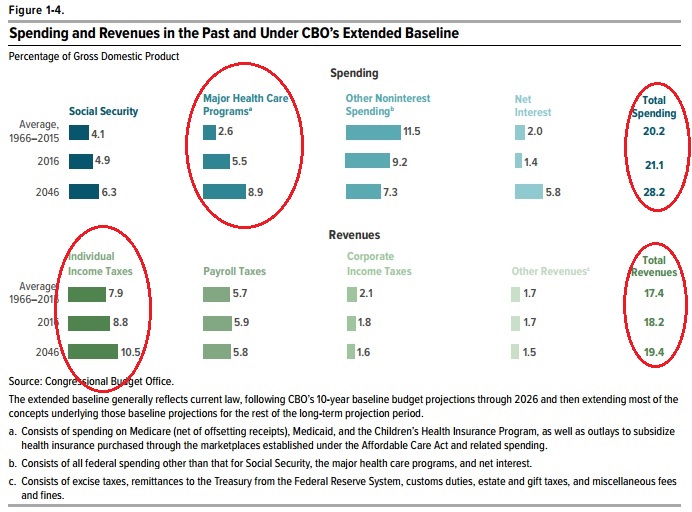
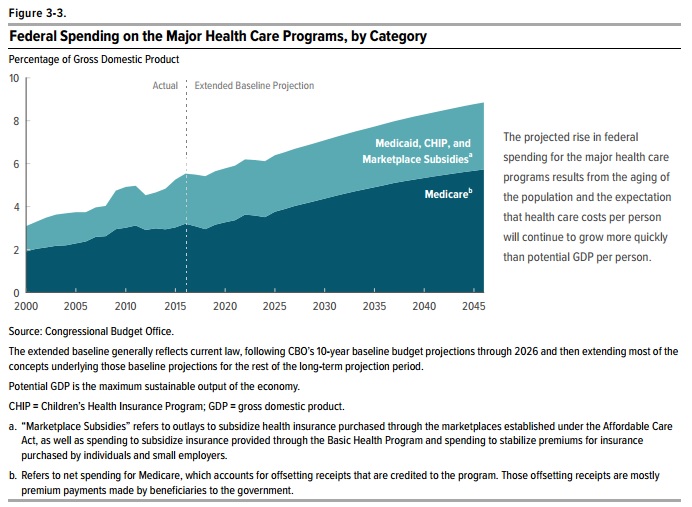
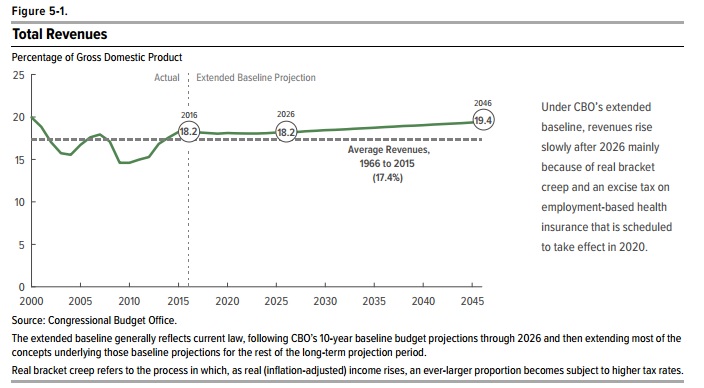
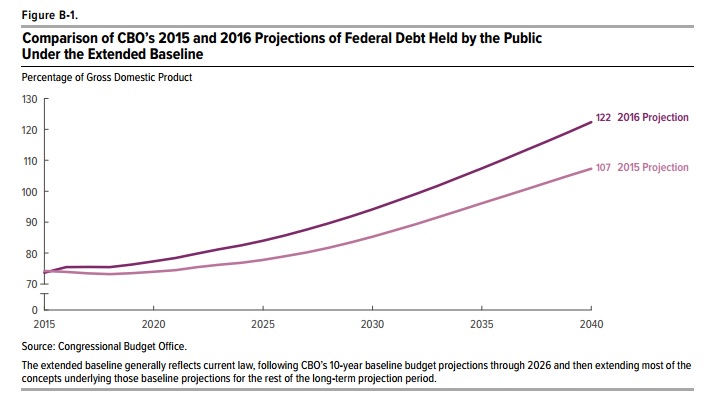
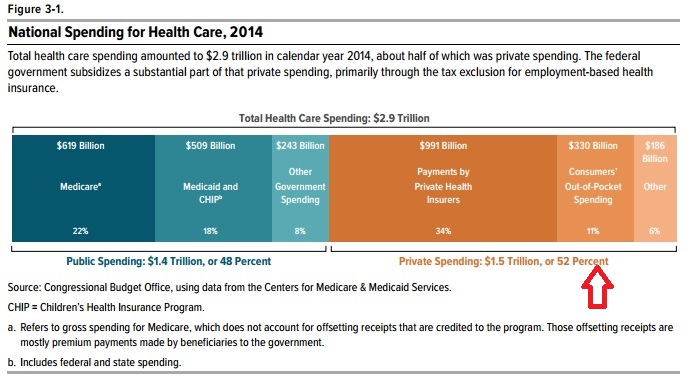
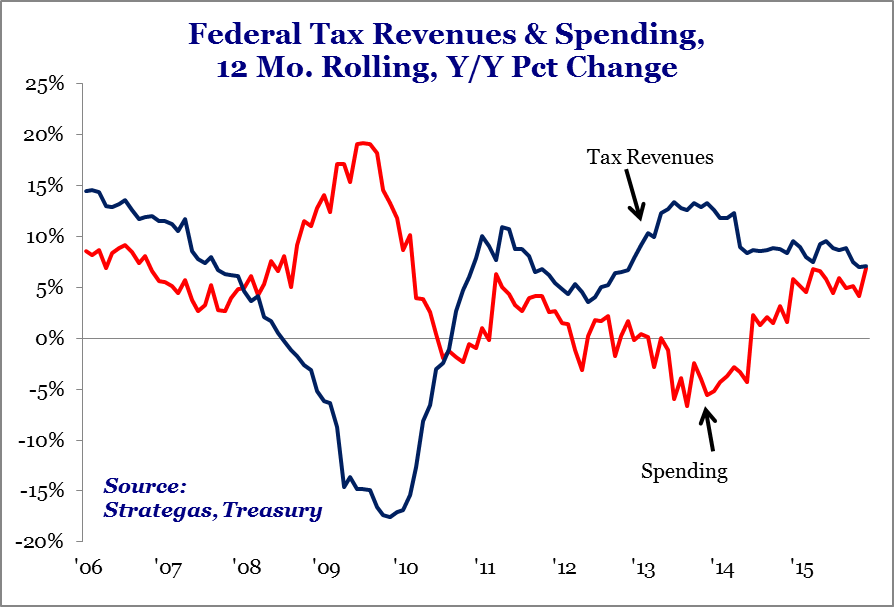


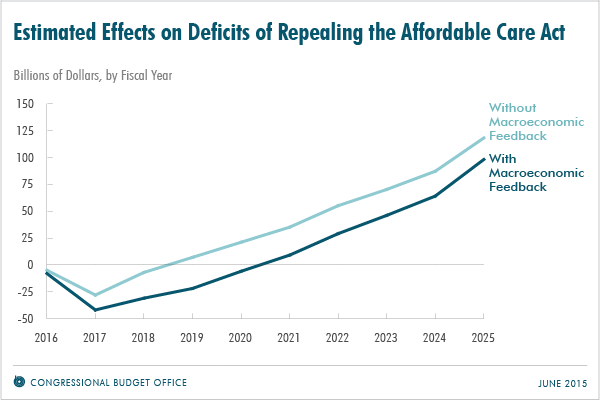
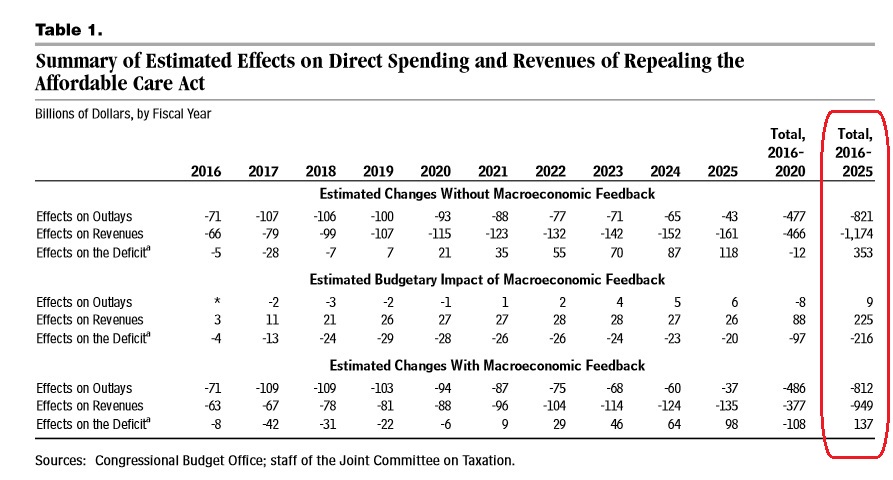
 including a torpedo and an anti-aircraft gun, Der Tagesspiegel website reports. …the army had to be called in with modern-day tanks to haul the Panther from its cellar. It took about 20 soldiers almost nine hours to extract the tank… It seems the tank’s presence wasn’t much of a secret locally. Several German media reports mention that residents had seen the man driving it around town about 30 years ago. “He was chugging around in it during the snow catastrophe in 1978,” Mayor Alexander Orth was quoted as saying.