What is the American Dream?
I suspect it’s a bit like beauty, in the eye of the beholder, but here’s the Wikipedia definition:
…a national ethos of the United States, a set of ideals in which freedom includes the opportunity for prosperity and success, and an upward social mobility for the family and children, achieved through hard work in a society with few barriers.
That sounds reasonable. My view, for what it’s worth, is that people will prosper in a system of free markets and limited government.
 Now let’s ask a tougher set of questions. Is the American Dream a myth or reality? And if it’s real, does it still exist?
Perhaps most important, what’s needed for the Dream to be a reality?
Writing for the New York Times, I added my two cents on this issue, taking part in a “Room for Debate” on the issue of “Is the Modern American Dream Attainable?”
As you can see, I’m cautiously optimistic.
…the American Dream is still a reality. Even with relatively sub-par economic performance in recent years, our economy’s overall level of output, as well as the annual growth rate, is still the envy of the developed world. …The burden of government in the United States is smaller than it is in Europe, and our markets are more open and deregulated than they are in Latin America, Asia and Africa. These features mean that poor people have considerable opportunity to climb the ladder, limited only by their talents, abilities and willingness to work hard. But things could be even better. There’s been a big expansion of government intervention under both President George W. Bush and Obama. And when government gets more power to dictate who wins and who loses in the marketplace, powerful and politically well-connected incumbents almost always reap the benefits on this cronyism. …if we can restrain the size and scope of government, there’s every reason to believe that the America Dream will be strong for the rest of the 21st century.
If the editors had allowed me more room, I would have included very powerful data showing that people in the United States have much higher living standards than their European counterparts, augmented by data from the rest of the world showing the relationship between small government and economic growth.
There were five other participants in the debate, and I’ll share their main points followed by my reactions.
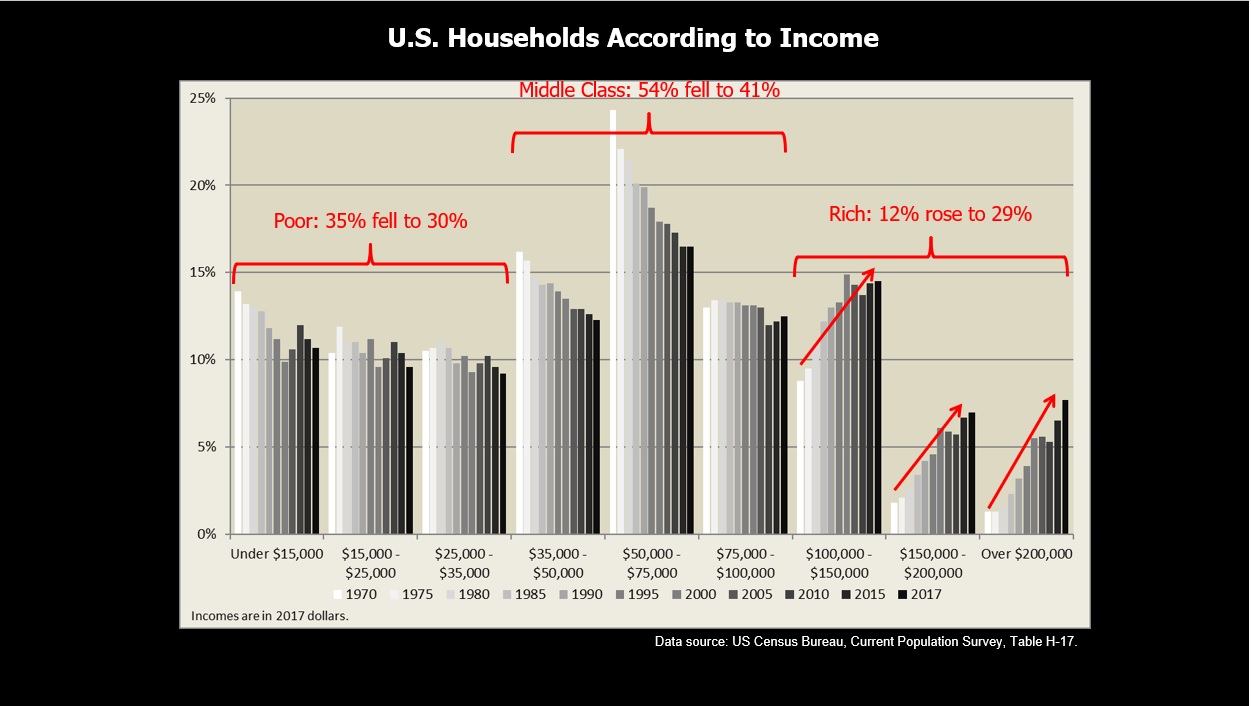
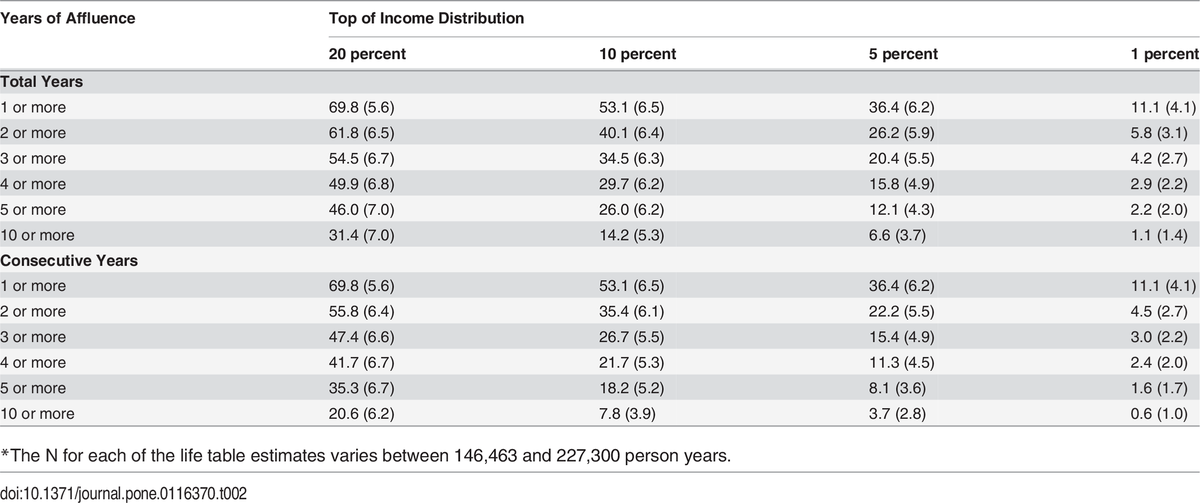
Erin Currier of Pew was somewhat pessimistic. She cited figures on relative mobility and argued that too few people climb out of poverty.
Forty-three percent of those raised in the bottom fifth of the income ladder remain there a generation later, and 40 percent of those raised at the top stay there. Just 4 percent raised at the bottom rung of the income ladder make it to the top a generation later. …Americans feel increasingly financially insecure, perhaps in part because of this lack of mobility out of the bottom rung of the economic ladder.
Maybe I’m a glass-half-full guy, but I’m wondering whether it’s actually a sign of social mobility that only 40 percent of people stay in the quintile of their parents.
Though I suppose we can’t really draw big conclusions without seeing historical patterns, adjusted for changing demographics.
Stephanie Coontz of the Council on Contemporary Families was even more pessimistic, arguing that there were positive effects from the New Deal and the Civil Rights era, but that those have now faded.
Americans are right to believe the American Dream is fading. But that dream only became a possibility for white men as a result of the labor struggles and reforms of the New Deal, and it began to extend to minorities and women only after the civil rights and women’s movements of the 1960s and 1970s. If we want to revive and achieve the American Dream, we need to change a situation in which the people whose hard work makes this country run cannot earn a living wage, while bankers, speculators and corporate elites – the real “takers” in today’s society – skim off far more than their fair share.
I largely disagree.
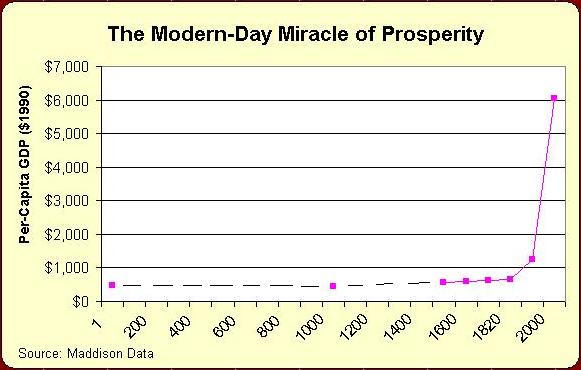
First, if you look at the amazing historical story in this video, you’ll see that prosperity soared  in the United States because of economic liberty. And you’ll see the same pattern in certain other parts of the world in this video and this video.
Moreover, the New Deal unquestionably retarded prosperity.
Professor Robin Fretwell Wilson of the University of Illinois Law School makes a good – and I assume relatively uncontroversial – point about the value of family stability.
Ask young people about their hopes, marriage and family top the list. Ask them why they cannot marry now, they say they need financial security first — to finish school, pay-off spiraling debt, get that first big job. They want a stable family life, and marriage is key. The upper class knows this; they marry in droves. For Dad, the military cleared a path to the middle class and a stable married family. What will provide that pathway now for the next generation of young men…?
I agree, at least to the degree that she’s embracing the value of social capital.
Professor Lester Spence of Johns Hopkins University focuses on some challenges for the African-America community.
The best data we have suggests that over the last 40 years upward mobility has stagnated significantly. Further, this data suggests that America fares far worse than other developed nations. …Americans in general and African-Americans in particular then have a right to be pessimistic… Even as it became painfully clear that the city of Ferguson’s policy of using policing as a municipal revenue generator is partially to blame for conditions there, city officials recently decided to increase police fines to bolster revenue shortfalls.
I don’t know the data, so I don’t know if Spence is right about stagnating mobility.
Regardless of the veracity of that data, I think the black community has been especially harmed by the initiative-sapping and family-destroying welfare state and the failings of the government school monopoly. That’s where significant gains could be achieved.
And he makes a very good point about the dangers of law enforcement being turned into a revenue-generating machine. I touched on that issue here, but read this Radley Balko article if you really want to understand how low-income people suffer as a result of greedy local governments.
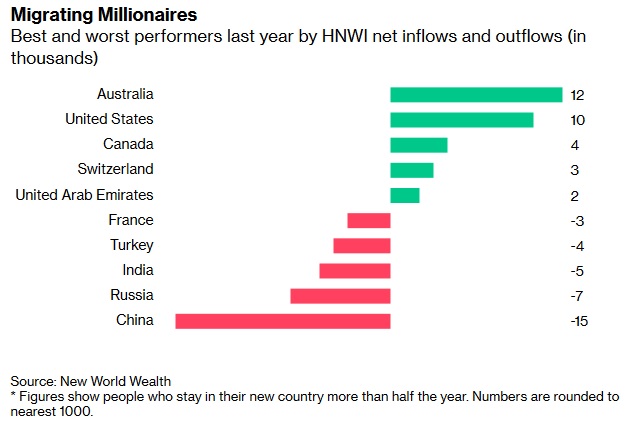
Last but not least, Professor Steven Bender of Seattle University Law School uses the example of a Mexican immigrant family to highlight the challenge of home ownership.
Homeownership is a marker for many of attainment of the American Dream. With the primacy of family wellbeing at its core, Latinos are especially motivated to become homeowners — a 2002 study found 90 percent of Latino homeowners strongly agreed that owning a home is better than renting for raising a family. …Their factory employer paying them just $7.75 despite almost 20 years of experience signals how challenging it is to grasp the brass ring of homeownership, and to repair that home, if you are a Latino immigrant family, and increasingly for anyone fighting the strong current of our swiftly rising wage and wealth inequality.
Bender makes some valid points, particularly about the importance of protecting vulnerable people from fraud, but I have a slightly more optimistic take on his story.
The couple from Mexico may face challenges, but I’m guessing that their living standards are much higher as a result of their decision to emigrate.
In other words, they’re an example of the American Dream.
No, it’s not perfect, as I acknowledged in my contribution to the debate, but it’s still real.
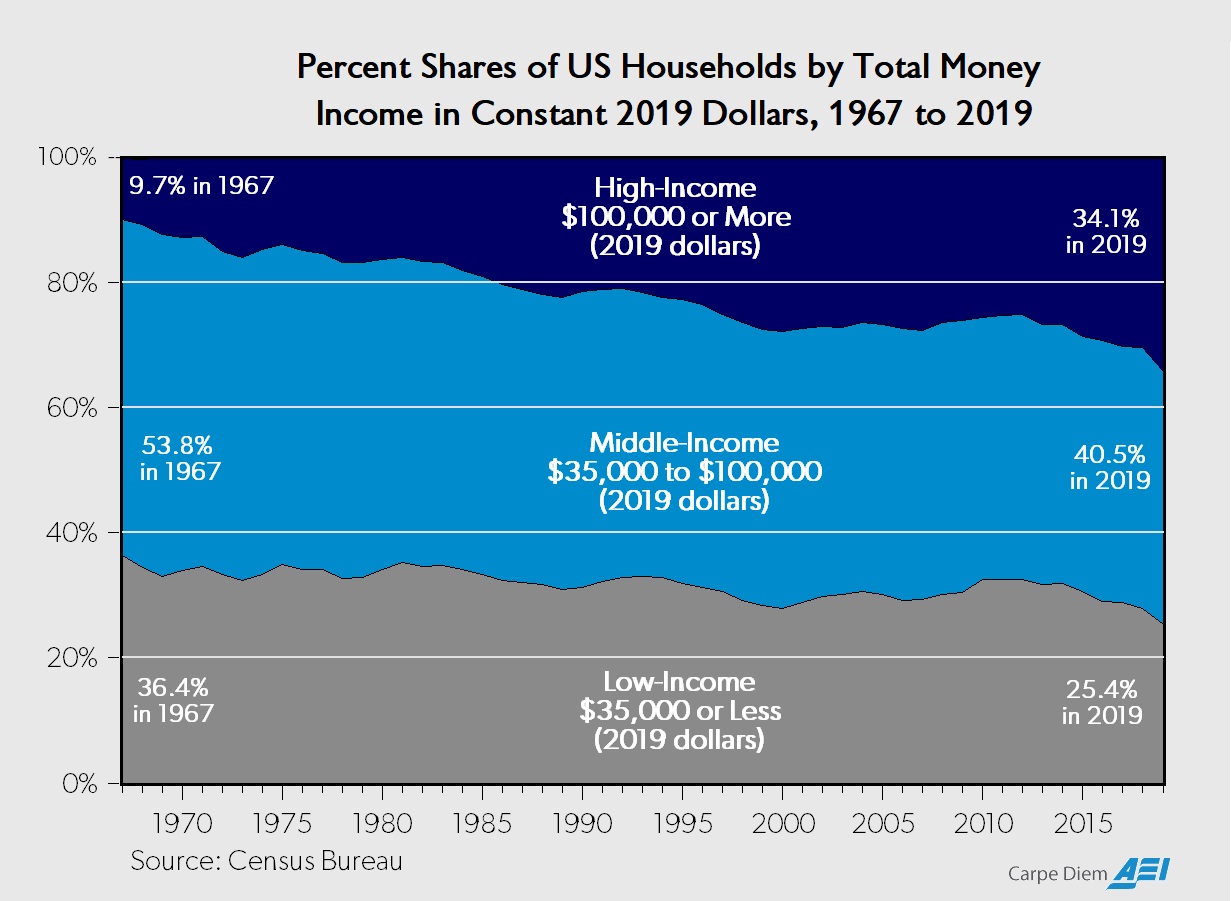
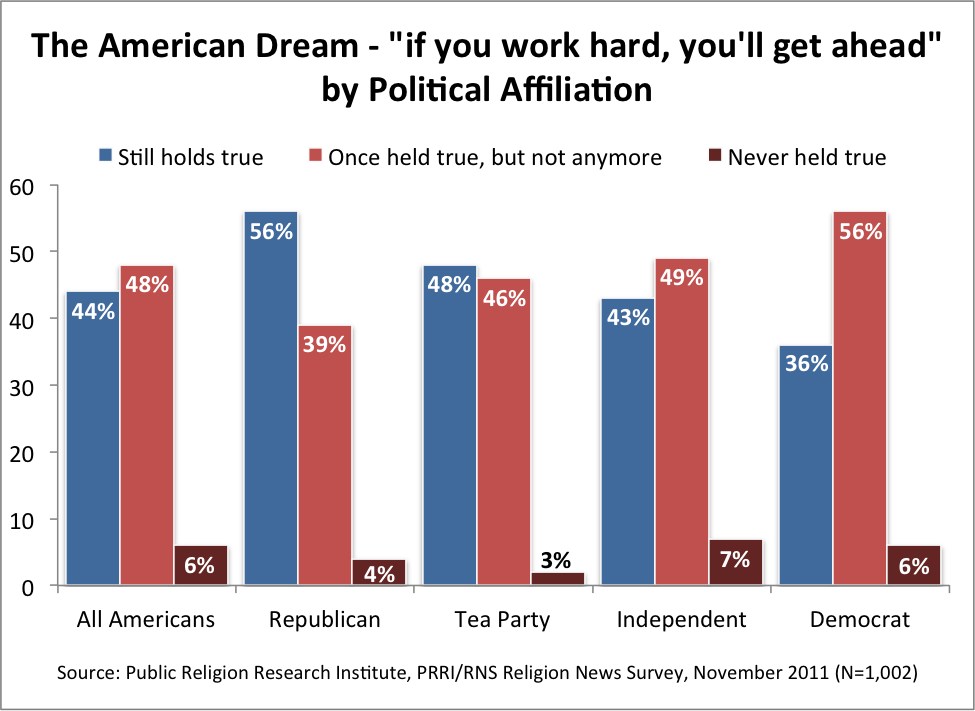
Let’s close with some polling data. Here’s a look at whether people believe that the American Dream exists.

The good news is that almost everybody agrees with the concept. The bad news is that many people believe it’s a thing of the past.
P.S. Shifting to another topic, I can’t resist offering a contrarian perspective on a recent Mona Charen column.
She said Jonathan Gruber wins the undesirable prize of having had the “worst year.”
Gruber…may well have had the worst year in American public life. His repeated demonstrations of arrogance, contempt for the American people and smug self-satisfaction brought mortification to his party and president. …all hail the verbally incontinent Gruber for revealing the truth underlying Obamacare: It would not have passed if it had been presented honestly. …Obamacare was unpopular when proposed and despised when passed, and it remains disliked to this day. Gruber’s contribution was to put a frame around its essential deception.
I don’t disagree with any of that, but I actually think Gruber had a pretty good year.
Sure, he was exposed as a despicable fraud, but he also “earned” millions of dollars as an Obamacare consultant.
In other words, he was yet another corrupt insider who used the law to line his own pockets. I suspect he’s laughing all the way to the bank.
P.P.S. Shifting gears again, I’m a big fan of political humor, even when libertarians get victimized.
And I also can appreciate clever leftist humor. And here’s a good example.

Kudos to Mr. Rogers, at least in this case. His cartoon reminds me of this Scott Stantis gem in that both rely on inadvertent responses.
Read Full Post »
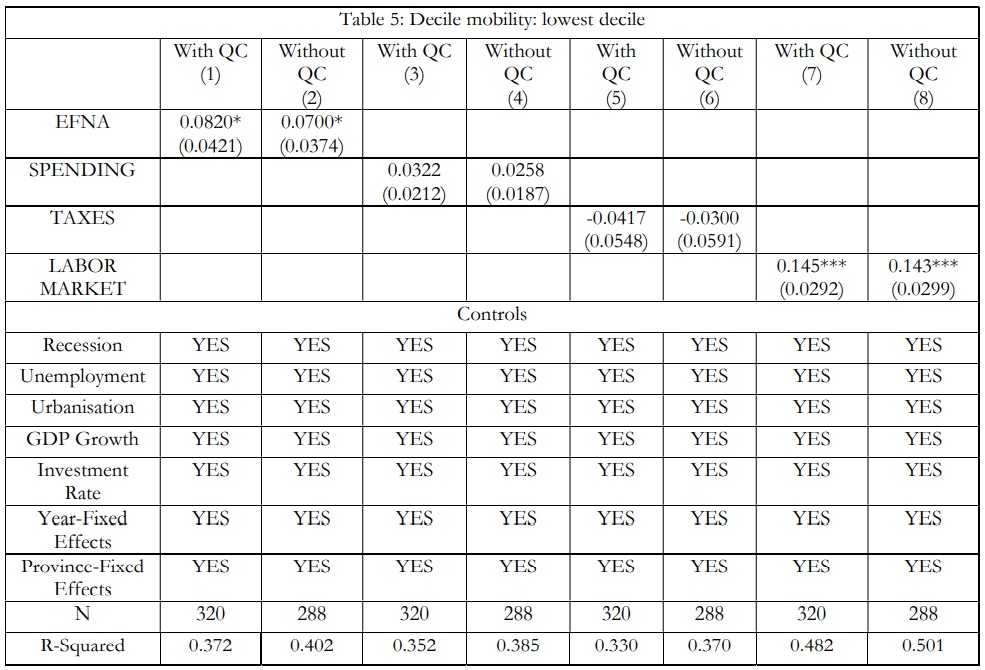
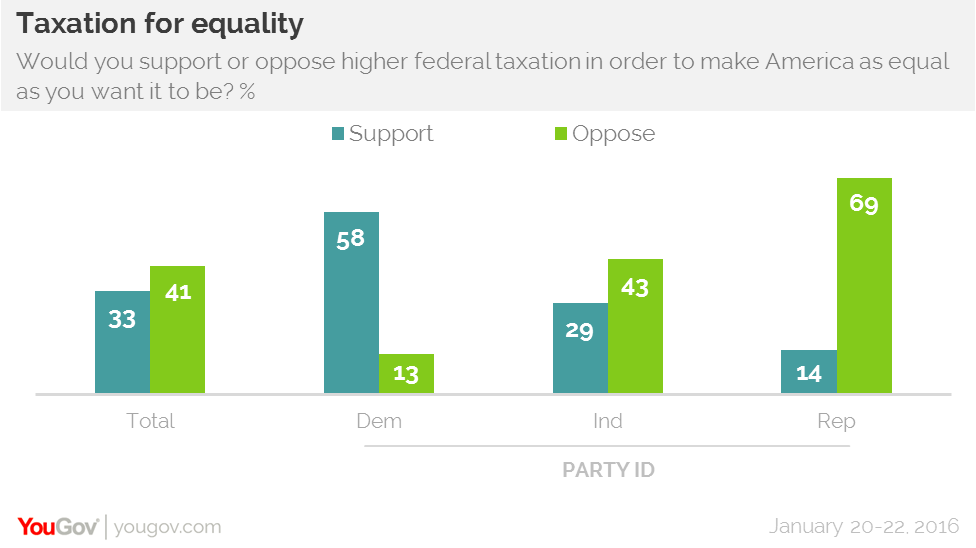
 If they were talking about equality of opportunity, or equality before the law, that would be great.
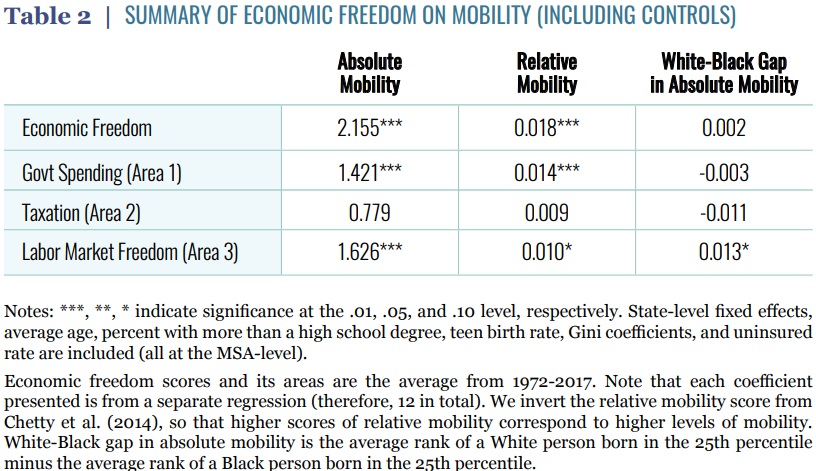
…Using the recent data of Chetty et al…on social capital and intergenerational income mobility in the United States at the subnational-level, we…ask…whether a) economic freedom does improve intergenerational mobility in a meaningful way when using higher quality data and; b) whether economic freedom complements or substitutes the different types of social capital.


 But then let’s look at what Obama


