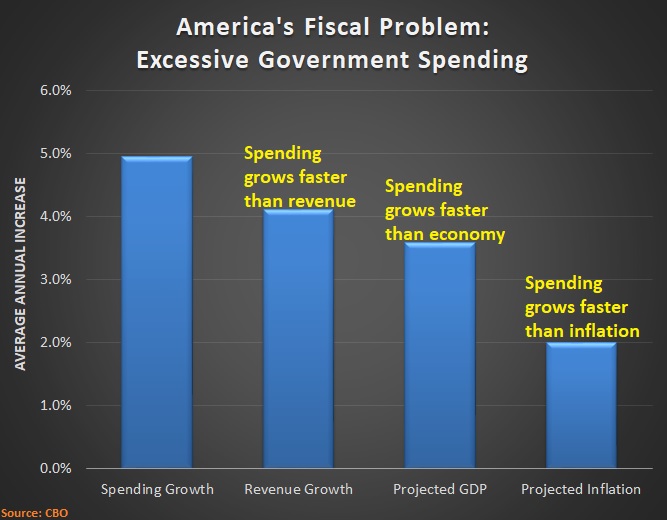
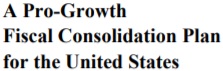
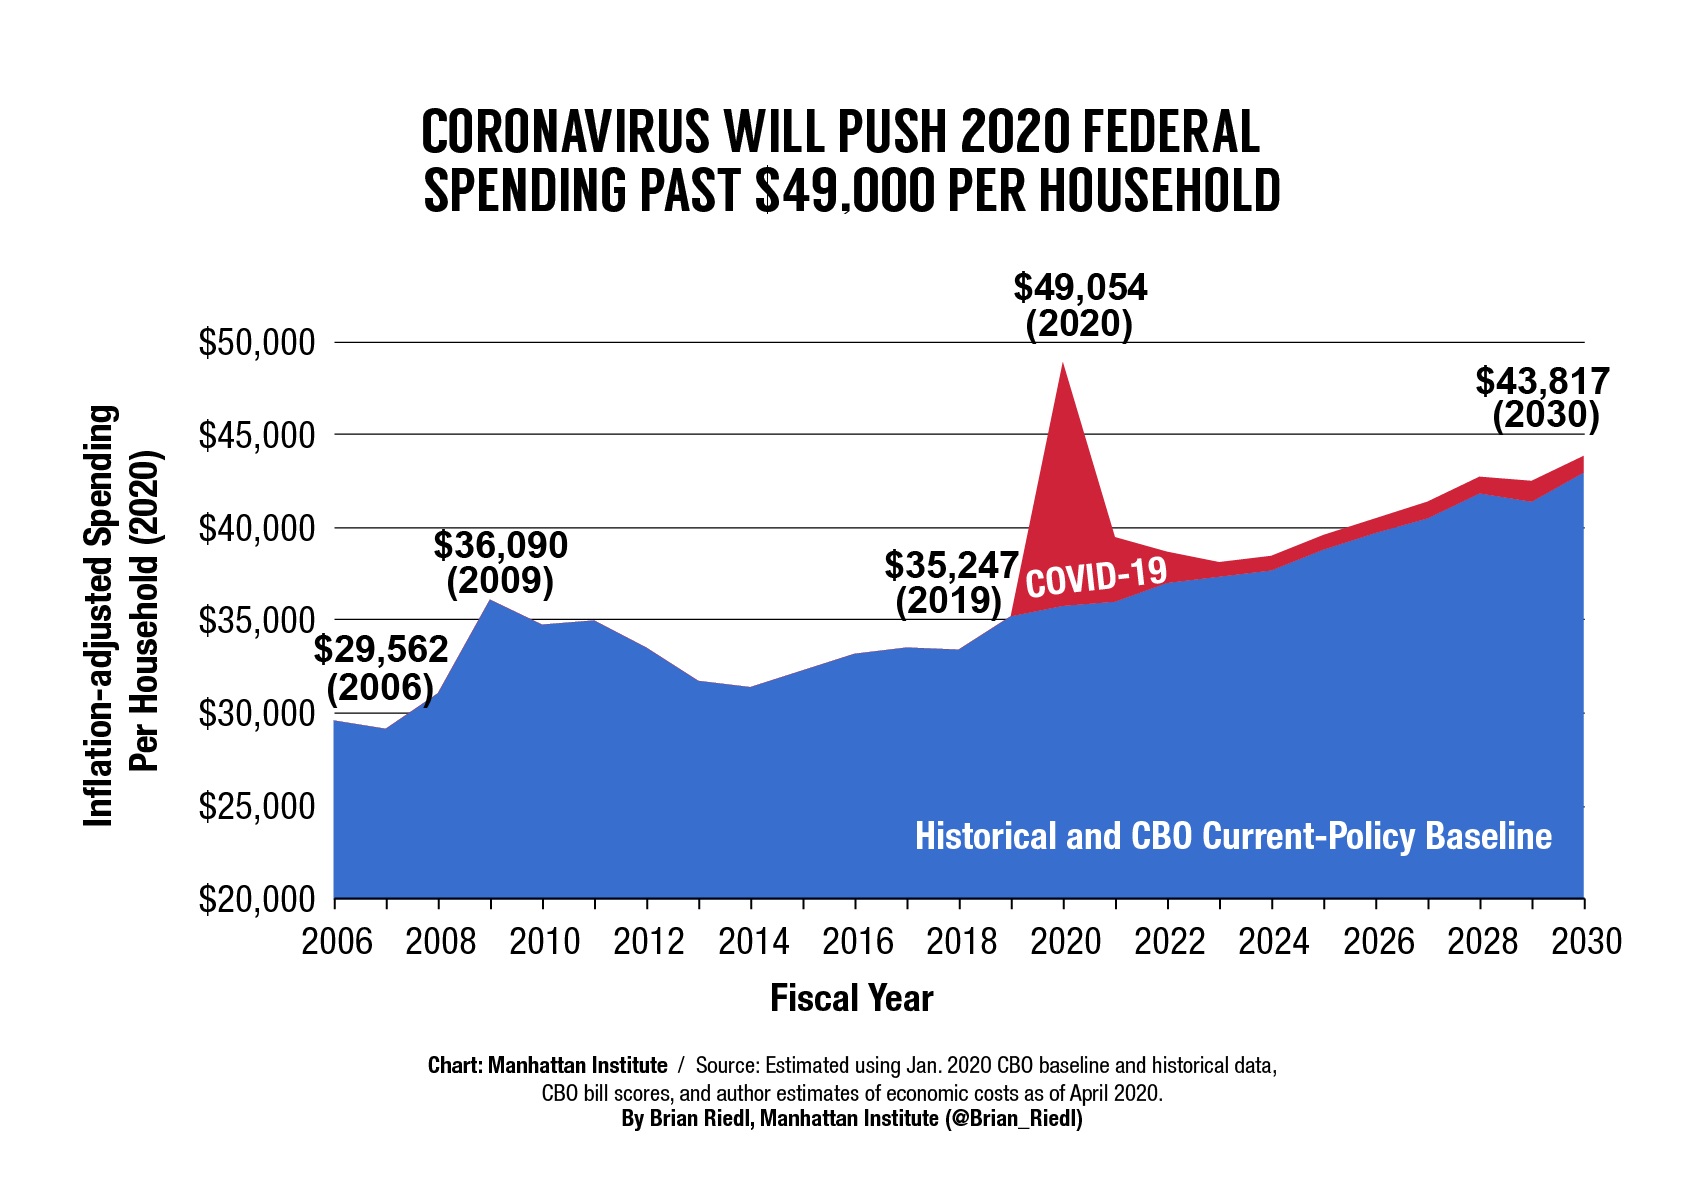
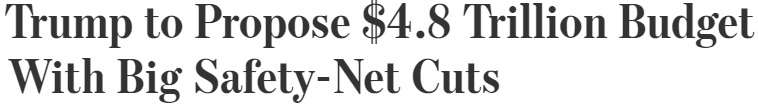
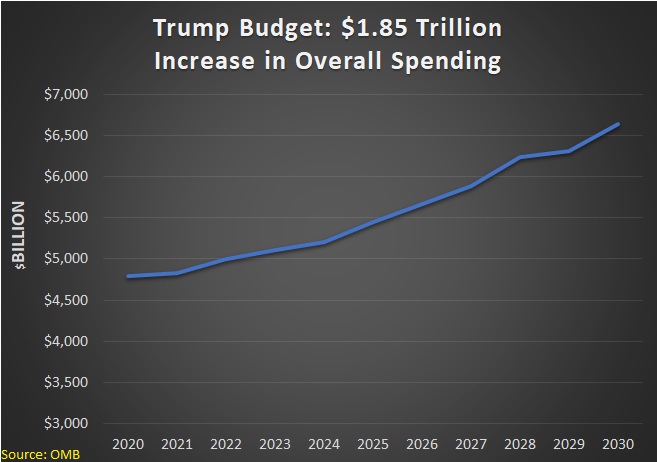
Because of changing demographics and poorly designed entitlement programs, the burden of government spending in the United States (in the absence of genuine reform) is going to increase dramatically over the next few decades.
 That bad outlook will get even worse thanks to all the coronavirus-related spending from Washington.
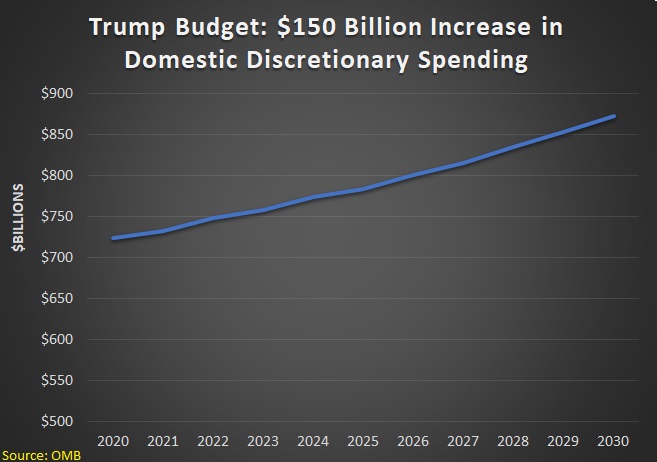
This is bad news for America since more of the economy’s output will be consumed by government, leaving fewer resources for the private sector. And that problem would exist even if all the spending was magically offset by trillions of dollars of unexpected tax revenue.
Many people, however, think the nation’s future fiscal problem is that politicians will borrow to finance that new spending. I think that’s a mistaken view, since it focuses on a symptom (red ink) rather than the underlying disease (excessive spending).
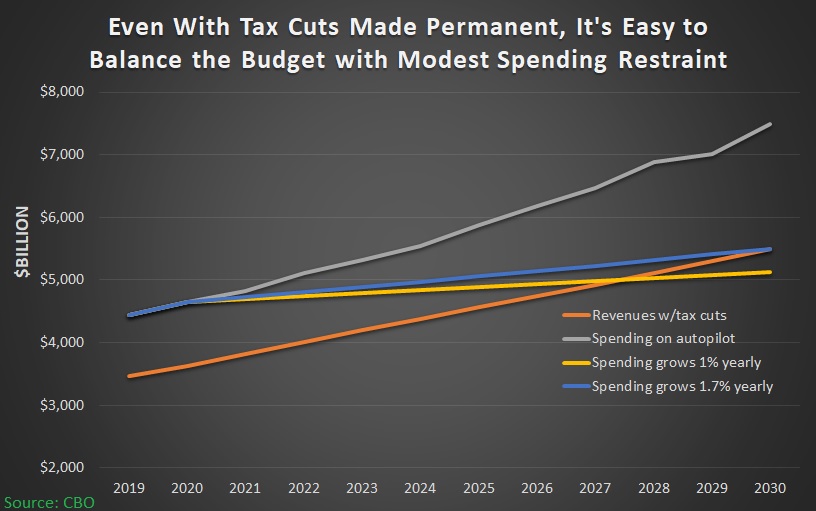
But regardless of one’s views on that issue, fiscal policy is on an unsustainable path. And that means there will soon be a fight between twho different ways of addressing the nation’s grim fiscal outlook.
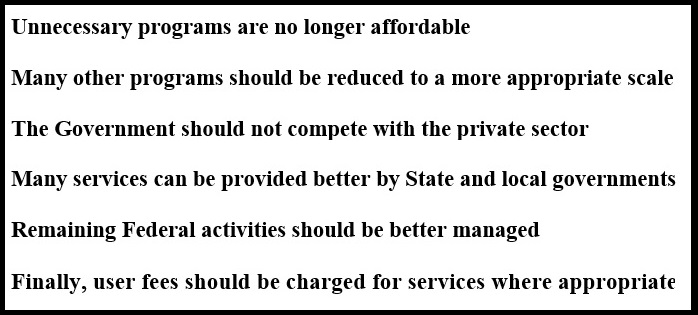
- Restrain the growth of government spending.
- Divert more money from taxpayers to the IRS.
Fortunately, we now have some new evidence to help guide policy.
A new study from the Mercatus Center, authored by Veronique de Rugy and Jack Salmon, examines what actually happens when politicians try to control debt with spending restraint or tax increases.
Here’s what the authors wanted to investigate.
Fiscal consolidation can take two forms: (1) adopting a debt-reduction package driven primarily by tax increases or (2) adopting a package  mostly consisting of spending restraint. …What policymakers might not know is which of these two forms of consolidation tend to be more effective at reining in debt levels and which are less harmful to economic performance: tax-based (TB) fiscal consolidation or expenditure-based (EB) fiscal consolidation.
Here’s their methodology.
Our analysis focuses on large fiscal consolidations, or consolidations in which the fiscal deficit as a share of GDP improves by at least 1.5 percentage points over two years and does not decrease in either of those two years. …A successful consolidation is defined as one in which the debt-to-GDP ratio declines by at least 5 percentage points three years after the adjustment takes places or by at least 3 percentage points two years after the adjustment. …Episodes in which the consolidation is at least 60 percent revenue increases are labeled TB, and episodes in which the consolidation is at least 60 percent spending decreases are labeled EB.
And here are their results.
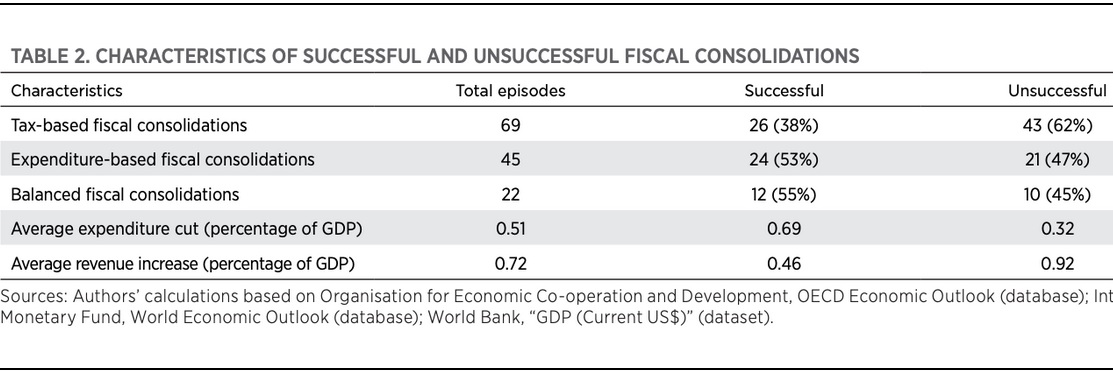
…of the 45 EB episodes, more than half were successful, while of the 67 TB episodes, less than 4 in 10 were successful. …The results in table 2 show that while in unsuccessful adjustments most (74 percent) of the changes are on the revenue side, in successful adjustments most (60 percent) of the changes are on the expenditure side. In successful adjustments, for every 1.00 percent of GDP increase in revenues, expenditures are cut by 1.50 percent. By contrast, in unsuccessful adjustments, for every 1.00 percent of GDP increase in revenues, expenditures are cut by less than 0.35 percent. From these findings we conclude that successful fiscal adjustments are those that involve significant spending reductions with only modest increases in taxation. Unsuccessful fiscal adjustments, however, typically involve significant increases in taxation and very modest spending reductions.
Table 2 summarizes the findings.
As you can see, tax increases are the least effective way of dealing with the problem. Which makes sense when you realize that the nation’s fiscal problem is too much spending, not inadequate revenue.

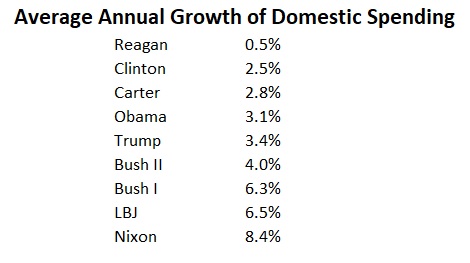
In my not-so-humble opinion, I think the table I prepared back in 2014 is even more compelling.
Based on IMF data, it shows nations that imposed mutli-year spending restraint  and how that fiscally prudent policy generated very good results – both in terms of reducing the spending burden and lowering red ink.
When I do debates at conferences with my left-wing friends, I almost always ask them to show me a similar table of countries that achieved good results with tax increases.
Needless to say, none of them have ever even attempted to prepare such a list.
That’s because nations that repeatedly raise taxes – as we’ve seen in Europe – wind up with more spending and more debt.
In other words, politicians pull a bait-and-switch. They claim more revenue is needed to reduce debt, but they use any additional money to buy votes.
Which is why advocates of good fiscal policy should adamantly oppose any and all tax increases.
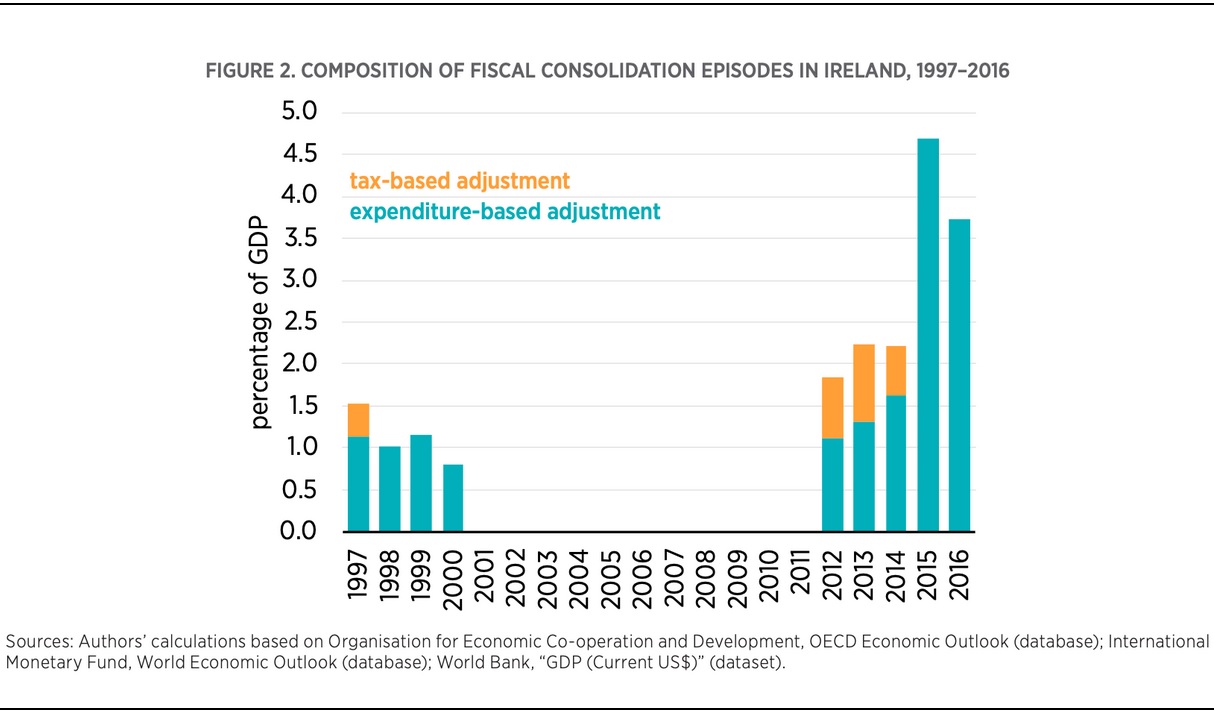
Let’s close by looking at two more charts from the Mercatus study.
Here’s a look at how Irish politicians have mostly chose to restrain spending.

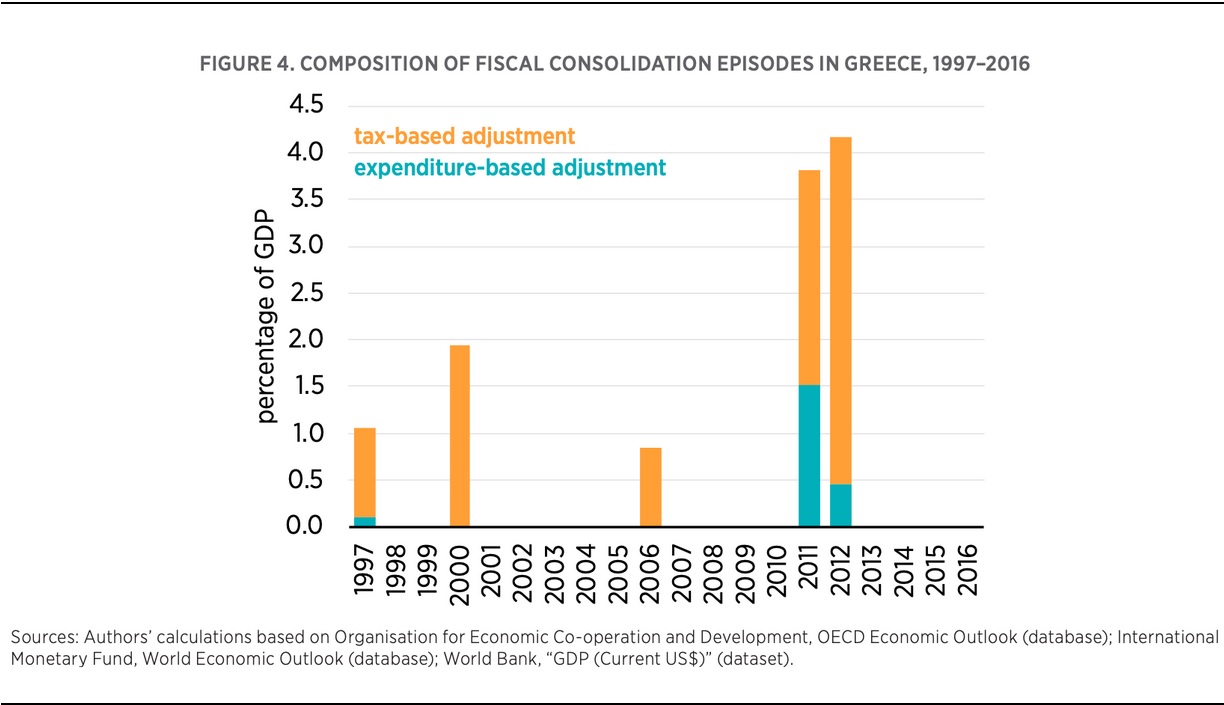
And here’s a look at how Greek politicians have mostly opted for tax increases.

It goes without saying (but I’ll say it anyhow) that the Greek approach has been very unsuccessful.
P.S. For fiscal wonks, one of the best parts of the Mercatus study is that it cites a lot of academic research on the issue of fiscal consolidation.
Scholars who have conducted research find – over and over again – that spending restraint works.
In a 1995 working paper, Alberto Alesina and Roberto Perotti observe 52 efforts to reduce debt in 20 Organisation for Economic Co-operation and Development (OECD) countries between 1960 and 1992. The authors define a successful fiscal adjustment as one in which the debt-to-GDP ratio declines by at least 5 percentage points three years after the adjustment takes place. In successful adjustments, government spending is reduced by almost 2.2 percent of gross national product (GNP) and taxes are increased by less than 0.5 percent of GNP. For unsuccessful adjustments, government expenditure is reduced by less than 0.5 percent of GNP and taxes are increased by almost 1.3 percent of GNP. These results suggest that successful fiscal adjustments are those that cut spending and include very modest increases in taxation.
International Monetary Fund (IMF) economists John McDermott and Robert Wescott, in a 1996 paper, examine 74 episodes of fiscal adjustment in which countries attempted to address their budget gaps. The authors define a successful fiscal adjustment as a reduction of at least 3 percentage points in the ratio of gross public debt to GDP by the second year after the end of an adjustment. The authors then divide episodes of fiscal consolidation into two categories: those in which the deficit was cut primarily (by at least 60 percent) through revenue increases, and those in which it was reduced primarily (by at least 60 percent) through expenditure cuts. Of the expenditure-based episodes of fiscal consolidation, almost half were successful, while of the tax-based episodes, less than one out of six met the criteria for success.
Jürgen von Hagen and Rolf Strauch observe 65 episodes in 20 OECD countries from 1960 to 1998 and define a successful adjustment as one in which the budget balance stands at no more than 75 percent of the initial balance two years after the adjustment period. …it does find that successful consolidations consist of expenditure cuts averaging more than 1.2 percent of GDP, while expenditure cuts in unsuccessful adjustments are smaller than 0.3 percent of GDP. The opposite pattern is true for revenue-based adjustments: successful consolidations consist of increases in revenue averaging around 1.1 percent, while unsuccessful adjustments consist of revenue increases exceeding 1.9 percent.
American Enterprise Institute economists Andrew Biggs, Kevin Hassett, and Matthew Jensen examine over 100 episodes of fiscal consolidation in a 2010 study. The authors define a successful fiscal adjustment as one in which the debt-to-GDP ratio declines by at least 4.5 percentage points three years after the first year of consolidation. Their study finds that countries that addressed their budget shortfalls through reduced spending burdens were far more likely to reduce their debt than countries whose budget-balancing strategies depended upon higher taxes. …the typical successful adjustment consists of 85 percent spending cuts and just 15 percent tax increases.
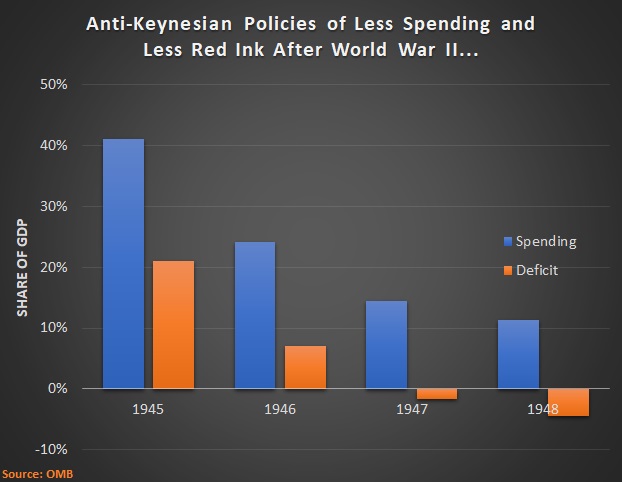
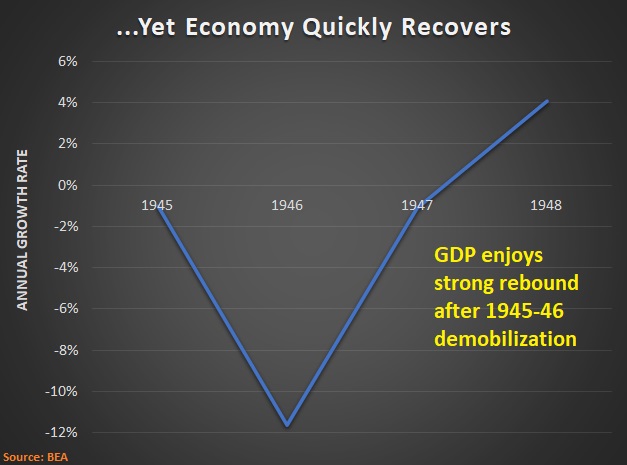
In a 1998 Brookings Institution paper, Alberto Alesina and coauthors reexamined the research on the economic effects of fiscal adjustments. Using data drawn from 19 OECD countries, the authors assess whether the composition of fiscal adjustments results in different economic outcomes… Contrary to the Keynesian view that fiscal adjustments are contractionary, the results of this study suggest that consolidation achieved primarily through spending reductions often has expansionary effects.
Another study that observes which features of fiscal adjustments are more or less likely to predict whether the fiscal adjustment is contractionary or expansionary is by Alesina and Silvia Ardagna. Using data from 20 OECD countries during 1960 to 1994, the authors label an adjustment expansionary if the average GDP growth rate in the period of adjustment and in the two years after is greater than the average value (of G7 countries) in all episodes of adjustment. …The authors conclude, “The composition of the adjustment appears as the strongest predictor of the growth effect: all the non-expansionary adjustments were tax-based and all the expansionary ones were expenditure-based.”
French economists Boris Cournède and Frédéric Gonand adopt a dynamic general equilibrium model to compare the macroeconomic impacts of four debt reduction scenarios. Results from the model suggest that TB adjustments are much more costly than spending restraint when policymakers are attempting to achieve fiscal sustainability. Annual consumption per capita would be 15 percent higher in 2050 if consolidation were achieved through spending reductions rather than broad tax increases.
In a review of every major fiscal adjustment in the OECD since 1975, Bank of England economist Ben Broadbent and Goldman Sachs economist Kevin Daly found that “decisive budgetary adjustments that have focused on reducing government expenditure have (i) been successful in correcting fiscal imbalances; (ii) typically boosted growth; and (iii) resulted in significant bond and equity market outperformance. Tax-driven fiscal adjustments, by contrast, typically fail to correct fiscal imbalances and are damaging for growth.”
Economists Christina and David Romer investigated the impact of tax changes on economic activity in the United States from 1945 to 2007. The authors find that an exogenous tax increase of 1 percent of GDP lowers real GDP by almost 3 percent, suggesting that TB adjustments are highly contractionary.
…the IMF released its annual World Economic Outlook in 2010 and included a study on the effects of fiscal consolidation on economic activity. The results of studying episodes of fiscal consolidation for 15 OECD countries over three decades…reveals that EB fiscal adjustments tend to have smaller contractionary effects than TB adjustments. For TB adjustments, the effect of a consolidation of 1 percent of GDP on GDP is −1.3 percent after two years, while for EB adjustments the effect is just −0.3 percent after two years and is not statistically significant. Interestingly, TB adjustments also raise unemployment levels by about 0.6 percentage points, while EB adjustments raise the unemployment rate by only 0.2 percentage points.
…a 2014 IMF study…estimates the short-term effect of fiscal consolidation on economic activity among 17 OECD countries. The authors of the IMF study find that the fall in GDP associated with EB consolidations is 0.82 percentage points smaller than the one associated with TB adjustments in the first year and 2.31 percentage points smaller in the second year after the adjustment.
Focusing on the fiscal consolidations that followed the Great Recession, Alesina and coauthors…find that EB consolidations are far less costly for economic output than TB adjustments. They also find that TB adjustments result in a cumulative contraction of 2 percent of GDP in the following three years, while EB adjustments generate very small contractions with an impact on output not significantly different from zero.
A study by the European Central Bank in 2018…finds that macroeconomic responses are largely caused by differences in the composition of the adjustment plans. The authors find large and negative multipliers for TB adjustment plans and positive, but close to zero, multipliers for EB plans. The composition of adjustment plans is found to be the largest contributor to the differences in economic performance under the two types of consolidation plans.
The bottom line is that nations enjoy success when they obey fiscal policy’s Golden Rule. Sadly, that doesn’t happen very often because politicians focus mostly on buying votes in the short run rather than increasing national prosperity in the long run.
Read Full Post »
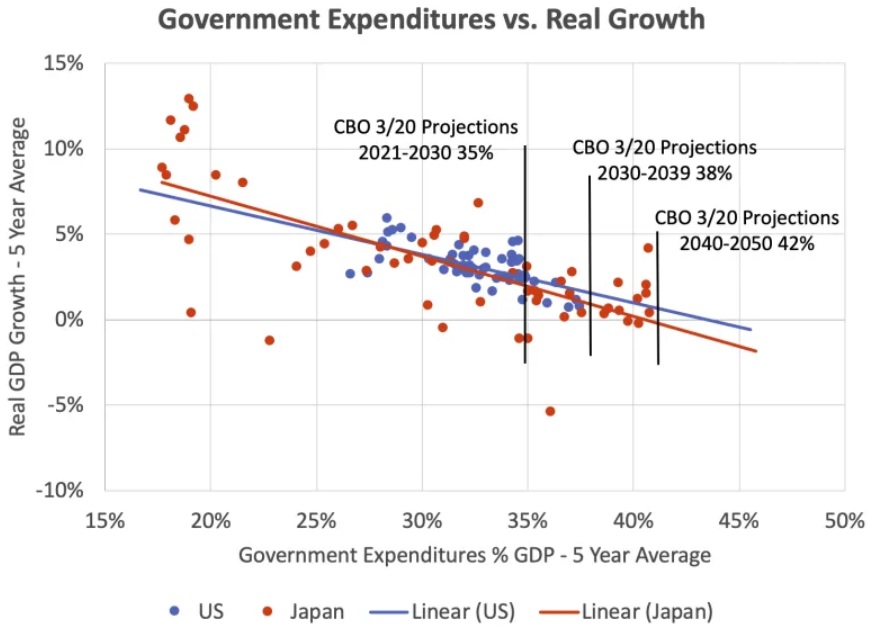
 predicting that a bigger burden of government spending somehow will produce additional growth.
…Moody’s Analytics economists Mark Zandi and Bernard Yaros…see the higher government spending a Biden administration would approve — for emergency relief programs, infrastructure, and an expanded social safety net — giving the economy a potent injection of stimulus. …while a Biden administration would seek to offset some of his proposed $7.3 trillion in new spending over the next decade with $4.1 trillion in higher taxes on corporations and the wealthy, “the net of these crosscurrents is to boost economic activity,” the economists write.

…Paul Krugman explained in August that “I’ve been doing the math, and it’s terrifying. . . . Their spending will fall by a lot . . . [and there is] a substantial ‘multiplier’ effect, as spending cuts lead to falling incomes, leading to further spending cuts.” GDP could fall 4 to 5 percent, and perhaps as much as ten percent… Wednesday the Census Bureau’s advance retail-sales report provided our first extensive look at consumer spending in August, which is the first month with reduced benefits (reduced roughly $50 billion for the month). Did consumer spending drop by tens of billions, starting our economy on the promised path toward recession?