Let’s consider some good news about America.
Some folks on the left like to claim that the middle class is shrinking and that therefore we need bigger government and more redistribution to protect these Americans from falling into poverty.
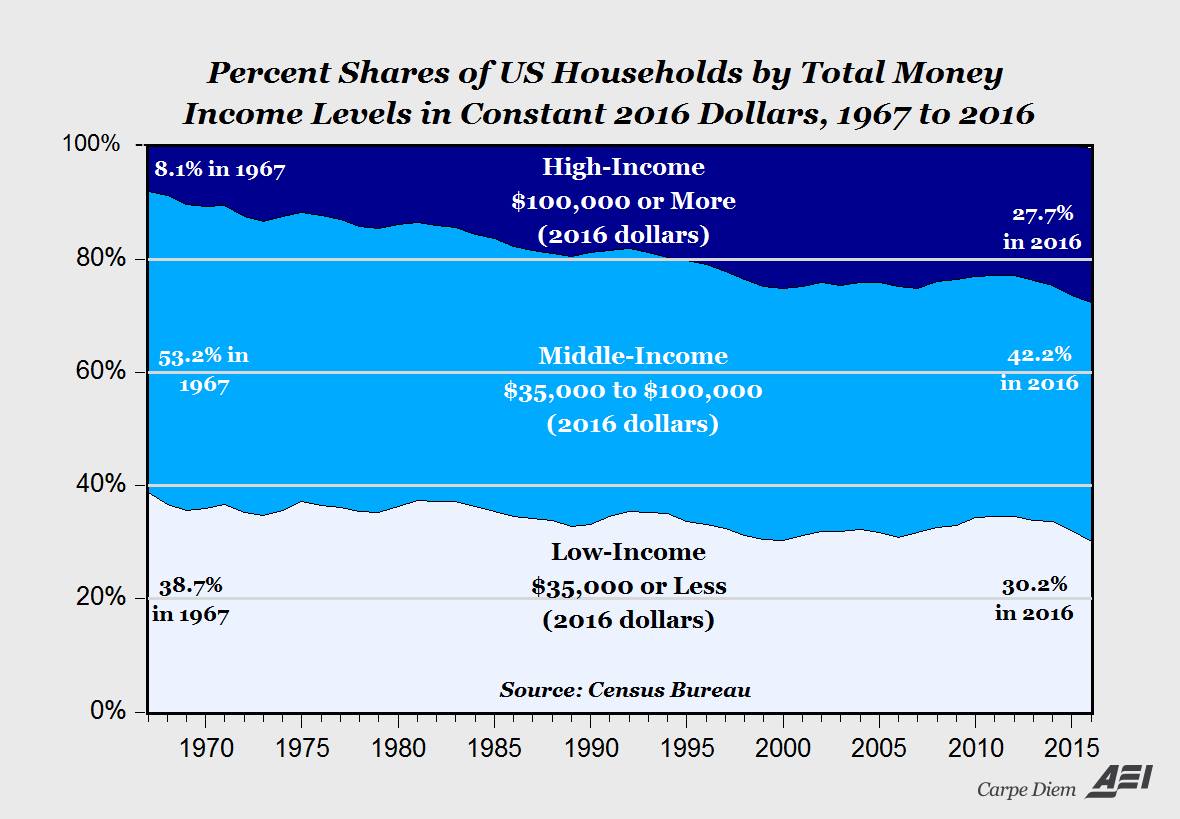
Well, the first half of that statement is true. The middle class is becoming smaller. But here’s the good news. As I noted in 2015 when sharing some data from Pew, the middle class is shrinking because more and more households are earning six-figure incomes.
Now we have more confirmation. Courtesy of Mark Perry of the American Enterprise Institute, here’s a nice chart based on data from the Census Bureau’s new report on income and poverty in the United States.
Want to feel even better?
In a column for CNBC, Professor Daniel Smith of Troy University explains that government data understates the improvements in living standards. He points out that total compensation has increased much faster than wages.
Complaints that the rich are getting richer while the majority have hit a brick wall in wage growth have led to calls to impose regulations and taxes aimed at creating a “fair” economy. This mantra, however, is wrought with holes and erroneous interpretation of the data…
Over the last few decades, employees have been receiving an increasingly larger portion of their overall compensation in the form of benefits such as health care, paid vacation time, hour flexibility, improved work environments and even daycare. …Total compensation, which adds these benefits to wages and salaries, shows that earnings have actually increased more than 45 percent since 1964.
And he notes that income gains are understated if measured against the PCE index rather than the consumer price index.
Furthermore, “purchasing power,” the amount of stuff people can buy with each dollar, has changed dramatically… CPI is notorious for overstating inflation, and thus understating the growth of real wages received by workers. Adjusting the data with the more appropriate Personal Consumption Expenditure index brings the growth in average hourly wages from 5.58 percent to more than 35 percent and the growth in total compensation of employees from more than 45 percent to more than 87 percent.
The bottom line is we’re able to buy more and better for less work.
But even that index fails to grasp the drastic increase in what workers get for their wages. …100.5 hours of work was required to purchase a washing machine in 1959 compared to just 23.3 hours of work (for the average worker) in 2013. Purchasing a TV demanded an astounding 127.8 hours of work in 1959, whereas a worker in 2013 could purchase one with only 20.7 hours of work. Moreover, the improved quality of these goods over the past few decades is staggering. …Today’s iPhones and other smart-phone models seem like a different species from their predecessors… We’ve seen the same progress in knee-replacement surgeries, computers, the Internet, vacuum cleaners, and other technologies we’ve come to rely on.
Professor Smith wrote this piece back in 2014, but these arguments apply just as well today as they did back then.
Though I don’t want to be a Pollyanna. There are very worrisome trends in our economy, especially increased dependency and reduced labor force participation.
So if you prefer to look at the glass as being half empty, Nicholas Eberstadt of the American University authored an article that is very pessimistic assessment about recent trends.
It turns out that the year 2000 marks a grim historical milestone of sorts for our nation. For whatever reasons, the Great American Escalator, which had lifted successive generations of Americans to ever higher standards of living and levels of social well-being, broke down around then—and broke down very badly.
…it should be painfully obvious that the U.S. economy has been in the grip of deep dysfunction since the dawn of the new century. …It took America six and a half years—until mid-2014—to get back to its late 2007 per capita production levels. And in late 2016, per capita output was just 4 percent higher than in late 2007—nine years earlier. By this reckoning, the American economy looks to have suffered something close to a lost decade. …Between 2000 and 2016, per capita growth in America has averaged less than 1 percent a year. To state it plainly: With postwar, pre-21st-century rates for the years 2000–2016, per capita GDP in America would be more than 20 percent higher than it is today. …If 21st-century America’s GDP trends have been disappointing, labor-force trends have been utterly dismal. Work rates have fallen off a cliff since the year 2000 and are at their lowest levels in decades.
I don’t disagree with any of this. Growth has been weak this century.
Which is hardly a surprise since we’ve seen an erosion of economic liberty (thanks Bush and Obama!).
But I also want to keep things in perspective. Weak growth is better than no growth. Our living standards are increasing, even if they could – and should – be rising at a faster clip.
So let me swing back to the Pollyanna side by sharing a chart which ostensibly is bad news because it shows rising inequality. But I view it as good news because it shows that all of us are at least 40 percent richer – in real terms – than we were back around 1980.

By the way, Thomas Sowell has pointed out that higher-income households tend to do better because they have more people working, while lower-income households feature lots of dependency. Moreover, if Professor Smith and others are right, the increase in living standards is far greater than what this chart shows anyhow. But even if you accept this data at face value, we are all getting richer over time.
Yes, growth rates should be faster and incomes should be climbing more rapidly. Especially at the bottom. Whether you look at global data or country-specific data, that’s an argument for free markets and small government.
As I wrote last year, we don’t need perfect policy to get more prosperity. Just give the private sector some breathing room.

[…] Instead, more and more households are earning above $100,000. […]
[…] There’s also data on how incomes have expanded over time for both the United States and the entire […]
[…] it shrank because a greater share of the population became […]
[…] generally don’t write much about the distribution of income (most-recent example from 2017), largely because that feeds into the false notion that the economy is a fixed pie and […]
[…] generally don’t write much about the distribution of income (most-recent example from 2017), largely because that feeds into the false notion that the economy is a fixed pie and […]
[…] numbers undercount compensation because fringe benefits such as healthcare are excluded. This is a very legitimate complaint, but it doesn’t change the fact that all income quintiles tend to rise and fall together. For […]
[…] numbers under-count compensation because fringe benefits such as healthcare are excluded. This is a very legitimate complaint, but it doesn’t change the fact that all income quintiles tend to rise and fall together. For […]
[…] numbers under-count compensation because fringe benefits such as healthcare are excluded. This is a very legitimate complaint, but it doesn’t change the fact that all income quintiles tend to rise and fall together. For […]
Reblogged this on Elementary Politics News.
Yes, but we’re not becoming prosperous as fast as if we had bigger government — which would conscript the energy wasted in competition and invest it in directed cooperation. Do we?
And isn’t it better to be all equal, as in Cuba, where nobody has a washing machine? There are psychological, non-pecuniary benefits to equality. Even equality in poverty.
Meanwhile back in the real world…
How many days of work does it take to buy a cure for pancreatic cancer today? Answer: Infinite. There’s no cure.
And in a world that grows by four percent the cure may come in, say, 2040. While in a French world growing at one percent you may have to wait until 2080. That’s “a few lives” lost to the equality of slow growth — and it’s only a tiny fraction of total foregone benefit.
It’s hard for people/voters to miss what has not yet happened what has not yet been developed. Only after the fact we wonder how did we ever live without it.
We all have miserable, short and pathetically poor lives by the standards of the (not so distant) future. The objective is to get to the future as fast as possible. That means three things: growth, growth, and growth.
This is a new human era. An era of sustained three to four percent world growth, and accelerating! We are bound to see ever bigger changes in ever shorter amounts of time as time goes by. Are you ready? Are you ready to see the pie explode? Or are you obsessed with its partition? Wake up voter/lemming! Or, led by defeatist hippies, you will be obsolete in a few short decades.
Rising inequalities are inherent in the fact that innovation has a lot more and a lot faster leverage than in the past. New products reach staggeringly more people ever faster. Go against that reality, go against those who most affect the rising prosperity of billions, and you forego trillions of compounding growth. Get over it, and get on with it. Life will get better at an ever faster rate the more we lay off our hands from those who can benefit us most.
America’s troubles are encapsulated in the fact that America, for most of its history, when government whether growing fast or slow had not accumulated to the size prevalent in the rest of the world, grew faster than the rest of the world. Now that the entire world has sped up America has not only failed to keep up, but even slowed down in growth — and the average American voter-lemming has aspirations to become France, a one percent trendline growth nation where citizens give over fifty percent of their vitality to government for welfare and infrastructure. That is the American political leading indicator of demise.
No, life will not get worse in absolute terms, even under the worst statist scenario. But Francified Americans will go from being world prosperity leaders to average and then to laggards in short order. A few numbers: A current American per capita GDP of $57.5k and an average world per capita GDP of $16.1k. A world growing at 3.5% (and likely accelerating) will reach parity with a Francified United States, growing at one percent, by 2069 and by the end of the century the average Francified American will only earn 48% of what the average world citizen earns. Excellence that took two centuries to build will be squandered in a few decades.
Of course the malaise of slow growth will come much sooner. Come to think of it, its already here more or less. And with a serious growth deficit compared to world average, American malaise will increase soon. In typical suicide fashion, the voter lemmings of most nations proceed to suicide when faced with this situation. They start feeling desperate and vote for more government help. QED, RIP.
Get ready to emigrate. National ascents and declines that used to take centuries in the slow growing world of the past will now conclude in a few decades. Pitchforks and national demises will come in a flash. So will spectacular growth ascents from poverty to prosperity.
Stay mobile!
Maybe I’m missing something here but the charts show an unusual gap between the different groups. Perhaps the sticking point is the household measure rather than each individual worker. Using this household measure I assume that a family of ten would rank in the top 1% even if earning a low wage. Sorry but that appears be at best a false measure.
When someone can explain to me why a football player in five years will earn more than a heart surgeon does in a lifetime maybe I’ll understand. I’ll understand when someone can explain why a lawyer receives more fees than an individual who losses both legs in an industrial accident.
The “top 1%” scam is completely false. First the top 1% is not made up of the same people from year to year and certainly not over any extended period of time. Sure there are a few people who are wealthy enough to remain for a considerable length of time in the top earners category but then again I’d like to see how Nelson and Bunker Hunt fared through the 80s LOL!
Many, if not most, of the 1% are people who for one reason or another have a single or a few very high earning years. They sell the business they have built over a lifetime, they sell real estate that has appreciated greatly as they near retirement or some even win the lottery! To suggest that one group of high earners has garnered most of the income gains over the last 40 years is just false and needs to be shot down at every opportunity.
Great work.
As a suggestion/addition to this great article.
The average household size in 1960 was 3.3 persons per household; in 1970 it was 3.14; in 2016, it is 2.53 per household. https://www.statista.com/statistics/183648/average-size-of-households-in-the-us/
If you adjust the household income by the people in the household, the income gains are much more significant.
To put numbers to this: when we adjust for the number of people in a household, earning $28,000 per year in 2016 is the equivalent of earning $35,400 in 1964. In other words, when we adjust for household size, the boundary for the middle-income class would be $27,700 – and a MUCH greater percentage of people would in the middle class, further shrinking the lower-income class.
Similarly, when we adjust for household size, any household earning over $79,000 in 2016 would be earning the equivalent of over $100,000 in 1964 and would qualify as upper-income earners.