Feeds:
Posts
Comments

Posts Tagged ‘Dynamic Scoring’

I’m a long-time advocate of “dynamic scoring,” which means I want the Congressional Budget Office and Joint Committee on Taxation to inform policy makers about how fiscal policy changes can impact overall economic performance and therefore generate “feedback” effects.

I also think the traditional approach, known as “static scoring,” creates a bias for bigger government because it falsely implies that ever-higher tax rates and an ever-growing burden of government spending don’t have any adverse impact on prosperity.

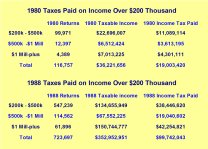
There’s a famous example to show the lunacy of static scoring. Back in late 1980s, former Oregon Senator Bob Packwood asked the Joint Committee on Taxation to estimate the revenue impact of a 100 percent tax rate on income over $200,000.

When considering such a proposal, any normal person with even the tiniest amount of common sense is going to realize that successful people quickly will figure out it makes no sense to either earn or report income about that level. As such, the government won’t collect any additional revenue.

Heck, it’s not just that the government won’t collect additional revenue. Our normal person with a bit of common sense is going to take the analysis one step further and conclude that revenues will plunge, both because the government will lose the money it collected with the old income tax rates on income above $200,000 (i.e., the income that will disappear) and also because there will be all sorts of additional economic damage because of foregone work, saving, investment, and entrepreneurship.

But the JCT apparently didn’t have any bureaucrats with a shred of common sense. Because, as shown in Part II of my video series on the Laffer Curve, they predicted that such a tax would raise $104 billion in 1989, rising to $299 billion in 1993.

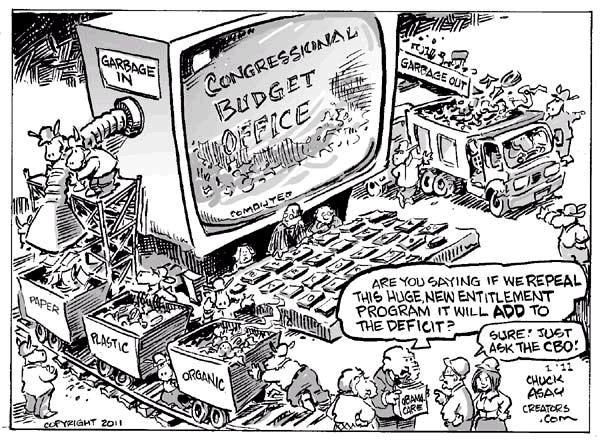
The good news is that both CBO and JCT are now seeking to incorporate some dynamic scoring into their fiscal estimates. Most recently, the CBO (with help from the JCT) released a report on the fiscal impact of repealing Obamacare.

Let’s look at what they did to see whether the bureaucrats did a good job.

I’ll start with something I don’t like. This new CBO estimate is fixated on the what will happen to deficit levels.

Here’s the main chart from the report. It compares what will happen to red ink if Obamacare is repealed, based on the static score (no macro feedback) and the dynamic score (with macro feedback).

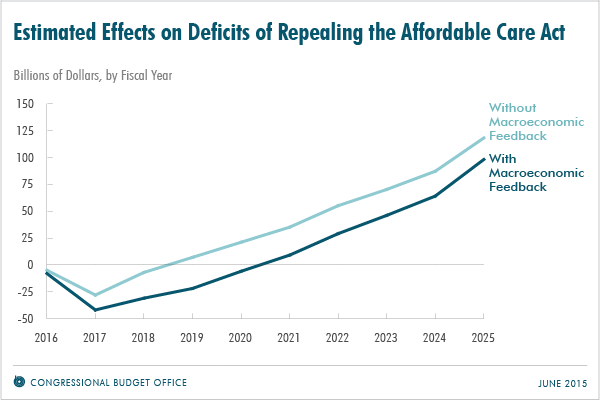
There’s nothing wrong, per se, with this type of information. But making deficits the focus of the analysis is akin to thinking that the time of possession is more important than the final score in the Super Bowl.

What matters for more is what happens to the economy, which is affected by the size and structure of government. As such, here’s the most important finding from the report.

Repeal of the ACA would raise economic output…the resulting increase in GDP is projected to average about 0.7 percent over the 2021–2025 period.

There are two reasons the bureaucrats expect better economic performance if Obamacare is repealed. First, people will have more incentive to work because of a reduction in handouts.

CBO and JCT estimate that repealing the ACA would increase the supply of labor and thus increase aggregate compensation (wages, salaries, and fringe benefits) by an amount between 0.8 percent and 0.9 percent over the 2021–2025 period. …the subsidies and tax credits for health insurance that the ACA provides to some people are phased out as their income rises—creating an implicit tax on additional earnings—and those subsidies, along with expanded eligibility for Medicaid, generally make it easier for some people to work less or to stop working.

Second, the analysis also recognizes that there would be positive economic results from repealing the tax hikes in Obamacare, especially the ones that exacerbate the tax code’s bias against saving and investment.

Implementation of the ACA is also expected to shrink the capital stock, on net, over the next decade, so a repeal would increase the capital stock and output over that period. In particular, repealing the ACA would increase incentives for capital investment, both by increasing labor supply (which makes capital more productive) and by reducing tax rates on capital income. …repealing the ACA also would eliminate several taxes that reduce people’s incentives to save and invest—most notably the 3.8 percent tax on various forms of investment income for higher-income individuals and families. The resulting increase in the incentive to save and invest—relative to current law—thus would gradually boost the capital stock; consequently, output would be higher.

And here’s the most important table from the report. And it’s important for a reason that doesn’t get sufficient attention in the report, which is the fact that repeal of Obamacare will reduce the burden of spending and the burden of taxation. I’ve circled the relevant numbers in red.

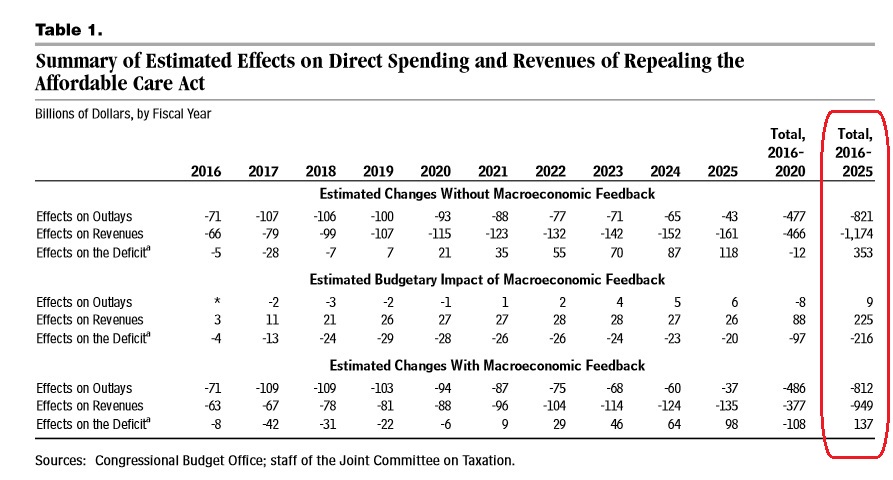
Returning to something I touched on earlier, the CBO report gives inordinate attention to the fact that there’s a projected increase in red ink because the burden of spending doesn’t fall as much as the burden of taxation.

My grousing about CBO’s deficit fixation is not just cosmetic. To the extent that the report has bad analysis, it’s because of an assumption that the deficit tail wags the economic dog.

Here’s more of CBO’s analysis.

Although the macroeconomic feedback stemming from a repeal would continue to reduce deficits after 2025, the effects would shrink over time because the increase in government borrowing resulting from the larger budget deficits would reduce private investment and thus would partially offset the other positive effects that a repeal would have on economic growth. …CBO and JCT…estimate that repealing the act ultimately would increase federal deficits—even after accounting for other macroeconomic feedback. Larger deficits would leave less money for private investment (a process sometimes called crowding out), which reduces output. …The same macroeconomic effects that would generate budgetary feedback over the 2016–2025 period also would operate farther into the future. …the growing increases in federal deficits that are projected to occur if the ACA was repealed would increasingly crowd out private investment and boost interest rates. Both of those developments would reduce private investment and thus would dampen economic growth and revenues.

Some of this is reasonable, but I think CBO is very misguided about the importance of deficit effects compared to other variables.

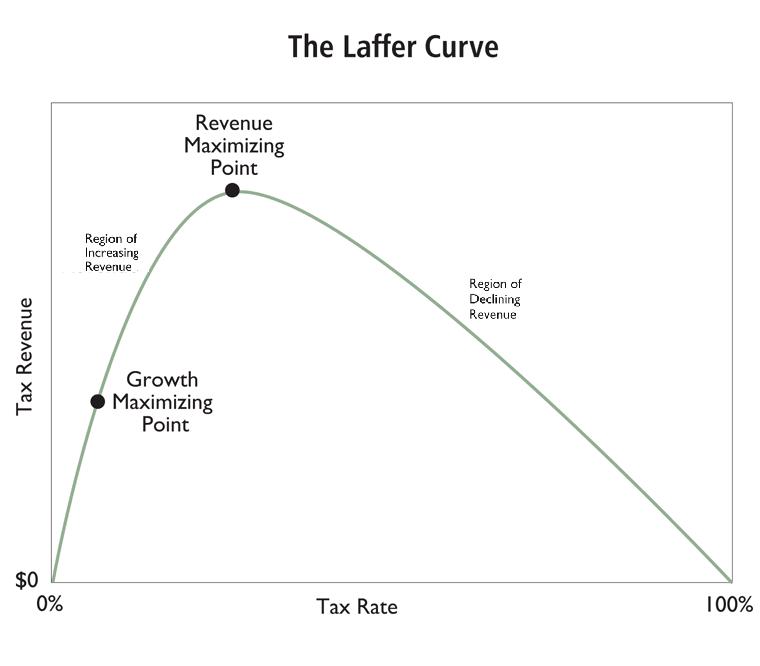
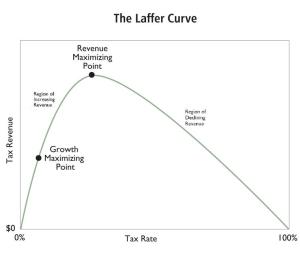
After all, if deficits really drove the economy, that would imply we could maximize growth with 100 percent tax rates (or, if JCT has learned from its mistakes, by setting tax rates at the revenue-maximizing level).

To give you an idea of why CBO’s deficit fixation is wrong, consider the fact that its report got a glowing review from Vox’s Matt Yglesias. Matt, you may remember, recently endorsed a top tax rate of 90 percent, so if he believes A on fiscal policy, you can generally assume the right answer is B.

Here’s some of what he wrote.

Let us now praise Keith Hall. …his CBO appointment was bound up with a push by the GOP for more “dynamic scoring” of tax policy. …Yet today Hall’s CBO released its first big dynamic score of something controversial, and it’s … perfectly sensible.

Yes, parts of the report are sensible, as I wrote above.

But Matt thinks it’s sensible because it focuses on deficits, which allows his side to downplay the negative economic impact of Obamacare.

…the ACA makes it less terrible to be poor. By making it less terrible to be poor, the ACA reduces the incentive to do an extra hour or three at an unpleasant low-wage job in order to put a little more money in your pocket. CBO’s point is that when you do this, you shrink the overall size of GDP and thus the total amount of federal tax revenue. …The change…is big enough to matter economically (tens of billions of dollars a year are at stake) but not big enough to matter for the world of political talking points where the main question is does the deficit go up or down.

Yes, you read correctly. He’s celebrating the fact that people now have less incentive to be self-reliant.

Do that for enough people and you become Greece.

P.S. On a totally different topic, it’s time to brag about America having better policy than Germany. At least with regard to tank ownership.

I’ve previously written about legal tank ownership in the United States. But according to a BBC report, Germans apparently don’t have this important freedom.

The Panther tank was removed from the 78-year-old’s house in the town of Heikendorf, along with a variety of other military equipment, including a torpedo and an anti-aircraft gun, Der Tagesspiegel website reports. …the army had to be called in with modern-day tanks to haul the Panther from its cellar. It took about 20 soldiers almost nine hours to extract the tank… It seems the tank’s presence wasn’t much of a secret locally. Several German media reports mention that residents had seen the man driving it around town about 30 years ago. “He was chugging around in it during the snow catastrophe in 1978,” Mayor Alexander Orth was quoted as saying.

You know what they say: If you outlaw tanks, only outlaws will have tanks.

I’m also impressed the guy had an anti-aircraft gun. The very latest is self defense!

And a torpedo as well. Criminals would have faced resistance from the land, air, and sea.

If nothing else, he must have a big house.

One that bad guys probably avoided, at least if they passed the famous IQ test for criminals and liberals.

Read Full Post »

I’ve written several times about the importance of appointing sensible people to head the Congressional Budget Office (CBO) and Joint Committee on Taxation (JCT). Heck, making reforms to these Capitol Hill bureaucracies is a basic competency test for Republicans.

That’s because CBO and JCT are the official scorekeepers when politicians consider changes in fiscal policy and it has a big (and bad) impact if they rely on outdated methods and bad analysis.

The CBO, for instance, puts together economic analysis and baseline forecasts of revenue and spending, while also estimating what will happen if there are changes to spending programs. Seems like a straightforward task, but what if the bureaucrats assume that government spending “stimulates” the economy and they fail to measure the harmful impact of diverting resources from the productive sector of the economy to Washington?

The JCT, by contrast, prepares estimates of what will happen to revenue if politicians make various changes in tax policy. Sounds like a simple task, but what if the bureaucrats make the ridiculous assumption that tax policy has no measurable impact on jobs, growth, or competitiveness, which leads to the preposterous conclusion that you maximize revenue with 100 percent tax rates?

Writing for Investor’s Business Daily, former Treasury Department officials Ernie Christian and Gary Robbins explain why the controversy over these topics – sometimes referred to as “static scoring” vs “dynamic scoring” – is so important.

It is Economics 101 that many federal taxes, regulations and spending programs create powerful incentives for people not to work, save, invest or otherwise efficiently perform the functions essential to their own well-being. These government-induced changes in behavior set off a chain reaction of macroeconomic effects that impair GDP growth, kill jobs, lower incomes and restrict upward mobility, especially among lower- and middle-income families. …Such measurements are de rigueur among credible academic and private-sector researchers who seek to determine the true size of the tax and regulatory burden on the economy and the true value of government spending, taking into account the economic damage it often causes.

But not all supposed experts look at these second-order or indirect effects of government policy.

And what’s amazing is that the official scorekeepers in Washington are the ones who refuse to recognize the real-world impact of changes in government policy.

These indirect costs of government, in particular or in total, have not been calculated and disclosed in the Budget of the United States or in analyses by the Congressional Budget Office. The result of this deliberate omission by Washington has been to understate many costs of government, often by more than 100%, and grossly overstate its benefits. …It is on this foundation of disinformation that the highly disrespected, overly expensive and too often destructive federal government in Washington has been built.

Christian and Robbins look specifically at the direct and indirect costs of the income tax.

The income tax is a two-part tax, one acknowledged and one deliberately concealed. First, almost $2 trillion of income tax is collected by the IRS for government to spend for presumably beneficial purposes. Then there is the tax-induced economic damage, a stealth tax, indirectly picked from people’s pockets in the form of fewer jobs and lower incomes. This stealth tax is $3.2 trillion each year. …economists often refer to the stealth tax as a deadweight loss. …When the $2 trillion of income tax taken directly out of the economy by the IRS is added to the $3.2 trillion of indirect economic cost, the total private-sector cost of the income tax is $5.2 trillion — and the government has only $2 trillion of income tax revenues to spend in trying to repair the damage.

By the way, I must disagree with the last part of this excerpt.

Government doesn’t “repair the damage” of high taxes when it spends money. Most of the time, it exacerbates the damage of high taxes by spending money in ways that further weaken the economy.

Let’s now get back to the part of the editorial that I like. Ernie and Gary make the very important point that some taxes do more damage than others.

…when the IRS collects a dollar of income tax from corporations, the damage to the overall economy is about $4. Similarly, a dollar of tax on capital gains sets off a ripple effect that does about $6 of damage. Poison pills such as capitalizing (instead of expensing) the job-creating cost of machinery and equipment, taxing dividends, double-taxing personal saving and imposing high tax rates result in stealth taxes ranging from $3 to $8 per dollar of revenues. …Low tax rates do less damage to economic growth per dollar of revenues raised and are preferable to high tax rates, which have the opposite effect.

Here’s a chart based on their analysis.

I’m not overly fixated on their specific estimates. Even good economists, after all, have a hard time making accurate forecasts and correctly isolating the impact of discrete policies on overall economic performance. Moreover, it’s very difficult to factor in the economic impact of America’s tax-haven policies for foreign investors, which help offset the damage of high tax burdens on American citizens.

But Christian and Robbins are completely correct about certain taxes doing more damage than other taxes.

And the lesson they teach us is that the tax bias against saving and investment is extremely destructive.

And the less fortunate are particularly disadvantaged when bad methodology at CBO and JCT perpetuates bad policy.

…it is self-defeating and harmful to require that tax reforms always be revenue neutral in a near-term static sense. Imagine a tax reform that initially costs the IRS $1. Through economic growth, it promptly increases taxable income and well-offness by $2.50. At an average tax rate of 20%, the reform-induced $2.50 increase in taxable income at the outset recoups only 50 cents of the initial $1 cost to the IRS, thereby leaving the IRS 50 cents short in the near term. But who in the White House or Congress would refuse to make mostly lower and middle-income families $2.50 better off at a cost of only 50 cents to Washington’s already overflowing coffers?

The final sentence of the excerpt hits the nail on the head.

I’ve previously cited academic research and expert analysis to show that it is pointlessly punitive to raise tax rates if the damage to the private sector is several times greater than the additional revenue collected by government.

Yet there are plenty of examples of this type of short-sighted analysis, such as Obama’s proposal to expand the Social Security payroll tax (see the 6:43-7:41 section of this video)

And if you like videos, I have a three-part series on the Laffer Curve which is part of this post offering a lesson from the 1980s for Barack Obama.

The bottom line is that we’ll continue to get bad analysis and bad numbers if Republicans aren’t smart enough to clean house at CBO and JCT.

Read Full Post »

Since I’m a big advocate of the Laffer Curve, that means I favor dynamic scoring. This is the common-sense observation that you can’t figure out the effect of tax changes on revenue without first estimating the impact on taxable income.

And I’ve shared some very persuasive data and analysis in favor of the Laffer Curve and dynamic scoring.

The huge increase in taxes paid by upper-income taxpayers after Reagan slashed the top income tax rate.

The fact that the overwhelming majority of CPAs believe in significant feedback effects.

Even left-wing economists admit that you lose revenue if tax rates get too high.

International bureaucracies even admit that there are “Laffer Curve” limits that make some tax hikes self-defeating.

Notwithstanding all this evidence, we have a system in Washington that is based on static scoring, which simplistically assumes a linear relationship between tax rates and tax revenue.

The Joint Committee on Taxation makes the revenue estimates, and reformers argue the status quo is biased in favor of higher tax and have long urged the system to be modernized to get more accurate numbers.

Needless to say, establishment leftists don’t want to see any changes.

Edward Kleinbard, a former Staff Director for the Joint Committee on Taxation, writes with disapproval in the New York Times that Republicans want to change the existing methodology for estimating the revenue impact of changes in tax policy.

…at the top of their to-do list is changing how the government measures the impact of tax cuts on federal revenue: namely, to switch from so-called static scoring to “dynamic” scoring. While seemingly arcane, the change could have significant…consequences.

Here’s his description of the issue, which is reasonably fair.

…conventional estimates do not…incorporate macroeconomic behavioral changes. Dynamic scoring does. Proponents point out, correctly, that if a tax proposal is large enough, then those sorts of feedback effects can aim the entire economy on a slightly different path. Such proponents argue that conventional projections are skewed against tax cuts, because they do not consider that cutting taxes could lead to higher economic output, which would make up at least some of the lost revenues. They maintain that dynamic scoring will, therefore, be both more neutral and more accurate than current methodologies.

He then gives two reasons why he doesn’t like dynamic scoring.

First, he argues that a modernized system will be imprecise.

Economists disagree on the answers, and different models’ predicted feedback effects vary wildly, depending on the values selected for those uncertain assumptions.  …Consider the nonpartisan scorekeepers’ estimates of the consequences of a tax-reform bill proposed last year by Representative Dave Camp, Republican of Michigan. Using different models and plausible inputs, the scorekeepers estimated that, under the bill, total gross domestic product might rise between 0.1 percent and 1.6 percent over the next decade — a 16-fold spread in projected outcomes. Which result should be the basis of congressional scorekeeping?

He’s certainly right that economic models will generate a range of predictions.

And I’ll be the first to admit that models are woefully inadequate in their attempts to measure millions of people making billions of decisions. Heck, I’ve even pointed out that economists are terrible forecasters.

But Kleinbard is basically arguing that it’s better to be exactly wrong than inexactly right.

Under the current system, for instance, the JCT will simplistically calculate that a doubling of tax rates will lead to a near-doubling of tax revenue.*

That’s very precise, but it’s also very wrong. In reality, a doubling of tax rates would have a very large and very negative impact on economic performance. Shouldn’t lawmakers have a system that at least gives them an estimate, or a range of estimates, to suggest the possible real-world consequences?

This video explains what is wrong with the Joint Committee on Taxation’s methodology.

Kleinbard’s second argument against dynamic scoring is based on his assumption that bigger government is good for the economy since the government spends money wisely.

I’m not joking.

Federal deficits are on an unsustainable path (as it happens, because of undertaxation, not excessive spending). Simply cutting taxes against the headwind of structural deficits leads to lower growth, as government borrowing soaks up an ever-increasing share of savings. …these models are political statements. They show the biggest economic effects by assuming that tax cuts are financed by unspecified future spending cuts. The smaller size of government, not the tax cuts by themselves, largely drives the models’ results. …the models are not a step toward more neutral revenue estimates, because they assume that, while individuals make productive investments, government does not. In reality, government spending contributes significantly to economic output. …When revenues do in fact decline and deficits rise, those same proponents will push for steep cuts in government insurance or investment programs, because they will claim that the models demand it.

Wow. I hardly know where to start. So many wrong assertions in so little space.

I guess I’ll begin by pointing out that it’s absurd to argue America’s fiscal problems are the result of taxes being too low. But if you don’t believe me, just look at the White House’s own numbers.

But the most important point to address is that Kleinbard thinks government spending is more efficient than private spending.

That arguably might be true if government was consuming only 2 percent of GDP and certain core “public goods” weren’t being provided.

But that’s hardly the case today, or at any time in recent history.

The burden of government spending is well beyond the growth-maximizing level in the United States. This video elaborates.

The evidence strongly indicates we need less government rather than more. Unless, of course, you think the United States would grow faster if we were more like France or Greece.

* There are some “micro-economic” feedback effects in the current system, so even the JCT wouldn’t assert that revenues would double if tax rates rose by 100 percent.

P.S. Here’s my debunking of the straw-man debunking of the Laffer Curve and dynamic scoring.

Read Full Post »

Many statists are worried that Republicans may install new leadership at the Joint Committee on Taxation (JCT) and Congressional Budget Office (CBO).

This is a big issue because these two score-keeping bureaucracies on Capitol Hill tilt to the left and have a lot of power over fiscal policy.

The JCT produces revenue estimates for tax bills, yet all their numbers are based on the naive assumption that tax policy generally has no impact on overall economic performance. Meanwhile, CBO produces both estimates for spending bills and also fiscal commentary and analysis, much of it based on the Keynesian assumption that government spending boosts economic growth.

I personally have doubts whether GOPers are smart enough to make wise personnel choices, but I hope I’m wrong.

Matt Yglesias of Vox also seems pessimistic, but for the opposite reason.

He has a column criticizing Republicans for wanting to push their policies by using “magic math” and he specifically seeks to debunk the notion – sometimes referred to as dynamic scoring or the Laffer Curve – that changes in tax policy may lead to changes in economic performance that affect economic performance.

He asks nine questions and then provides his version of the right answers. Let’s analyze those answers and see which of his points have merit and which ones fall flat.

But even before we get to his first question, I can’t resist pointing out that he calls dynamic scoring “an accounting gimmick from the 1970s” in his introduction. That is somewhat odd since the JCT and CBO were both completely controlled by Democrats at the time and there was zero effort to do anything other than static scoring.

I suppose Yglesias actually means that dynamic scoring first became an issue in the 1970s as Ronald Reagan (along with Jack Kemp and a few other lawmakers) began to argue that lower marginal tax rates would generate some revenue feedback because of improved incentives to work, save, and invest.

Now let’s look at his nine questions and see if we can debunk his debunking.

1. The first question is “What is dynamic scoring?” and Yglesias responds to himself by stating it “is the idea that when estimating the budgetary impact of changes in tax policy, you ought to take into account changes to the economy induced by the policy change” and he further states that it “sounds like a reasonable idea.”

But then he says the real problem is that conservatives exaggerate and “say that large tax cuts will have a relatively small impact on the deficit  — or even that they make the deficit smaller” and that they “cite an idea known as the Laffer Curve to argue that tax cuts increase growth so much that tax revenues actually rise.”

He’s sort of right. There are definitely examples of conservatives overstating the pro-growth impact of tax cuts, particularly when dealing with proposals – such as expanded child tax credits – that presumably will have no impact on economic performance since there is no change in marginal tax rates on productive behavior.

But notice that he doesn’t address the bigger issue, which is whether the current approach (static scoring) is accurate and appropriate even when dealing with major changes in marginal tax rates on work, saving, and investment. That’s what so-called supply-side economists care about, yet Yglesias instead prefers to knock down a straw man.

2. The second question is “What is the Laffer Curve?” and Yglesias answer his own question by asserting that the “basic idea of the curve is that sometimes lower tax rates lead to more tax revenue by boosting economic growth.” He then goes on to ridicule the notion that tax cuts are self-financing, even citing a column by National Review’s Kevin Williamson.

Once again, Yglesias is sort of right. Some Republicans have made silly claims, but he mischaracterizes what Williamson wrote.

More specifically, he’s wrong in asserting that the Laffer Curve is all about whether tax cuts produce more revenue. Instead, the notion of the curve is simply that you can’t calculate the revenue impact of changes in tax rates without also measuring the likely change in taxable income. The actual revenue impact of changes in tax rates will then depend on whether you’re on the upward-sloping part of the curve or downward-sloping part of the curve.

The real debate is the shape of the curve, not whether a Laffer Curve exists. Indeed, I’m not aware of a single economist, no matter how far to the left (including John Maynard Keynes), who thinks a 100 percent tax rate maximizes revenue. Yet that’s the answer from the JCT. Moreover, the Laffer Curve also shows that tax increases can impose very high economic costs even if they do raise revenue, so the value of using such analysis is not driven by whether revenues go up or down.

3. The third question is “So do tax cuts boost economic growth?” and Yglesias responds by stating “the credible research on the matter is very very mixed.” But he follows that response by citing research which concluded that “a tax cut financed by reductions in wasteful spending or social assistance for the elderly would boost growth.”

But that leaves open the question as to whether the economy does better because of the lower tax burden, the lower spending burden, or some combination of the two effects. But I’ll take any of those three answers.

So is he “sort of right” again? Not so fast. Yglesias also cites the Congressional Research Service (which rubs me the wrong way) and a couple of academic economists who concluded that there is “no systematic correlation between the level of taxation and the level of economic growth.”

The bottom line is that there’s no consensus on the economic impact of taxation (in part because it is difficult to disentangle the impact of taxes from the impact on spending, and that’s not even including all the other policies that determine economic performance). But I still think Yglesias is being a bit misleading because there is far more consensus on the economic impact of marginal tax rates and debates about the Laffer Curve and dynamic scoring very often revolve around those types of tax policies.

4. The fourth question is “How does tax scoring work now?” and Yglesias respond to himself by noting that the various score-keeping bureaucracies measure “demand-side effects” and “behavioral effects.”

He’s right, but CBO uses so-called demand-side effects to justify Keynesian spending, so that’s not exactly reassuring news for people who focus more on real-world evidence.

And he’s also right that JCT measures changes in behavior (such as smokers buying fewer cigarettes if the tax goes up), and this type of analysis (sometimes called microeconomic dynamic scoring) certainly is a good thing.

But the real controversy is about macroeconomic dynamic scoring, which we’ll address below.

5. The fifth question is “Can we take a break from all this macroeconomic modeling?” and is simply an excuse for Yglesias to make a joke, though I can’t tell whether he is accusing Reagan supporters of being racists or mocking some leftists for accusing Reagan supporters of being racist.

So I’m not sure how to react, other than to recommend the fourth video at this link if you want some real Reagan humor.

6. The sixth question is “What do current scoring methods leave out?” and Yglesias accurately notes that what “dynamic-scoring proponents want is a model of macroeconomic consequences. They think that a country with lower tax rates will see more investment in physical and human capital, leading to more productivity, and more economic growth.”

He even cites my blog post from last month and correctly describes me as believing that it is “self-evidently ridiculous that the current CBO model says higher tax rates would lead to faster economic growth via lower deficits.”

I also think he is fair in pointing out that “people sharply disagree about how much tax rates actually influence economic growth” and that “the whole terrain is enormously contested.”

But this is why I think my view is the reasonable middle ground. At one extreme you find (at least in theory) some over-enthusiastic Republican types who argue that all tax cuts are self-financing. At the other extreme you find the JCT saying tax policy has no impact on the economy and actually arguing that you maximize tax revenue with 100 percent tax rates. I suspect that Yglesias, if pressed, will agree the JCT approach is nonsensical.

So why not have the JCT – in a fully transparent manner – begin to incorporate macroeconomic analysis?

7. The seventh question is “Has dynamic scoring ever been tried?” and Yglesias self-responds by pointing out that a Treasury Department dynamic analysis of the 2001 and 2003 tax cuts come to the conclusion that “the resulting budget impact would be 7 percent smaller than what was suggested by conventional scoring methods.” and “ended with the conclusion that the Bush tax cuts substantially decreased revenue.”

In other words, dynamic analysis was not used to imply that tax cuts are self-financing. Indeed, the dynamic score in the example of what would happen if the Bush tax cuts were made permanent turned out to be very modest.

So why, then, are folks on the left so determined to block reforms that – in practice – don’t yield dramatic changes in numbers? My own guess, for what it’s worth, is that they don’t want any admission or acknowledgement that lower tax rates are better for growth than higher tax rates.

8. The eight question is “Why are we talking about dynamic scoring now?” and Yglesias answers his own question by accurately stating that “the Republican takeover of Congress starting in 2015 gives the GOP an opportunity to either change the scoring rules, change the personnel in charge of the scoring, or both.”

He’s not just sort of right. He’s completely right. I have no disagreements.

9. The ninth question is “Why does the score matter?” and his self-response is “the scores matter because perceptions matter in politics.” In other words, politicians don’t want to be accused of enacting legislation that is predicted to increase red ink.

Yglesias is also right when he writes that this “effect shouldn’t be exaggerated. In the past, Republicans haven’t hesitated to vote for tax measures that the CBO says will increase the deficit. That’s because they have a strong preference for low tax rates.”

At the risk of being boring, I also think he’s right about the degree to which scores matter.

The bottom line is that questions #1, #2, #3, and #6 are the ones that matter. Yglesias makes plenty of reasonable points, but I think his argument ultimately falls flat because he spends too much time attacking the all-tax-cuts-pay-for-themselves straw man and not enough time addressing whether it is reasonable for the JCT to use a methodology that assumes taxes have no effect on the overall economy.

But I expect to hear similar arguments, expressed in a more strident fashion, if Republicans take prudent steps – starting with personnel changes – to modernize the JCT and CBO apparatus.

P.S. While tax cuts usually do lead to revenue losses, there is at least one very prominent case of lower tax rates leading to more revenue.

P.P.S. If the JCT approach is reasonable, why do the overwhelming majority of CPAs disagree? Is it possible that they have more real-world understanding of how taxpayers (particularly upper-income taxpayers) respond when tax rates change?

P.P.P.S. If the JCT approach is reasonable, why do international bureaucracies so often produce analysis showing a Laffer Curve?

There’s also some nice evidence from Denmark, Canada, France, and the United Kingdom.

Read Full Post »

The Congressional Budget Office (CBO) and Joint Committee on Taxation (JCT) are congressional bureaucracies that wield tremendous power on Capitol Hill because of their role as fiscal scorekeepers and referees.

Unfortunately, these bureaucracies lean to the left. When CBO does economic analysis or budgetary estimates, for instance, the bureaucrats routinely make it easier for politicians to expand the burden of government spending. The accompanying cartoon puts it more bluntly.

And when JCT does revenue estimates, the bureaucrats grease the skids for anti-growth tax policy by overstating revenue losses from lower tax rates and overstating revenue gains from higher tax rates.

Here are some examples of CBO’s biased output.

The CBO – over and over again – produced reports based on Keynesian methodology to claim that Obama’s so-called stimulus was creating millions of jobs even as the unemployment rate was climbing.

CBO has produced analysis asserting that higher taxes are good for the economy, even to the point of implying that growth is maximized when tax rates are 100 percent.

Continuing a long tradition of under-estimating the cost of entitlement programs, CBO facilitated the enactment of Obamacare with highly dubious projections.

CBO also radically underestimated the job losses that would be caused by Obamacare.

When purporting to measure loopholes in the tax code, the CBO chose to use a left-wing benchmark that assumes there should be double taxation of income that is saved and invested.

On rare occasions when CBO has supportive analysis of tax cuts, the bureaucrats rely on bad methodology.

But let’s not forget that the JCT produces equally dodgy analysis.

The JCT was wildly wrong in its estimates of what would happen to tax revenue after the 2003 tax rate reductions.

Because of the failure to properly measure the impact of tax policy on behavior, the JCT significantly overestimated the revenues from the Obamacare tax on tanning salons.

The JCT has estimated that the rich would pay more revenue with a 100 percent tax rate even though there would be no incentive to earn and report taxable income if the government confiscated every penny.

This means the JCT is more left wing than the very statist economists who think the revenue-maximizing tax rate is about 70 percent.

Unsurprisingly, the JCT also uses a flawed statist benchmark when producing estimates of so-called tax expenditures.

Though I want to be fair. Sometimes CBO and JCT produce garbage because they are instructed to put their thumbs on the scale by their political masters. The fraudulent process of redefining spending increases as spending cuts, for instance, is apparently driven by legislative mandates.

But the bottom line is that these bureaucracies, as currently structured and operated, aid and abet big government.

Regarding the CBO, Veronique de Rugy of Mercatus hit the nail on the head.

The CBO’s consistently flawed scoring of the cost of bills is used by Congress to justify legislation that rarely performs as promised and drags down the economy. …CBO relies heavily on Keynesian economic models, like the ones it used during the stimulus debate. Forecasters at the agency predicted the stimulus package would create more than 3 million jobs. …What looks good in the spirit world of the computer model may be very bad in the material realm of real life because people react to changes in policies in ways unaccounted for in these models.

And the Wall Street Journal opines wisely about the real role of the JCT.

Joint Tax typically overestimates the revenue gains from raising tax rates, while overestimating the revenue losses from tax rate cuts. This leads to a policy bias in favor of higher tax rates, which is precisely what liberal Democrats wanted when they created the Joint Tax Committee.

Amen. For all intents and purposes, the system is designed to help statists win policy battles.

No wonder only 15 percent of CPAs agree with JCT’s biased approach to revenue estimates.

So what’s the best way to deal with this mess?

Some Republicans on the Hill have nudged these bureaucracies to make their models more realistic.

That’s a helpful start, but I think the only effective long-run option is to replace the top staff with people who have a more accurate understanding of fiscal policy. Which is exactly what I said to Peter Roff, a columnist for U.S. News and World Report.

…the new congressional leadership should be looking at ways to reform the way the institution does its business – and the first place for it to start is the Congressional Budget Office. Most Americans don’t know what the CBO is, how it was created or what it does. They also don’t know how vitally important it is to the legislative process, especially where taxes, spending and entitlement reform are concerned. As Dan Mitchell, a well-respected economist with the libertarian Cato Institute, puts it in an email, the CBO “has a number-crunching role that gives the bureaucracy a lot of power to aid or hinder legislation, so it is very important for Republicans to select a director who understands the economic consequences of excessive spending and punitive tax rates.”

Heck, it’s not just “very important” to put in a good person at CBO (and JCT). As I’ve written before, it’s a test of whether the GOP has both the brains and resolve to fix a system that’s been rigged against them for decades.

So what will happen? I’m not sure, but Roll Call has a report on the behind-the-scenes discussions on Capitol Hill.

Flush from their capture of the Senate, Republicans in both chambers are reviewing more than a dozen potential candidates to succeed Douglas W. Elmendorf as director of the Congressional Budget Office after his term expires Jan. 3. …The appointment is being closely watched, with a number of Republicans pushing for CBO to change its budget scoring rules to use dynamic scoring, which would try to account for the projected impact of tax cuts and budget changes on the economy.

So who will it be? The Wall Street Journal weighs in, pointing out that CBO has been a tool for the expansion of government.

…the budget rules are rigged to expand government and hide the true cost of entitlements. CBO scores aren’t unambiguous facts but are guesses about the future, biased by the Keynesian assumptions and models its political masters in Congress instruct it to use. Republicans who now run Congress can help taxpayers by appointing a new CBO director, as is their right as the majority. …The Tax Foundation’s Steve Entin would be an inspired pick.

I disagree with one part of the above excerpt. Steve Entin is superb, but he would be an inspired pick for the Joint Committee on Taxation, not the CBO.

But I fully agree with the WSJ’s characterization of the budget rules being used to grease the skids for bigger government.

In a column for National Review, Dustin Siggins writes that Bill Beach, my old colleague from my days at the Heritage Foundation, would be a good choice for CBO.

…few Americans may realize  that the budget process is at least as twisted as the budget itself. While one man can’t fix it all, Republicans who want to be taken seriously about budget reform should approve Bill Beach to head the Congressional Budget Office (CBO). Putting the right person in charge as Congress’s official “scorekeeper” would be an important first step in proving that the party is serious about honest, transparent, and efficient government. …CBO has several major structural problems that a new CBO director should fix.

Hmm… Entin at JCT and Beach at CBO. That might even bring a smile to my dour face.

But it doesn’t have to be those two specific people. There are lots of well-regarded policy scholars who could take on the jobs of reforming and modernizing the work of JCT and CBO.

But that will only happen if Republicans are willing to show some fortitude. And that means they need to be ready to deal with screeching from leftists who want to maintain their control of these institutions.

For example, Peter Orszag, a former CBO Director who then became Budget Director for Obama (an easy transition), wrote for Bloomberg that he’s worried GOPers won’t pick someone with his statist views.

The Congressional Budget Office should be able to celebrate its 40th anniversary this coming February with pride. …The occasion will be ruined, however, if the new Republican Congress breaks its long tradition of naming an objective economist/policy analyst as CBO director, when the position becomes vacant next year, and instead appoints a party hack.

By the way, it shows a remarkable lack of self-awareness for someone like Orszag to complain about the possibility of a “party hack” heading up CBO.

In any event, that’s just the tip of the iceberg. I fully expect we’ll also see editorials very soon from the New York Times, Washington Post, and other statist outlets about the need to preserve the “independence” of CBO and JCT.

Just keep in mind that their real goal is to maintain their side’s control over the process.

P.S. There’s another Capitol Hill bureaucracy, the Congressional Research Service, that also generates leftist fiscal policy analysis. Fortunately, the CRS doesn’t have any scorekeeper or referee role, so it doesn’t cause nearly as much trouble. Nonetheless, any bureaucracy that produces “research” about higher taxes being good for the economy needs to be abolished or completely revamped.

P.P.S. This video explains the Joint Committee on Taxation’s revenue-estimating methodology. Pay extra attention to the section beginning around the halfway point, which deals with a request my former boss made to the JCT.

P.P.P.S. If you want to see some dramatic evidence that lower tax rates don’t necessarily lead to less revenue, check out this amazing data from the 1980s.

Read Full Post »

The title of this piece has an asterisk because, unfortunately, we’re not talking about progress on the Laffer Curve in the United States.

Instead, we’re discussing today how lawmakers in other nations are beginning to recognize that it’s absurdly inaccurate to predict the revenue impact of changes in tax rates without also trying to measure what happens to taxable income (if you want a short tutorial on the Laffer Curve, click here).

But I’m a firm believer that policies in other nations (for better or worse) are a very persuasive form of real-world evidence. Simply stated, if you’re trying to convince a politician that a certain policy is worth pursuing, you’ll have a much greater chance of success if you can point to tangible examples of how it has been successful.

That’s why I cite Hong Kong and Singapore as examples of why free markets and small government are the best recipe for prosperity. It’s also why I use nations such as New Zealand, Canada, and Estonia when arguing for a lower burden of government spending.

And it’s why I’m quite encouraged that even the squishy Tory-Liberal coalition government in the United Kingdom has begun to acknowledge that the Laffer Curve should be part of the analysis when making major changes in taxation.

UK Laffer CurveI don’t know whether that’s because they learned a lesson from the disastrous failure of Gordon Brown’s class-warfare tax hike, or whether they feel they should do something good to compensate for bad tax policies they’re pursuing in other areas, but I’m not going to quibble when politicians finally begin to move in the right direction.

The Wall Street Journal opines that this is a very worthwhile development.

Chancellor of the Exchequer George Osborne has cut Britain’s corporate tax rate to 22% from 28% since taking office in 2010, with a further cut to 20% due in 2015. On paper, these tax cuts were predicted to “cost” Her Majesty’s Treasury some £7.8 billion a year when fully phased in. But Mr. Osborne asked his department to figure out how much additional revenue would be generated by the higher investment, wages and productivity made possible by leaving that money in private hands.

By the way, I can’t resist a bit of nit-picking at this point. The increases in investment, wages, and productivity all occur because the marginal corporate tax rate is reduced, not because more money is in private hands.

I’m all in favor of leaving more money in private hands, but you get more growth when you change relative prices to make productive behavior more rewarding. And this happens when you reduce the tax code’s penalty on work compared to leisure and when you lower the tax on saving and investment compared to consumption.

The Wall Street Journal obviously understands this and was simply trying to avoid wordiness, so this is a friendly amendment rather than a criticism.

Anyhow, back to the editorial. The WSJ notes that the lower corporate tax rate in the United Kingdom is expected to lose far less revenue than was predicted by static estimates.

The Treasury’s answer in a report this week is that extra growth and changed business behavior will likely recoup 45%-60% of that revenue. The report says that even that amount is almost certainly understated, since Treasury didn’t attempt to model the effects of the lower rate on increased foreign investment or other “spillover benefits.”

And maybe this more sensible approach eventually will spread to the United States.

…the results are especially notable because the U.K. Treasury gnomes are typically as bound by static-revenue accounting as are the American tax scorers at Congress’s Joint Tax Committee. While the British rate cut is sizable, the U.S. has even more room to climb down the Laffer Curve because the top corporate rate is 35%, plus what the states add—9.x% in benighted Illinois, for example. This means the revenue feedback effects from a rate cut would be even more substantial.

The WSJ says America’s corporate tax rate should be lowered, and there’s no question that should be a priority since the United States now has the least competitive corporate tax system in the developed world (and we rank a lowly 94 out of the world’s top 100 nations).

But the logic of the Laffer Curve also explains why we should lower personal tax rates. But it’s not just curmudgeonly libertarians who are making this argument.

Writing in London’s City AM, Allister Heath points out that even John Maynard Keynes very clearly recognized a Laffer Curve constraint on excessive taxation.

Supply-side economist?!?

Even Keynes himself accepted this. Like many other economists throughout the ages, he understood and agreed with the principles that underpinned what eventually came to be known as the Laffer curve: that above a certain rate, hiking taxes further can actually lead to a fall in income, and cutting tax rates can actually lead to increased revenues.Writing in 1933, Keynes said that under certain circumstances “taxation may be so high as to defeat its object… given sufficient time to gather the fruits, a reduction of taxation will run a better chance than an increase of balancing the budget. For to take the opposite view today is to resemble a manufacturer who, running at a loss, decides to raise his price, and when his declining sales increase the loss, wrapping himself in the rectitude of plain arithmetic, decides that prudence requires him to raise the price still more—and who, when at last his account is balanced with nought on both sides, is still found righteously declaring that it would have been the act of a gambler to reduce the price when you were already making a loss.”

For what it’s worth, Keynes also thought that it would be a mistake to let government get too large, having written that “25 percent [of GDP] as the maximum tolerable proportion of taxation.”

But let’s stay on message and re-focus our attention on the Laffer Curve. Amazingly, it appears that even a few of our French friends are coming around on this issue.

Here are some passages from a report from the Paris-based Institute for Research in Economic and Fiscal Issues.

In an interview given to the newspaper Les Echos on November 18th, French Prime Minister Jean -Marc Ayrault finally understood that “the French tax system has become very complex, almost unreadable, and the French often do not understand its logic or are not convinced that what they are paying is fair and that this system is efficient.” …The Government was seriously disappointed when knowing that a shortfall of over 10 billion euros is expected in late 2013 according to calculations by the National Assembly. …In fact, we have probably reached a threshold where taxation no longer brings in enough money to the Government because taxes weigh too much on production and growth.

This is a point that has also been acknowledged by France’s state auditor. And even a member of the traditionally statist European Commission felt compelled to warn that French taxes had reached the point whether they “destroy growth and handicap the creation of jobs.”

But don’t hold your breath waiting for good reforms in France. I fear the current French government is too ideologically fixated on punishing the rich to make a shift toward more sensible tax policy.

P.S. The strongest single piece of evidence for the Laffer Curve is what happened to tax collections from the rich in the 1980s. The top tax rate dropped from 70 percent to 28 percent, leading many statists to complain that the wealthy wouldn’t pay enough and that the government would be starved of revenue. To put it mildly, they were wildly wrong.

I cite that example, as well as other pieces of evidence, in this video.

P.P.S. And if you want to understand specifically why class-warfare tax policy is so likely to fail, this post explains why it’s a fool’s game to target upper-income taxpayers since they have considerable control over the timing, level, and composition of their income.

P.P.P.S. Above all else, never forget that the goal should be to maximize growth rather than revenues. That’s because we want small government. But even for those that don’t want small government, you don’t want to be near the revenue-maximizing point of the Laffer Curve since that implies significant economic damage per every dollar collected.

Read Full Post »

Because I’ve been sharing good news recently – which definitely is not my normal style, I joked the other day I must be on coke, in love, or rolling in money. For example:

Well, the drugs, love, and money must still be in my system because I’m going to share some more good news. Our lords and masters in Washington have taken a small step in the direction of recognizing the Laffer Curve.

Here are some details from a Politico report.

Here’s one Republican victory that went virtually unnoticed in the slew of budget votes last week: The Senate told the Congressional Budget Office it should give more credit to the economic power of tax cuts. It won’t have the force of law, but it was a big symbolic win for conservatives — because it gave them badly needed moral support in an ongoing war to get Washington’s establishment number crunchers to take their economic ideas more seriously. The amendment endorsed a model called “dynamic scoring,” which assumes that tax cuts will pay for at least part of their cost by generating more economic activity. The measure by Sen. Rob Portman (R-Ohio) called on CBO and the Joint Committee on Taxation to include “macroeconomic feedback scoring” in all future estimates of tax legislation. …Portman eked out a narrow 51-48 victory in the final series of budget votes that started around 3 a.m. on Saturday.

Just in case you missed it, this modest victory for common sense took place in the Senate. You know, the place controlled by Harry Reid of Cowboy Poetry fame.Laffer Curve

To be sure, it’s not quite time to pop open the champagne.

The vote was a symbolic victory for the think tanks and lawmakers on the right who have been fighting for years to force CBO and JCT to officially endorse the idea that people spend more and invest more when they owe the government less. …Conservatives’ ideas, including revenue-generating tax cuts and a more market-oriented health care system, can only work if tax policy changes people’s behavior — and that’s just not how CBO views the world.

I’ve been very critical of both CBO and JCT, so I’m one of the people in “think tanks” the article is talking about.

P.S. Chuck Asay has a good cartoon mocking the CBO.

P.P.S. I’ll repeat, for the umpteenth time, that we want to recognize the insights of the Laffer Curve in order to facilitate lower tax rates, not because we want to maximize revenue for the government.

P.P.P.S. Dynamic scoring is a double-edged sword. If the statists control everything, they’ll use the process to justify more spending using discredited Keynesian economics.

Read Full Post »

Alan Blinder has a distinguished resume. He’s a professor at Princeton and he served as Vice Chairman of the Federal Reserve.

So I was interested to see he authored an attack on the flat tax – and I was happy after I read his column. Why? Well, because his arguments are rather weak. So anemic that it makes me think there’s actually a chance to get rid of America’s corrupt internal revenue code.

There are two glaring flaws in his argument. First, he demonstrates a complete lack of familiarity with the flat tax and seemingly assumes that tax reform simply means imposing one rate on the current system.

Here’s some of what he wrote in a Wall Street Journal column.

Many useful steps could be taken to simplify the personal income tax. But, contrary to much misleading rhetoric, flattening the rate structure isn’t one of them. The truth is that 100% of the complexity inheres in the definition of taxable income, which takes up millions of words in the tax laws. None inheres in the progressive rate structure. If you don’t believe that, consider the fact that the corporate income tax is virtually flat once a corporation passes a paltry $75,000 in taxable income. Is it simple? Back to the personal tax. Figuring out your taxable income can be quite an effort. But once that is done, most taxpayers just look up their tax bill on an IRS-provided table. Those with incomes above $100,000 must perform a simple calculation that involves multiplying two numbers together and adding a third. A flat tax with an exemption would require precisely the same sort of calculation. The net reduction in complexity? Zero.

I can understand how an average person might think the flat tax is nothing more than applying a single tax rate to the current system, but any public finance economist must know that the plan devised by Professors Hall and Rabushka completely rips up the current tax system and implements a new system based on one tax rate with no double taxation and no loopholes.

Heck, the Hall/Rabushka book is online and free of charge. But Blinder obviously could not be bothered to understand the proposal before launching his attack.

What about his second mistake? This one’s a doozy. He actually assumes that taxable income is fixed, which is a remarkable error for anyone who supposedly understands economics.

…flattening the rate structure won’t make the tax code any simpler. It would, however, make the tax system far less progressive. Do the math. …Someone with $20 million in taxable income pays nearly $7 million in taxes under the current rate structure, with its 35% top rate. Replace that with a 23% flat tax, and the bill drops to just under $4.6 million.

In other words, he assumes that people won’t change their behavior even though incentives to engage in productive behavior are significantly altered.

In a previous post, I showed how rich people dramatically increased the amount of income they were willing to earn and report after Reagan lowered the top tax rate from 70 percent to 28 percent.

To Blinder, this real-world evidence doesn’t matter – even though the rich paid much more tax to the IRS after Reagan slashed tax rates.

For more information, here’s my flat tax video.

And here’s the video on the global flat tax revolution. Interestingly, there are now about five more flat tax jurisdictions since this video was made – though Iceland abandoned its flat tax, so there are some steps in the wrong direction.

Makes you wonder. If the flat tax is such a bad idea, why are so many nations doing so well using this simple and fair approach?

But be careful, as this cartoon demonstrates, simplicity can mean bad things if the wrong people are in charge.

Read Full Post »

One of my frustrating missions in life is to educate policy makers on the Laffer Curve.

This means teaching folks on the left that tax policy affects incentives to earn and report taxable income. As such, I try to explain, this means it is wrong to assume a simplistic linear relationship between tax rates and tax revenue. If you double tax rates, for instance, you won’t double tax revenue.

But it also means teaching folks on the right that it is wildly wrong to claim that “all tax cuts pay for themselves” or that “tax increases always mean less revenue.” Those results occur in rare circumstances, but the real lesson of the Laffer Curve is that some types of tax policy changes will result in changes to taxable income, and those shifts in taxable income will partially offset the impact of changes in tax rates.

However, even though both sides may need some education, it seems that the folks on the left are harder to teach – probably because the Laffer Curve is more of a threat to their core beliefs.

If you explain to a conservative politician that a goofy tax cut (such as a new loophole to help housing) won’t boost the economy and that the static revenue estimate from the bureaucrats at the Joint Committee on Taxation is probably right, they usually understand.

But liberal politicians get very agitated if you tell them that higher marginal tax rates on investors, entrepreneurs, and small business owners probably won’t generate much tax revenue because of incentives (and ability) to reduce taxable income.

To be fair, though, some folks on the left are open to real-world evidence. And this IRS data from the 1980s is particularly effective at helping them understand the high cost of class-warfare taxation.

There’s lots of data here, but pay close attention to the columns on the right and see how much income tax was collected from the rich in 1980, when the top tax rate was 70 percent, and how much was collected from the rich in 1988, when the top tax rate was 28 percent.

The key takeaway is that the IRS collected fives times as much income tax from the rich when the tax rate was far lower. This isn’t just an example of the Laffer Curve. It’s the Laffer Curve on steroids and it’s one of those rare examples of a tax cut paying for itself.

Folks on the right, however, should be careful about over-interpreting this data. There were lots of factors that presumably helped generate these results, including inflation, population growth, and some of Reagan’s other policies. So we don’t know whether the lower tax rates on the rich caused revenues to double, triple, or quadruple. Ask five economists and you’ll get nine answers.

But we do know that the rich paid much more when the tax rate was much lower.

This is an important lesson because Obama wants to run this experiment in reverse. He hasn’t proposed to push the top tax rate up to 70 percent, thank goodness, but the combined effect of his class-warfare policies would mean a substantial increase in marginal tax rates.

We don’t know the revenue-maximizing point of the Laffer Curve, but Obama seems determined to push tax rates so high that the government collects less revenue. Not that we should be surprised. During the 2008 campaign, he actually said he would like higher tax rates even if the government collected less revenue.

That’s class warfare on steroids, and it definitely belong on the list of the worst things Obama has ever said.

But I don’t care about the revenue-maximizing point of the Laffer Curve. Policy makers should set tax rates so we’re at the growth-maximizing level instead.

To broaden the understanding of the Laffer Curve, share these three videos with your friends and colleagues.

This first video explains the theory of the Laffer Curve.

This second video reviews some of the real-world evidence.

And this video exposes the biased an inaccurate “static scoring” of the Joint Committee on Taxation.

And once we educate everybody about the Laffer Curve, we can then concentrate on teaching them about the equivalent relationship on the spending side of the fiscal ledger, the Rahn Curve.

Read Full Post »

Greetings from frigid Minnesota. I’m in this misplaced part of the North Pole to testify before both the Senate and House Tax Committees today on issues related to the Laffer Curve.

In other words, I will be discussing how governments should measure the revenue impact of changes in tax policy – what is sometimes known as the dynamic scoring vs static scoring debate.

Most governments, including the folks in Washington, assume that tax policy has no impact on the economy. As such, it is relatively easy to measure how much revenue will rise or fall when tax policy is altered. After all, there are only two moving parts – tax rates and tax revenue.

So if tax rates double, revenues climb by 100 percent. If tax rates are reduced by 50 percent, tax revenues drop by one-half.

This is a slight over-simplification, but it does capture the basics of conventional revenue estimating. And it also shows why “static scoring” is deeply flawed. In the real world, people respond to incentives. When tax rates rise and fall, people change their behavior.

When tax rates are punitive, for instance, people earn and/or declare less income to the government. And when tax rates are reasonable, by contrast, people earn and/or declare more income to the government. In other words, there are actually three moving parts – tax rates, tax revenue, and taxable income.

Figuring out the relationship of these three variables is known as “dynamic scoring” and it is much more challenging that static scoring, but it is much more likely to give lawmakers correct information.

It does not mean, by the way, that “tax cuts pay for themselves” or that “tax increases lose revenue,” as GOPers sometimes claim. That only happens in rare circumstances.

If you want to understand this issue and be more knowledgeable than 99 percent of the people in government (not very difficult, so don’t let it go to your head), watch this three-part series on the Laffer Curve.

Read Full Post »

In the private sector, no business owner would be dumb enough to assume that higher prices automatically translate into proportionately higher revenues. If McDonald’s boosted hamburger prices by 30 percent, for instance, the experts at the company would fully expect that sales would decline. Depending on the magnitude of the drop, total revenue might still climb, but by far less than 30 percent. And it’s quite possible that the company would lose revenue. In the public sector, however, there is very little understanding of how the real world works. Here’s a Reuters story I saw on Tim Worstall’s blog, which reveals that Bulgaria and Romania both are losing revenue after increasing tobacco taxes.

Cash-strapped Bulgaria and Romania hoped taxing cigarettes would be an easy way to raise money but the hikes are driving smokers to a growing black market instead. Criminal gangs and impoverished Roma communities near borders with countries where prices are lower — Serbia, Macedonia, Moldova and Ukraine — have taken to smuggling which has wiped out gains from higher excise duties. Bulgaria increased taxes by nearly half this year and stepped up customs controls and police checks at shops and markets. Customs office data, however, shows tax revenues from cigarette sales so far in 2010 have fallen by nearly a third. …Overall losses from smuggling will probably outweigh tax gains as Bulgaria struggle to fight the growing black market, which has risen to over 30 percent of all cigarette sales and could cost 500 million levs in lost revenues this year, said Bezlov at the Center for the Study of Democracy. While the government expected higher income from taxes in 2010 it has already revised that to the same level as last year. “However, this (too) looks unlikely at present,” Bezlov added. Romania, desperately trying to keep a 20 billion-euro International Monetary Fund-led bailout deal on track, has a similar problem after nearly doubling cigarette prices in 2009 then hiking value added tax. Romania’s top three cigarette makers — units of British American Tobacco, Japan Tobacco International and Philip Morris — contributed roughly 2 billion euros to the budget in taxes in 2009, or just under 2 percent of GDP. They estimate about a third of cigarettes in Romania are smuggled and say this could cost the state over 1 billion euros.

Read Full Post »

I know I’ve beaten this drum several times before, but the Wall Street Journal today has a very good explanation of why class-warfare tax policy will backfire. The Journal’s editorial focuses on what happened after the 2003 tax rate reductions. And below the excerpt, you’ll find a table I prepared showing what happened with tax revenues from the rich following the Reagan tax cuts. The simple message is that lower tax rates are the best way to soak the rich.
Congress’s Joint Committee on Taxation recently dropped a study claiming that millionaires will pay $31 billion of the $36 billion in revenue that it expects will be raised next year if tax rates rise as scheduled on January 1. …If you believe that, you probably also believed Joint Tax when it predicted that the rich would gain a huge tax windfall when tax rates were cut in 2003. Let’s go to the videotape. According to the most recent IRS data on actual tax payments, total revenues collected over the period 2003-07 were about $350 billion higher than Joint Tax and the Congressional Budget Office predicted when the 2003 tax cuts were enacted. Moreover, the wealthiest taxpayers paid a larger share of all income taxes from the beginning to the end of this period. The IRS data show that in 2003 those with incomes above $200,000 paid $313 billion in income tax. By 2007 they paid $610 billion. …Guess what income group paid the most in higher taxes after tax rates were cut? Millionaires. From 2003 to 2008, millionaires increased their tax payments to $249 billion from $132 billion. One reason for the big increase in payments: the number of returns declaring $1 million or more in income increased 76% to 319,000 from 181,000 as the economy expanded. The IRS data are a useful reminder of how dependent Uncle Sam is on the rich to pay the government’s bills. …We’re not saying that tax cuts “pay for themselves.” What we are saying is that the 2003 tax cuts proved again, as we should have learned in the 1960s and 1980s, that rich people are the most responsive to changes in tax rates. When tax rates are high, the wealthy invest less, hire accountants to protect more of their income from the IRS, and park more of their money in tax shelters, such as municipal bonds. …That’s why it’s a fantasy to think that raising income and capital gains and dividend tax rates on the rich is going to pry $31 billion out of millionaire households. History teaches that the best way to soak the rich and reduce the deficit is to promote rapid economic growth. But that’s less likely to happen in 2011 if the economy is rear-ended with the biggest tax increase in at least 16 years.

Read Full Post »

I hope the title of this post is an exaggeration, but it’s certainly a logical conclusion based on what is written in the Congressional Budget Office’s updated Economic and Budget Outlook. The Capitol Hill bureaucracy basically has a deficit-über-alles view of fiscal policy. CBO’s long-run perspective, as shown by this excerpt, is that deficits reduce output by “crowding out” private capital and that anything that results in lower deficits (or larger surpluses) will improve economic performance – even if this means big increases in tax rates.

CBO has also examined an alternative fiscal scenario reflecting several changes to current law that are widely expected to occur or that would modify some provisions of law that might be difficult to sustain for a long period. That alternative scenario embodies small differences in outlays relative to those projected under current law but significant differences in revenues: Under that scenario, most of the cuts in individual income taxes enacted in 2001 and 2003 and now scheduled to expire at the end of this year (except the lower rates applying to high-income taxpayers) are extended through 2020; relief from the AMT, which expired after 2009, continues through 2020; and the 2009 estate tax rates and exemption amounts (adjusted for inflation) apply through 2020. …Under those alternative assumptions, real GDP would be…lower in subsequent years than under CBO’s baseline forecast. …Under that alternative fiscal scenario, real GDP would fall below the level in CBO’s baseline projections later in the coming decade because the larger budget deficits would reduce or “crowd out” investment in productive capital and result in a smaller capital stock.

There’s nothing necessarily wrong with CBO’s concern about deficits, but looking at fiscal policy through that prism is akin to deciding who wins a baseball game by looking at what happened during the 6th inning. Yes, government borrowing drains capital from the productive sector of the economy. And nations such as Greece are painful examples of what happens when governments go too far down this path. But taxes also undermine economic performance by reducing incentives to work, save, and invest. And nations such as France are gloomy reminders of what happens when punitive tax rates discourage productive behavior.

What’s missing for CBO’s analysis is any recognition or understanding that the real problem is excessive government spending. Regardless of whether spending is financed by borrowing or taxes, resources are being diverted from the private sector to government. In other words, government spending is the disease and deficits are basically a symptom of that underlying problem. Indeed, it’s worth noting that there’s not much evidence that deficits cause economic damage but plenty of evidence that bloated public sectors stunt growth. This video is a good antidote to CBO’s myopic focus on budget deficits.

Read Full Post »

Like the swallows returning to Capistrano, the Congressional Budget Office follows a predictable pattern of endorsing policies that result in bigger government. During the debate about the so-called stimulus, for instance, CBO said more spending and higher deficits would be good for the economy. It then followed up that analysis by claiming that the faux stimulus worked even though millions of jobs were lost. Then, during the Obamacare debate, CBO actually claimed that a giant new entitlement program would reduce deficits. Now that tax increases are the main topic (because of the looming expiration of the 2001 and 2003 tax bills), CBO has done a 180-degree turn and has published a document discussing the negative consequences of too much deficits and debt.
…persistent deficits and continually mounting debt would have several negative economic consequences for the United States. Some of those consequences would arise gradually: A growing portion of people’s savings would go to purchase government debt rather than toward investments in productive capital goods such as factories and computers; that “crowding out” of investment would lead to lower output and incomes than would otherwise occur. …a growing level of federal debt would also increase the probability of a sudden fiscal crisis, during which investors would lose confidence in the government’s ability to manage its budget, and the government would thereby lose its ability to borrow at affordable rates. …If the United States encountered a fiscal crisis, the abrupt rise in interest rates would reflect investors’ fears that the government would renege on the terms of its existing debt or that it would increase the supply of money to finance its activities or pay creditors and thereby boost inflation.
At some point, even Republicans should be smart enough to figure out that this game is rigged. Then again, the GOP controlled Congress for a dozen years and failed to reform either CBO or its counterpart on the revenue side, the Joint Committee on Taxation (which is infamous for its assumption that tax policy has no impact on overall economic performance).

Read Full Post »

The Wall Street Journal has an excellent editorial this morning on the obscure – but critically important – issue of measuring what happens to tax revenue in response to changes in tax policy. This is sometimes known as the dynamic scoring vs static scoring debate and sometimes referred to as the Laffer Curve controversy. The key thing to understand is that the Joint Committee on Taxation (which produces revenue estimates) assumes that even big changes in tax policy have zero macroeconomic impact. Adopt a flat tax? The JCT assumes no effect on the economic performance. Double tax rates? The JCT assumes no impact on growth. The JCT does include a few microeconomic effects into its revenue-estimating models (an increase in gas taxes, for instance, would reduce gasoline consumption), but it is quite likely that they underestimate the impact of high tax rates on incentives to work, save, and invest. We don’t know for sure, though, because the JCT refuses to make its methodology public. This raises a rather obvious question: Why is the JCT so afraid of transparency? Here’s some of what the WSJ had to say about the issue, including some comparisons of what the JCT predicted and what happened in the real world.
…it’s worth reviewing whether Joint Tax estimates are accurate. This is especially important now, because President Obama and Democrats in Congress want to allow the 2003 tax cuts to expire on January 1 for individuals earning more than $200,000. The JCT calculates that increasing the tax rates on capital gains, dividends and personal income will raise nearly $100 billion a year. …we are not saying that every tax cut “pays for itself.” Some tax cuts—such as temporary rebates—have little impact on growth and thus they may lose revenue more or less as Joint Tax predicts. Cuts in marginal rates, on the other hand, have substantial revenue effects, as economic studies have shown. In a 2005 paper “Dynamic Scoring: A Back-of-the-Envelope Guide,” Harvard economists Greg Mankiw and Matthew Weinzierl looked at the revenue feedback effects of tax cuts. They concluded that in all of the models they considered “the dynamic response of the economy to tax changes is too large to be ignored. In almost all cases, tax cuts are partly self-financing. This is especially true for cuts in capital income taxes.” We could cite other evidence that squares with what happened after tax cuts in the 1960s, 1980s and in 2003. So how well did Joint Tax do when it predicted a giant revenue decline from the 2003 investment tax cuts? Not too well. We compared the combined Congressional Budget Office and Joint Tax estimate of revenues after the 2003 tax cuts were enacted with the actual revenues collected from 2003-2007. In each year total federal revenues came in substantially higher than Joint Tax predicted—$434 billion higher than forecast over the five years. …As for capital gains tax receipts, they nearly tripled from 2003 to 2007, even though the capital gains tax rate fell to 15% from 20%. Yet the behavioral models that Mr. Barthold celebrates predicted that the capital gains cuts would cost the government just under $10 billion from 2003-07 when the actual capital gains revenues over five years were $221 billion higher than JCT and CBO predicted. …Estimating future federal tax revenues is an inexact science to be sure. Our complaint is that Joint Tax typically overestimates the revenue gains from raising tax rates, while overestimating the revenue losses from tax rate cuts. This leads to a policy bias in favor of higher tax rates, which is precisely what liberal Democrats wanted when they created the Joint Tax Committee.
All of the revenue-estimating issues are explained in greater detail in my three-part video series on the Laffer Curve. Part I looks at the theory. Part II looks at the evidence. Part III, which can be watched below, analyzes the role of the Joint Committee on Taxation and speculates on why the JCT refuses to be transparent.

Read Full Post »

While perusing the Internet, I saw an article by Iwan Morgan, who is the author of The Age of Deficits: Presidents and unbalanced Budgets from Jimmy Carter to George W. Bush. The author asserted in this article that, “The deficit explosion on his watch was a nasty surprise for Ronald Reagan not a deliberate strategy to reduce government.  In his rosy interpretation of Laffer curve theory, the personal tax cuts he promoted in 1981 would deliver higher not lower revenues through their boost to economic growth.” The first sentence is an interesting interpretation, since many leftists believe that Reagan deliberately created deficits to make it more difficult for Democrats in Congress to increase spending. I’m agnostic on that issue, but Morgan definitely errs (or is grossly incomplete) in the second sentence. The Reagan Administration did not employ dynamic scoring when predicting the revenue impact of its tax rate reductions. It is true that the White House failed to predict the drop in revenues, particularly in 1982, but that happened because of both the second stage of the 1980-82 double-dip recession and the unexpected drop in inflation (the Congressional Budget Office also failed to predict both of these events, so Reagan’s forecasters were hardly alone in their mistake). Moreover, Morgain’s dismissal of the Laffer Curve is unwarranted. While several GOP politicians exaggerated the relationship between tax rates, taxable income, and tax revenue, this does not mean it does not exist. The table below, which is based on data from the IRS’s Statistics of Income, shows what happened to tax collections from upper-income taxpayers between 1980 and 1988. Supply siders can be criticized for many things, especially their apparent disregard for the importance of limiting the size of government, but the IRS figures clearly show that lower tax rates were followed by more rich people, more taxable income, and more tax revenue. For those keeping score at home, that’s a perfect batting average for supply-side economics.

Read Full Post »

The indispensable editorial page of the Wall Street Journal blasts the phony spending “cuts” that are supposed to offset some of the new spending in the Senate health care bill. Sadly, the Congressional Budget Office has compromised its independence to help the left foist a fiscal fraud on the nation:

Washington spent the week waiting for the Congressional Budget Office to roll in with its new cost estimates of the Senate health-care bill, and what a carnival. Behold: a new $829 billion entitlement that will subsidize insurance for tens of millions of people—and reduce deficits by $81 billion at the same time. In the next tent, see the mermaid and a two-headed cow. …The irony is that the CBO’s guesstimate exposes the fraudulence and fiscal sleight-of-hand underlying this whole exercise. Anyone who reads beyond the top-line numbers will find that the bill creates massive new spending commitments that will inevitably explode over time, and that this is “paid for” with huge tax increases plus phantom spending cuts that will never happen in practice. …Liberals are demanding heftier subsidies, and once people see the deal their neighbors are getting on “free” health care, they too will want in. Even CBO seems to find this unrealistic, noting “These projections assume that the proposals are enacted and remain unchanged throughout the next two decades, which is often not the case for major legislation.” Scratch “often.” Then there are the many budget gimmicks. Take the “failsafe budgeting mechanism” that would require automatic cuts in exchange spending if it increases the deficit. CBO expects 15% reductions in exchange subsidies each year from 2015 to 2018, even though the exchanges don’t open until 2014. That kind of re-gifting should have been laughed out of the committee room, but the ruse helps to move future spending off the current budget “score.” Mr. Baucus spends $10.9 billion to eliminate the scheduled Medicare cuts to physician payments—but only for next year. In 2011, he assumes they’ll be reduced by 25%, with even deeper cuts later. Congress has overridden this “sustainable growth rate” every year since 2003 and will continue to do so because deeper cuts in Medicare’s price controls will cause many doctors to quit the program. Fixing this alone would add $245 billion to the bill’s costs, according to an earlier CBO estimate. The Baucus bill also expands ailing Medicaid by $345 billion—even as it busts state budgets by imposing an additional $33 billion unfunded mandate. …the bill piles on new taxes, albeit on health-care businesses so the costs are hidden from customers. Insurance companies offering policies that cost more than $8,000 for individuals and $21,000 for families will pay $201 billion per a 40% excise tax, which will be passed down to all policy holders in higher premiums. Another $180 billion will hit the likes of drug and device makers, including $29 billion because companies won’t be allowed to deduct these “fees” from their corporate income taxes. Then there’s the $4 billion in penalty payments on those who don’t buy insurance because all of ObamaCare’s other new taxes and mandates have made it more expensive.

Read Full Post »