Feeds:
Posts
Comments

Posts Tagged ‘World Bank’

Back in 2014, I shared a World Bank study that measured how tax complexity facilitates more corruption by government officials.

Not that anyone should have been surprised. Complex tax codes enable politicians to extort bribes when writing the law (a problem that definitely exists in Washington) and they makes it possible for bureaucrats to extort bribes when administering the system.

Now the World Bank has a new study showing how a larger regulatory burden enables and facilitates corruption.

The two authors, Mohammad Amin and Yew Chong Soh, wanted to use better types of data to get an accurate assessment of the problem.

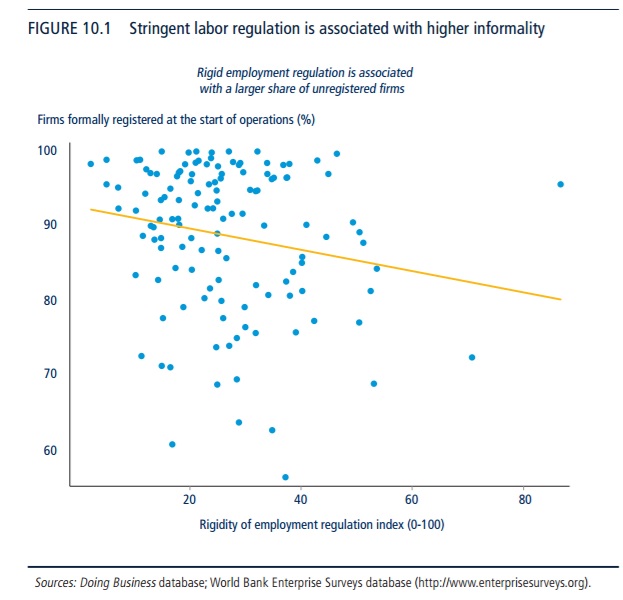
Business regulations often create opportunities for public officials to collect bribes… If true, this simple insight provides a practical and powerful way for deregulation to combat corruption and its many harmful effects on the economy. …Regulation is often measured by laws on the books rather than the actual regulatory burden on the firms even though it is the latter that is the primary determinant of corruption… The present paper attempts to fill this gap in the literature by using firm-level survey data on the actual corruption and regulatory burden experienced by the firms. …the public choice theory, stresses that regulation is intended to create rents to be distributed between the industry incumbents and the corrupt public officials. In some cases, the main beneficiary of regulation is the industry (regulatory capture view) while in others, it is the politicians and public officials (tollbooth view). …The present paper contributes to the…literature in several ways. …most previous studies have used perceived corruption indices…we depart from the literature by using firms’ experience with corruption instead. … for regulation, we use the actual regulatory burden experienced by the firms rather than rules on the books. This is an important departure from the literature.

For those not familiar with the term, “public choice” refers to research on the self-interested behavior of people in government.

Anyhow, prior research already showed that red tape gave politicians and bureaucrats the ability to extort money from the private economy.

…several studies analyze the possible effects of regulation on corruption. Using macro-level data for a cross-section of 85 countries in 1999, Djankov et al. (2002) look at the relationship between entry regulations and the level of corruption. …Consistent with the tollbooth view, the study finds strong evidence of higher corruption associated with heavier regulation of businesses. Using data from three worldwide firm surveys, Kaufmann and Wei (2000) confirm that when bribe-extracting bureaucrats can endogenously choose regulatory burden and delay, the effective (not just nominal) red tape and bribery can be positively correlated across firms.

The results in the new World Bank study build on the earlier research and confirm (as I noted in a video more than 10 years ago) more power for government means more corruption by government.

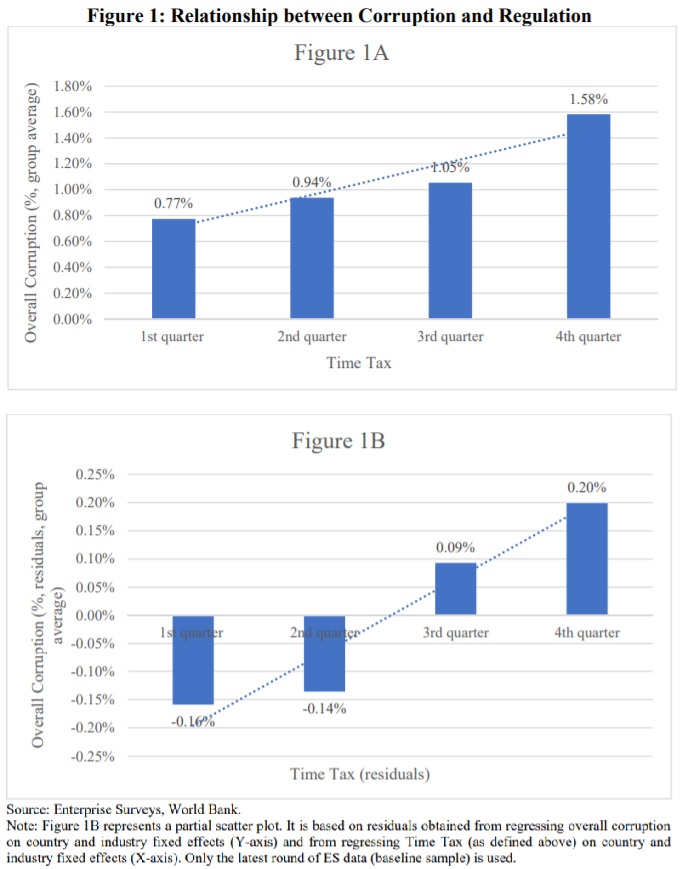
Our results show a large positive impact of the regulatory burden on the level of overall corruption as well as petty corruption. For the baseline specification, the overall bribery rate (bribes as percentage of firms’ annual sales) rises by about 0.03 percentage point for each percentage point increase in the regulatory burden. …The results show that irrespective of the set of controls, there is a large positive relationship between Overall Corruption and Time Tax… That is, for each percentage point increase in the regulatory burden, the overall bribe rate increases by 0.028 percentage point. Alternatively, an increase in regulatory burden from its minimum to maximum level leads to 2.8 percentage points increase in the level of overall corruption. This is a large increase given that the mean level of overall corruption equals about 1.1 percent.

By the way, “time tax” is defined as “the average of the percentage of senior management’s time spent in dealing with business regulations”

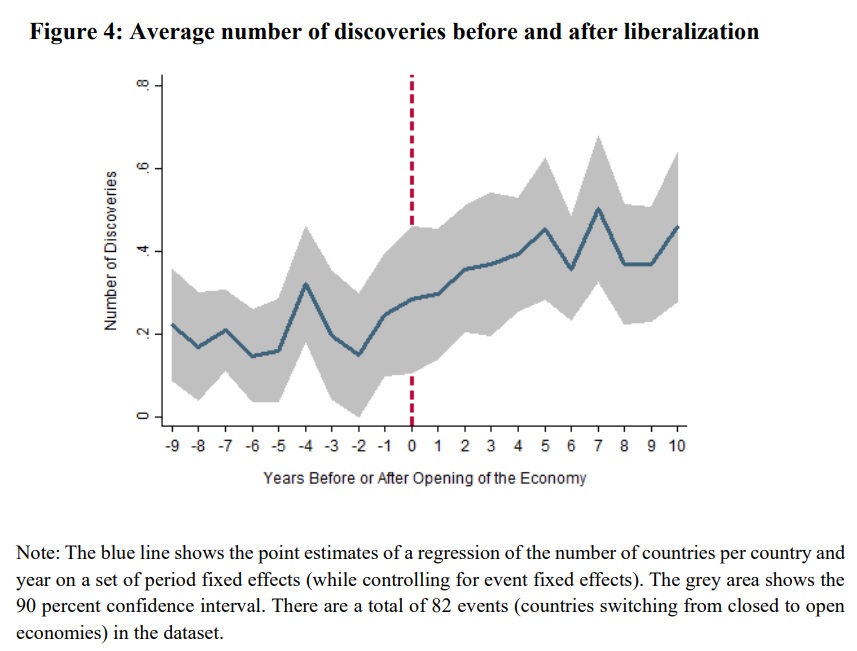
Here’s a graphic from the study for those of you who like digging into the empirical details.

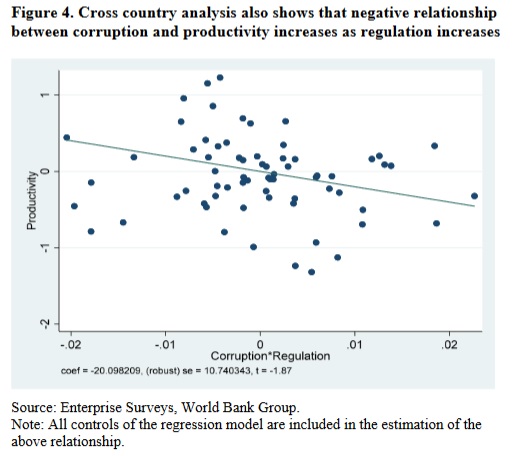
P.S. The World Bank also released a study last year showing how more regulation reduces business productivity. Needless to say, that ultimately translates into lower wages for workers.

P.P.S. I’ve been asked why the World Bank seems friendlier to good policy than either the International Monetary Fund or Organization for Economic Cooperation and Development. I point out that it’s not uncommon to see quality work from the professional economists at all international bureaucracies, even the IMF and OECD. But the World Bank seems to have a higher percentage of quality research. My guess it that this is a result of its focus on poverty alleviation.

Read Full Post »

The World Bank has released its annual report on the Ease of Doing Business.

Unsurprisingly, the top spots are dominated by market-oriented jurisdictions, with New Zealand, Singapore, and Hong Kong (at least for now!) winning the gold, silver, and bronze. The United States does reasonably well, finishing in sixth place.

It’s also worth noting that Nordic nations do quite well. Denmark even beats the United States, and Norway and Sweden are both in the top 10.

Georgia gets a very good score, as does Taiwan. And I’m sure Pope Francis will be irked to see that Mauritius ranks highly.

I’m surprised, though, to see Russia at #28 and China at #31. That’s better than France!

And I’m even more surprised that normally laissez-faire Switzerland is down at #36.

What economic lessons can we learn from the report? First, the authors remind us that less red tape means more prosperity.

Research demonstrates a causal relationship between economic freedom and gross domestic product (GDP) growth, where freedom regarding wages and prices, property rights, and licensing requirements leads to economic development. … The ease of doing business score serves as the basis for ranking economies on their business environment: the ranking is obtained by sorting the economies by their scores. The ease of doing business score shows an economy’s absolute position relative to the best regulatory performance, whereas the ease of doing business ranking is an indication of an economy’s position relative to that of other economies.

By the way, here’s a simple depiction of the World Bank’s methodology.

It’s also worth noting that less intervention means less corruption.

There are ample opportunities for corruption in economies where excessive red tape and extensive interactions between private sector actors and regulatory agencies are necessary to get things done. The 20 worst-scoring economies on Transparency International’s Corruption Perceptions Index average 8 procedures to start a business and 15 to obtain a building permit. Conversely, the 20 best-performing economies complete the same formalities with 4 and 11 steps, respectively. Moreover, economies that have adopted electronic means of compliance with regulatory requirements—such as obtaining licenses and paying taxes—experience a lower incidence of bribery.

Poor countries, not surprisingly, have more red tape.

An entrepreneur in a low-income economy typically spends around 50 percent of the country’s per-capita income to launch a company, compared with just 4.2 percent for an entrepreneur in a high-income economy. It takes nearly six times as long on average to start a business in the economies ranked in the bottom 50 as in the top 20. There’s ample room for developing economies to catch up with developed countries on most of the Doing Business indicators. Performance in the area of legal rights, for example, remains weakest among low- and middle-income economies.

Africa and Latin America are especially bad.

Sub-Saharan Africa remains one of the weak-performing regions on the ease of doing business with an average score of 51.8, well below the OECD high-income economy average of 78.4 and the global average of 63.0. …Latin America and the Caribbean also lags in terms of reform implementation and impact. …not a single economy in Latin America and the Caribbean ranks among the top 50 on the ease of doing business.

I’m disappointed, by the way, that Chile is only ranked #59.

Now let’s shift to some very important graphs about the relationship between economic freedom and national prosperity.

We’ll start with a look at the relationship between employment regulation and per-capita income. Not surprisingly, countries that make it hard to hire workers and fire workers have lower levels of prosperity.

Here’s a chart showing the relationship between employment regulation and the underground economy.

The moral of the story is that lots of red tape drives employers and employees to the black market.

Perhaps most important, there’s a very clear link between good regulatory policy and overall entrepreneurship.

Here’s a bit of good news.

Developing nations have reduced the burden of red tape in some areas, in part because Ease of Doing Business puts pressure on governments.

We can see the results in this chart.

I’ll close with a look at the regulatory burden in the United States, which also can be considered good news.

Here’s the annual score for the past five years (a higher number is better).

I’m frequently critical of this White House, but I also believe in giving credit when it’s deserved. The bottom line is that Trump’s policies have been a net plus for businesses.

In other words, lower tax rates and less red tape have more than offset the pain of protectionism.

Read Full Post »

The great French economist from the 1800s, Frederic Bastiat, famously explained that good economists are aware that government policies have indirect effects (the “unseen”).

Bad economists, by contrast, only consider direct effects (the “seen”).

Let’s look at the debate over stadium subsidies. Tim Carney of the American Enterprise Institute narrates a video showing how the “unseen” costs of government favoritism are greater than the “seen” benefits.

Unfortunately, stadium subsidies are just the tip of the cronyism iceberg.

In a column for the Dallas Morning News, Dean Stansel of Southern Methodist University discussed some of his research on the topic.

While state and local economic development incentives may seem to help the local economy, the offsetting costs are usually ignored, so the overall effect is unclear. Furthermore, from the perspective of the nation as a whole, these policies are clearly a net loss. …In a new research paper, my colleague, Meg Tuszynski, and I examined whether there is any relationship between economic development incentive programs and five measures of entrepreneurial activity. Like the previous literature in this area, we found virtually no evidence of a positive relationship. In fact, we found a negative relationship with patent activity, a key measure of new innovation. …A recent study by the Mercatus Center found that 12 states could reduce their corporate income tax by more than 20 percent if incentive programs were eliminated. That includes a 24 percent cut in Texas’ business franchise tax. In six states, it could either be completely eliminated or reduced by more than 90 percent. These are big savings that would provide substantial tax relief to all businesses, both big and small, not just those with political influence. …That would provide a more level playing field in which all businesses can thrive.

And here’s a Wall Street Journal editorial from earlier the year.

Amazon left New York at the altar, turning down a dowry of $3 billion in subsidies. Foxconn’s promised new factory in Wisconsin, enticed with $4 billion in incentives, has fallen into doubt. …Now add General Electric , which announced…it will renege on its plan to build a glassy, 12-story headquarters on Boston’s waterfront. …The company reportedly…pledged to bring 800 jobs to Boston. In exchange, the city and state offered $145 million in incentives, including tax breaks and infrastructure funds. GE’s boss at the time, Jeff Immelt, said not to worry: For every public dollar spent, “you will get back one thousand fold, take my word for it.” …two CEOs later, a beleaguered GE won’t be building that fancy tower at all. There won’t even be 800 jobs. …GE will lease back enough space in two existing brick buildings for 250 employees. …what a failure of corporate welfare.

Let’s wrap this up with a look at some additional scholarly research.

Economists for the World Bank investigated government favoritism in Egypt and found that cronyism rewards politically connected companies at the expense of the overall economy.

This paper presents new evidence that cronyism reduces long-term economic growth by discouraging firms’ innovation activities. …The analysis finds that the probability that firms invest in products new to the firm increases from under 1 percent for politically connected firms to over 7 percent for unconnected firms. The results are robust across different innovation measures. Despite innovating less, politically connected firms are more capital intensive, as they face lower marginal cost of capital due to the generous policy privileges they receive, including exclusive access to input subsidies, public procurement contracts, favorable exchange rates, and financing from politically connected banks. …The findings suggest that connected firms out-rival their competitors by lobbying for privileges instead of innovating. In the aggregate, these policy privileges reduce…long-term growth potential by diverting resources away from innovation to the inefficient capital accumulation of a few large, connected firms.

For economics wonks, here’s Table 2 from the study, showing how subsidies are associated with less innovation.

The World Bank also found awful results because of cronyism in Ukraine.

But this isn’t a problem only in developing nations.

There’s some depressing research about the growing prevalence of cronyism in the United States (ethanol handouts, the Export-Import Bankprotectionismtax favoritismbailoutssubsidies, and green energy are just a few examples of how the friends of politicians get unearned wealth).

Cronyism is bad under Democrats and it’s bad under Republicans. Time for separation of business and state!

Read Full Post »

When I wrote last month about the Green New Deal, I warned that it was cronyism on steroids.

Simply stated, the proposal gives politicians massive new powers to intervene and this would be a recipe for staggering levels of Solyndra-style corruption.

Well, the World Bank has some new scholarly research that echoes my concerns. Two economists investigated the relationship with the regulatory burden and corruption.

Empirical studies such as Meon and Sekkat (2005) and De Rosa et al. (2010) show that corruption is more damaging for economic performance at higher levels of regulation or lower levels of governance quality. …Building on the above literature, in this paper, we use firm-level survey data on 39,732 firms in 111 countries collected by the World Bank’s Enterprise Surveys between 2009 and 2017 to test the hypothesis that corruption impedes firm productivity more at higher levels of regulation. …estimate the model using sample weighted OLS (Ordinary Least Squares) regression analysis.

And what did they discover?

We find that the negative relationship between corruption and productivity is amplified at high levels of regulation. In fact, at low levels of regulation, the relationship between corruption and productivity is insignificant. …we find that a 1 percent increase in bribes that firms pay to get things done, expressed as the share of annual sales, is significantly associated with about a 0.9 percent decrease in productivity of firms at the 75th percentile value of regulation (high regulation). In contrast, at the 25th percentile value of regulation (low regulation), the corresponding change is very small and statistically insignificant, though it is still negative. …after we control for investment, skills and raw materials, the coefficients of the interaction term between corruption and regulation became much larger… This provides support for the hypothesis that corruption is more damaging for productivity at higher levels of regulation.

Lord Acton famously wrote that “power corrupts, and absolute power corrupts absolutely.”

Based on the results from the World Bank study, we can say “regulation corrupts, and added regulation corrupts additionally.”

Not very poetic, but definitely accurate.

Figure 4 from the study shows this relationship.

Seems like we need separation of business and state, not just separation of church and state.

This gives me a good excuse to recycle this video I narrated more than 10 years ago.

P.S. Five years ago, I cited a World Bank study showing that tax complexity facilitates corruption. Which means a simple and fair flat tax isn’t merely a way of achieving more prosperity, it’s also a way of draining the swamp.

The moral of the story – whether we’re looking at red tape, taxes, spending, trade, or any other issue – is that smaller government is the most effective way of reducing sleaze and corruption.

Read Full Post »

A couple of weeks ago, I used a story about a local tax issue in Washington, DC, to make an important point about how new tax increases cause more damage than previous tax increases because “deadweight losses” increase geometrically rather than arithmetically.

Simply stated, if a tax of X does Y amount of damage, then a tax of 2X will do a lot more damage than 2Y.

This is the core economic reason why even left-leaning international bureaucracies agree that class-warfare taxes are so destructive. When you take a high tax rate and make it even higher, the damage grows exponentially.

As such, I was very interested to see a new study on this topic from the World Bank. It starts by noting that higher tax rates are the wrong way to address fiscal shortfalls.

…studies have used the narrative approach for individual or multi-country analyses (in all cases, focusing solely on industrial economies, and mostly on industrial European countries). These studies find large negative tax multipliers, ranging between 2 and 5. This recent consensus pointing to large negative tax multipliers, especially in industrial European countries, naturally entails important policy prescriptions. For example, as part of a more comprehensive series of papers focusing on spending and tax multipliers, Alesina, Favero, and Giavazzi (2015) point that policies based upon spending cuts are much less costly in terms of short run output losses than tax based adjustments.

The four authors used data on value-added taxes to investigate whether higher tax rates did more damage or less damage in developing nations.

A natural question is whether large negative tax multipliers are a robust empirical regularity… In order to answer this highly relevant academic and policy question, one would ideally need to conduct a study using a more global sample including industrial and, particularly, developing countries. …This paper takes on this challenge by focusing on 51 countries (21 industrial and 30 developing) for the period 1970-2014. …we focus our efforts on building a new series for quarterly standard value-added tax rates (henceforth VAT rates). …We identify a total of 96 VAT rate changes in 35 countries (18 industrial and 17 developing).

The economists found that VAT increases did the most damage in developing nations.

…when splitting the sample into industrial European economies and the rest of countries, we find tax multipliers of 3:6 and 1:2, respectively. While the tax multiplier in industrial European economies is quite negative and statistically significant (in line with recent studies), it is about 3 times smaller (in absolute value) and borderline statistically significant for the rest of countries.

Here’s a chart showing the comparison.

Now here’s the part that merits close attention.

The study confirms that the deadweight loss of VAT hikes is higher in developed nations because the initial tax burden is higher.

Based on different types of macroeconomic models (which in turn rely on different mechanisms), the output effect of tax changes is expected to be small at low initial levels of taxation but exponentially larger when initial tax levels are high. Therefore, the distortions and disincentives imposed by taxation on economic activity are directly, and non-linearly, related to the level of tax rates. By the same token, for a given level of initial tax rates, larger tax rate changes have larger tax multipliers. …In line with theoretical distortionary and disincentive-based arguments, we find, using our novel worldwide narrative, that the effect of tax changes on output is indeed highly non-linear. Our empirical findings show that the tax multiplier is essentially zero under relatively low/moderate initial tax rate levels and more negative as the initial tax rate and the size of the change in the tax rate increase. …This evidence strongly supports distortionary and disincentive-based arguments regarding a nonlinear effect of tax rate changes on economic activity…the economy will inevitably suffer when taxes are increased at higher initial tax rate levels.

What makes these finding especially powerful is that value-added taxes are less destructive than income taxes on a per-dollar-raised basis.

So if taking a high VAT rate and making it even higher causes a disproportionate amount of economic damage, then imagine how destructive it is to increase top income tax rates.

P.S. The fact that a VAT is less destructive than an income tax is definitely not an argument for enacting a VAT. That would be akin to arguing that it would be fun to break your wrist because that wouldn’t hurt as much as the broken leg you already have.

I’ve even dealt with people who actually argue that a VAT isn’t economically destructive because it imposes the same tax on current consumption and future consumption. I agree with them that it is a good idea to avoid double taxation of saving and investment, but that doesn’t change the fact that a VAT increases the wedge between pre-tax income and post-tax consumption.

And that means less incentive to earn income in the first place.

Which is confirmed by the study.

Panels A and B in Figure 18 show the relationship between the VAT rate a and the perceived effect of taxes on incentives to work and invest, respectively, for a sample of 123 countries for the year 2014. Supporting our previous findings, the relationship is highly non-linear. While the perceived effect of taxes on the incentives to work and invest barely changes as VAT rates increase at low/moderate levels (approximately until the VAT rate reaches 14 percent), it falls rapidly for high levels of VAT rates.

Here’s the relevant chart from the report.

The moral of the story is that all tax increases are misguided, but class-warfare taxes wreak the most economic havoc.

P.S. Not everyone understands this common-sense observation. For instance, the bureaucrats at the Congressional Budget Office basically argued back in 2010 that a 100 percent tax rate was the way to maximize growth.

Read Full Post »

There was a book last decade by Thomas Frank, What’s the Matter with Kansas?, that asked why lower-income voters in the state didn’t vote for greater levels of redistribution.

The author claimed these voters were sidetracked by cultural issues, which may very well be part of the story. I like to think that these Kansans also were motivated by ethics and that they realized it would be wrong to use government coercion to take money from other people.

And maybe, unlike the folks at the IMF, they were not motivated by envy and they realized that high taxes and more redistribution would make them worse off over time because of the negative impact on overall prosperity.

Well, it appears that the folks in Kansas aren’t that different from people in India, Morocco, Nigeria, Mexico, and South Africa. At least that’s the takeaway from some new research that Christopher Hoy wrote about for the World Bank. Here’s the issue he investigated.

Social commentators and researchers struggle to explain why, despite growing inequality in many countries around the world,  there is often relatively limited support among poorer people for policies where they are set to benefit (such as increases in cash transfers or in the minimum wage). …Conventional theories of preferences for redistribution, such as the Meltzer-Richard Hypothesis, imply that if poor people were made aware they were relatively poorer than most other people in their country, they would become more supportive of redistribution. Yet there is little empirical evidence that evaluates this prediction. …empirical evidence is needed to understand how poorer people’s misperceptions of their relative position in the national income distribution effects their support for redistribution.

Here’s the methodology he used.

I conducted the first cross country survey experiment on preferences for redistribution in the developing world… The experiment involved over 16,000 respondents in five developing countries that make up almost 25% of the global population (India, Nigeria, Mexico, South Africa and Morocco). …To test whether informing poor people of their relative position in the national income distribution makes them more supportive of redistribution, I randomly allocate half of the respondents in each country to be told which quintile their household belongs to in the national income distribution (based upon their reported household income and the number of household members). …After the treatment they were asked if they thought the gap between the rich and poor was too large and whether the government was responsible for closing this gap.

And here are some of the results.

People tend to think they are in the middle of the income distribution, regardless of whether they are rich or poor. …poor people who perceived themselves to be in the bottom two quintiles of the distribution were between 15 to 28 percentage points more likely to prefer lower levels of inequality than poor people who perceived themselves to be in the top two quintiles. …Surprisingly, telling poor people that they are poorer than they thought makes them less concerned about the gap between the rich and poor in their country…there was no effect from the treatment on these people’s support for the government to close the gap between the rich and poor.

Here’s a chart showing how people became less sympathetic to government-coerced redistribution after learning more about their own economic status.

The author speculates on possible reasons for these results.

A plausible channel that is causing this effect is people using their own living standard as a ‘benchmark’ for what they consider acceptable for others. …people…realise two points. Firstly, there are fewer people in their country with a living standard they considered to be relatively poor than they had thought. Secondly, what they had considered to be an ‘average’ living standard (their own standard of living) is actually relatively poor compared to other people in their country. I show how both of these points would lead people to respond by being less likely to be concerned about the gap between the rich and poor in their country. …there are opposing channels through which poorer people’s preferences for redistribution respond to information about their relative position. On the one hand, poorer people may be more supportive if they are set to benefit from redistribution. However, on the other hand they may be less supportive if they are less concerned about the absolute living standard of people who are relatively poor.

These are all plausible answers.

Though I have the same questions about this research as I did about Frank’s book. Do people in these five developing nations have any level of moral aversion to redistribution and/or do they understand (at least implicitly) that a tax-and-redistribute model is a recipe for national economic decline?

Perhaps a more practical way of looking at the issue is to ask whether lower-income people care most about economic growth or economic inequality.

Many of the professional left, including the ideologues at the IMF, are fixated on the latter and they’re willing to hurt the poor if the rich suffer even greater harm (in other words, Margaret Thatcher was right about their motives).

By contrast, I strongly suspect the average lower-income person is far more interested in more prosperity for their family and far less concerned about the prosperity of the rich family on the other side of town. They presumably are unaware of the powerful Chinese data on poverty reduction and inequality, but they instinctively understand that a rising tide lifts all boats.

Read Full Post »

I don’t like writing about deficits and debt because I don’t want to deflect attention from the more important underlying problem of excessive government spending.

Indeed, I constantly explain that spending is what diverts resources from the productive sector of the economy, regardless of whether outlays are financed by taxes or borrowing. This is why a spending cap is far and away the best rule for fiscal policy.

That being said, red ink does matter when politicians incur so much debt that investors (i.e., the folks in the private sector who buy government debt) decide that a government no longer is trustworthy. And when that happens, interest rates climb because investors insist on getting a higher return to compensate for the risk of default.

And if things really deteriorate, a government may default (i.e., no longer make promised payments) and investors obviously will refuse to lend any more money. That’s basically what happened in Greece.

Sadly, most governments have not learned from Greece’s mistakes. Indeed, government debt in Europe is now significantly higher than it was before the 2008 recession.

This suggests that there will be another fiscal crisis when the next recession occurs. Italy presumably will be the big domino to fall, though there are many other nations in Europe that could get in trouble.

But the problems of excessive spending and excessive debt are not limited to Europe. Or Japan.

The World Bank has a new report that shows that red ink is a growing problem in the rest of the world. More specifically, the report is about “fiscal space,” which some see as a measure of budgetary flexibility but I interpret as an indicator of budgetary vulnerability. Here’s how it is defined in the report.

…fiscal space is simply defined as the availability of budgetary resources to conduct effective fiscal policy. …some studies define it as the budgetary room to create and allocate funding for a certain purpose without threatening a sovereign’s financial position. …Debt service capacity is a critical component of fiscal space. It has multiple dimensions, including financing needs that are related to budget positions and debt rollover, access to liquid markets, resilience to changes in market valuations of debt, and the coverage of contingent liabilities. …Market participants’ perceptions of sovereign risk reflect and, in turn, influence an economy’s ability to tap markets and service its obligations. Thus, fiscal space can function as an essential instrument of macroeconomic risk management.

And what is “effective fiscal policy”?

From the World Bank’s misguided perspective, it’s the ability to engage in Keynesian spending.

Countries with ample fiscal space can use stimulus measures more extensively.

But let’s set aside that anti-empirical assertion.

I found the report useful (though depressing) because it had data showing how debt levels have increased, especially in emerging market and developing economies (EMDEs).

Fiscal space improved during 2000−07, but has shrunk around the world since the global financial crisis. …debt sustainability indicators, including government debt and fiscal sustainability gaps, have deteriorated in at least three-quarters of countries in the world. …and perceptions of market participants on sovereign credit risks have worsened. …Since 2011, fiscal space has shrunk in EMDEs. …fiscal deficits widened to 3 to 5 percent of GDP in 2016, on average… Government debt has risen to 54 percent of GDP, on average, in 2017. …EMDEs need to shore up fiscal positions to prevent sudden spikes in financing costs… Fiscal space has been shrinking in EMDEs since the global financial crisis. It needs to be strengthened.

Here is a set of charts from the report, showing both developed nations (red lines) and developing nations (yellow lines). The top-left chart shows debt climbing for EMDEs and the bottom-right chart shows debt ratings dropping for EMDEs.

The EMDEs have lower debt levels, but their debt is rated as more risky because poorer nations don’t have a very good track record of dealing with recessions and fiscal crises (would you lend money to Argentina?).

In any event, the yellow lines in the top-left chart and bottom-right chart are both headed in the wrong directions.

The bottom line? It won’t just be European welfare states that get in trouble when there’s another recession.

By the way, the report from the World Bank offers some policy advice. Some of it potentially good.

Pension reforms could…support fiscal credibility and generate long-term fiscal gains… credible and well-designed institutional mechanisms can help support fiscal discipline and strengthen fiscal space. …Fiscal rules impose numerical constraints on budgetary aggregates—debt, overall balance, expenditures.

But most of it bad.

Fiscal sustainability could be improved by increasing the efficiency of revenue collection… Measures to strengthen revenue collection could include broadening tax bases to remove loopholes for higher-income households or profitable corporates. In countries with high levels of informality, taxing the informal sector—for example, by promoting a change in payment methods to non-cash transaction and facilitating collective action by informal sector associations—could help raise revenues directly, as well as indirectly… In EMDEs, reforms to broaden revenue bases and strengthen tax administration can generate revenue gains.

At the risk of stating the obvious, the problem in developing nations is bad government policy, not insufficient revenue in the hands of politicians.

P.S. I included the caveat that some of the recommendations were “potentially good” since the report didn’t specify the type of pension reform or the type of fiscal rule. I like to think the authors were referring to personal retirement accounts and spending caps, but it’s not clear.

P.P.S. The IMF subsidizes and encourages bad fiscal policy with bailouts. Fortunately, there is a much more sensible approach.

Read Full Post »

When asked to pick the worst international bureaucracy, I generally respond as follows.

The International Monetary Fund (IMF) or Organization for Economic Cooperation and Development (OECD) should be at the top of the list. Both of those bureaucracies aggressively push statist policies designed to give governments more power over people. I have mixed feelings about which one deserves to be called the worst bureaucracy.

Next on my list are the United Nations (UN) and European Bank for Reconstruction and Development (EBRD). Many people are surprised the UN isn’t higher on the list, but I point out that the organization generally is very ineffective. Meanwhile, the EBRD is relatively unknown, but I have total disdain for its cronyist business model (basically a global version of the Export-Import Bank).

At the bottom of my list is the World Bank (WB). I don’t have knee-jerk hostility to the WB, in part because the bureaucrats historically have their hearts in the right place (reducing poverty) and even occasionally support the right policies (social security reform and regulatory relief).

Nonetheless, I was disappointed earlier this year to learn that the Trump Administration decided to give more money to the World Bank.

The Trump administration is backing a $13 billion increase in funding for the World Bank… The change…will allow the bank to increase lending to poor-country clients… The U.S. is the only country with veto power over any changes in bank structure, so funding increases cannot proceed without Washington’s support. …The shift to U.S. support for more funding at the Bank took some European governments by surprise, said Suma Chakrabarti, president of the European Bank for Reconstruction and Development, a London-based multilateral bank lending in Europe, the Middle East and North Africa. He said in an interview Thursday that the capital increase is “very good news,” since it would help efforts to reduce global poverty. …Mr. Mnuchin said he would work with Congress to secure approval for the U.S. contribution, a step that has in the past proved challenging.

Hopefully it will prove impossible rather than challenging to get approval for more funding (though I haven’t been following the issue, so maybe Republicans in Congress already have okayed an expansion).

Assuming the decision hasn’t yet been made, I have some evidence showing why the World Bank doesn’t deserve more funding.

And not merely because aid is not the route to prosperity. Consider the misguided advice that the World Bank is pushing on Romania.

The Romanian government should…consider switching the flat income tax to a progressive tax, said World Bank chief economist for Europe and Central Asia, Hans Timmer. …The World Bank representative…referred to the flat tax rate…, stating that they should think about whether this system is still appropriate. The World Bank’s advice would be to rethink the entire labor market taxation system in coordination with other countries in the region, and not just make small changes. ”We can not tell you what the solution is, but you need to analyze everything, including the single tax, and whether you’d be better off implementing a progressive tax system, meaning those who earn more pay more,” Timmer said.

This is horrible advice. The flat tax is very conducive to prosperity and Romania needs fast growth to help offset the damage caused by decades of communist enslavement.

Moreover, there are problems with corruption in Romania and the World Bank has admitted that tax complexity facilitates corruption.

Given Mr. Timmer’s misguided musings, I may need to get a new version of my cartoon about international bureaucracies. Especially since the World Bank once produced a study giving nations higher grades for having more oppressive tax systems.

P.S. In fairness, the WB has produced some good work on government spending, dependency, financial regulation, and free markets.

P.P.S. And I especially like the World Bank’s comparison of Chile and Venezuela.

Read Full Post »

I explained last year that there is an inverse relationship between government efficiency and the size of government.

And Mark Steyn made the same point, using humor, back in 2012.

Interestingly, we have some unexpected allies.

In a recently released study, two economists for the World Bank decided to investigate the effectiveness of government spending.

Governments of developing countries typically spend resources equivalent to between 15 and 30 percent of GDP. Hence, small changes in the efficiency of public spending could have a significant impact on GDP and on the attainment of the government’s objectives. The first challenge faced by stakeholders is measuring efficiency. This paper attempts such quantification and verifies empirical regularities in the cross country-variation in the efficiency scores.

So they calculated how much different governments were spending and the results that were being achieved.

Using two different methodologies, here’s what they found for health spending and life expectancy.

The goal, of course, is to get good results (to be higher on the vertical axis) without having to spend a lot of money (in other words, try to be farther left on the horizontal axis).

And here are the numbers for education quality and education spending.

The economist then crunched all the numbers to determine the relationship between spending and outcomes.

The results may surprise some people.

Government expenditure (GOVEXP) is negatively associated with efficiency scores in education (Tables 14 a and b). This result is robust to changes in the output indicator selected. In the output efficiency case, the impact is ambiguous specially when the PISA Math and Science scores are the output indicators (Table 14 b). In health (Tables 15 a and b), the negative association is present in both input and output efficiency. In infrastructure, the expenditure variables (GOVEXP and PUBGFC10PC) are negative in the six output indicators that are used (Table 16a).23 There is a robust trade-off between size of expenditure and efficiency. …The share of public financing within the total (sum of public and private) is robustly associated with lower efficiency scores.

But here’s another surprise.

These World Bank results are not an outlier.

The European Central Bank has two separate studies (here and here) that conclude smaller government is more effective.

And the International Monetary Fund found that decentralized government is more efficient.

P.S. Don’t forget that this competency argument for small government is augmented by the economic argument for small government.

Read Full Post »

I periodically explain that pro-market policies are the best way of helping poor people.

The reason rich countries are rich is because they had lengthy periods of limited government, free markets, and the rule of law.

And the convergence literature shows that the same thing is true for developing nations.

Today, let’s look at some new research from the World Bank on how good policy plays a role in generating wealth from natural resources. The authors start by explaining the issue they want to investigate.

The literature on economic development often assumes that natural resource endowments are exogenous. …the resource economics literature has emphasized that the resource base is endogenous to investment in exploration and extraction. That literature has, however, overlooked the role that market orientation and institutions play in driving investments in the resource sector. Our aim is to bridge the gap between these two literatures and explore the effect of market orientation on the discovery of proven (known) natural resource wealth.

They cite the United States as an example of a country that benefited from the right policies.

The experience of the United States during the nineteenth and early twentieth century provides a historical account of the role of market orientation in driving natural wealth. Although the United States at the time of independence was considered to be a country of “abundance of land but virtually no mining potential” (O’Toole, 1977), by 1913 it was the world’s dominant producer of virtually every major industrial mineral (David and Wright, 1997). Rather than being driven by a comparative advantage in geological endowments, this resource-based development of the United States was driven among other things by an open market orientation and an accommodating legal environment with the government claiming no ultimate title to mineral rents

And they note that there is additional anecdotal evidence that liberalization produces good results.

Anecdotal evidence suggests that increased market orientation was followed by increased discoveries across continents and types of natural resources (see Table 1). The increase in discoveries after countries open up to the global economy appears to be quite stark. In Peru, for example, discoveries more than quadrupled, in Chile they tripled, and in Mexico they doubled. In Ghana, discoveries only started to occur after the opening of the economy.

Here’s a table showing the dramatic increase in discoveries after selected nations shift to a pro-market approach.

The authors want to see if such results are either random or policy-driven.

So they put together a detailed model and gathered lots of data.

…we put forward a simple two-region model of endogenous reserves based on Pindyck (1978) where multinational corporations are faced with an implicit tax which proxies for how closed market orientation is, and seek the lowest cost location. The model explores the interplay between market orientation and other channels such as the increase in the marginal cost of discoveries and (demand driven) natural resource price shocks. …For our empirical analysis we build a unique and hitherto unexploited dataset of the universe of world-wide major natural resource discoveries since 1950, covering 128 countries, 33 types of natural resources and over 60 years.

Here’s an example of the data they utilized.

And here are the results.

I’m not surprised to learn that good policy (i.e., free markets) generate a substantial increase in economic activity.

…our empirical analysis shows that market orientation causes a statistically and economically significant increase in natural resource discoveries. Our point estimates indicate that going from a closed to an open market orientation increases discoveries by 80-140 percent. …In a thought experiment whereby economies in Latin America and sub-Saharan Africa remained closed, they would have only achieved one quarter of the actual increase in discoveries they have experienced since the early 1990s.

The benefits are especially significant in developing nations, where market reforms appear to have produced a four-fold increase in the discovery of natural resources.

Here’s a look at the data for the entire study.

As you can see, there’s always an element of randomness and uncertainty in econometric research (“noise”), but the trend is readily apparent and the statistical tests provide a good amount of confidence about the strength of the relationship between more economic freedom and more economic activity.

I have two takeaways from this research.

First, we have the obvious result that property rights, rule of law, and other market-based policies are needed to help the poor.

Second, this is additional confirmation of my gut feeling that the World Bank is the best (least worst?) of the international bureaucracies. Yes, they waste money and are capable of producing bad research, but the organization’s culture seems to be focused on what changes are needed to help poor countries. And that often results in solid research (for other examples, see here, here, here, here, and here).

You can occasionally find good analysis from other international bureaucracies, such as the OECD and IMF, but it’s far more likely that those organizations will promote statist analysis because of a pro-government mindset.

Read Full Post »

To be blunt, I don’t think the World Bank should exist. We don’t need an international bureaucracy to promote economic development in poor nations. Particularly since the policies that we know will work – free markets and small government – oftentimes are hindered by intervention from multilateral institutions such as the World Bank.

For example, I’ve spent the past few days in Vanuatu, where I’ve been fighting against the adoption of an income tax, and I’ve been repeatedly told that the World Bank is one of the groups (along with the Australian Tax Office) urging the adoption of this anti-growth levy. It is both depressing and upsetting that outsiders are seeking to hinder growth in this poor nation, but what really galls me is that World Bank bureaucrats (like their colleagues at other international bureaucracies) are exempt from paying any income tax.

All this being said, my general philosophical hostility (and, in Vanuatu, targeted genuine anger) toward the World Bank doesn’t preclude me from admitting when the bureaucracy does good work. It has played a positive role in helping some nations set up private retirement systems, and it has produced research warning about the link between corruption and complicated tax systems.

Perhaps most laudable, the World Bank every year publishes Doing Business, an index that dispassionately measures the degree to which government policy imposes costs on those who create and operate companies. Indeed, it was just two months ago that I wrote about the most recent issue (mostly to grouse that America is falling in the rankings, so thanks Obama).

All of which puts me in a strange position, because although I have written that the World Bank is my “least despised international bureaucracy,” I never thought I would dedicate an entire column to defending its work.

But a friend formerly known as the Princess of the Levant sent me an article by José Antonio Ocampo and Edmund Fitzgerald, which attacks Doing Business for…gasp…encouraging tax competition.

Since I’m a knee-jerk defender of tax competition (and bearing in mind that the enemy of your enemy is sometimes your friend), I feel obliged to jump into the debate and defend the World Bank’s report.

Here’s the basic argument of Ocampo and Fitzgerald.

…there is a serious flaw in the report’s formula: the way it treats corporate taxation. …The problem is that “regulatory burden,” according to Doing Business, includes…promoting budget-straining tax competition among countries… This may sound like an argument for overhauling Doing Business’ “paying taxes” indicator. But what is really needed is for Doing Business to drop that indicator altogether…when it comes to the paying taxes indicator, the report has things all wrong. Indeed, it runs counter to the global consensus on the need for effective international cooperation to ensure equitable collection of tax revenues, including measures to limit tax avoidance by multinationals and other private firms. A race to the bottom in corporate taxation will only hurt poor people and poor countries. If Doing Business is to live up to its own slogan, “equal opportunity for all,” it should abandon the tax indicator altogether.

Wow. I find it remarkable that leftists openly argue in favor of suppressing information on tax policy because of their ideological hostility to tax competition.

For all intents and purposes, they’re admitting that taxes do matter.

The article also makes some other assertions that deserve a bit of attention. Most notably, the authors repeat the silly claim by some leftists that the way to get more growth is with a bigger government financed by higher taxes.

…taxes that are necessary to fund public infrastructure and basic social services – both of which are critical to enhance growth and employment. Even the report recognizes that, for most economies, taxes are the main source of the government revenues needed to fund “projects related to health care, education, public transport, and unemployment benefits, among others.”

Yet if it’s true that big government stimulates growth, why did the world’s richest nations become rich when government was very small and taxes were largely nonexistent?

Ocampo and Fitzgerald somehow want people to believe that if a little bit of government spending is associated with good economic results, then this somehow means a lot of government must be associated with better economic results.

Maybe somebody should introduce them to the concepts of diminishing returns and negative returns. And once they master those concepts, they’ll be ready to learn about the Rahn Curve. Heck, there’s even a World Bank study I can recommend for them.

Though the authors do raise one semi-decent point. Some of the taxes paid by companies actually are borne by workers. Ocampo and Fitzgerald don’t seem to understand how this works since they jumble together some taxes that are borne by labor with other that are borne by capital, but there is a kernel of truth in their argument.

Doing Business exaggerates the tax burden on companies. For one thing, it considers all the kinds of taxes firms might pay – not just corporate income tax. Specifically, the report’s estimates for “total tax rate as a proportion of profits” include taxes for employees’ health insurance and pensions; property and property transfers; dividends, capital gains, and financial transactions; and public services like waste collection and infrastructure. Those are taxes that should be categorized as social contributions or service charges.

Having bent over backwards to say something nice about their article, let’s now close by highlighting the most preposterous assertion in their piece.

They basically reject the entire field of microeconomics and the underlying principles of price theory – not to mention reams of academic evidence – by denying that tax rates have any impact on behavior.

…the assumption underpinning it – that low corporate taxation promotes growth – does not withstand scrutiny. Research conducted by the International Monetary Fund and others indicates that tax competition does not promote productive investment worldwide.

Remarkable. They even think citing the IMF somehow strengthens their case, when that’s actually more akin to citing Dr. Kevorkian.

P.S. Just in case anyone is worried that this pro-Doing Business column means I’m getting soft on the World Bank, rest assured that I will never be a fan of a bureaucracy that equates higher taxes with a good report card. But I’ll always be the first to admit when an international bureaucracy does good work.

Read Full Post »

For data-loving policy wonks, the World Bank’s Doing Business report is a fascinating look at the degree to which nations have a policy and governance environment that is conducive to economic activity.

Unlike Economic Freedom of the World, it’s not designed to measure whether a jurisdiction has small government. Doing Business is probably best described as measuring quality of governance and whether a nation has sensible business policy.

That being said, there’s a lot of overlap between the rankings of the two publications. Indeed, you’ll notice many free-market countries in the top 20 of Doing Business, led by the “unsung success story” of New Zealand, followed by the capitalist haven of Singapore.

The United States is ranked #8, and you’ll notice most of the Nordic nations with very good scores, along with two of the Baltic nations.

Here’s some of the report’s analysis, including the unsurprising observation that countries with market-friendly policies tend to have high incomes (a lesson one wishes Hillary Clinton was capable of absorbing).

OECD high-income economies have on average the most business-friendly regulatory systems, followed by Europe and Central Asia. There is, however, a large variation within those two regions. New Zealand has a ranking of 1 while Greece has a ranking of 61; FYR Macedonia stands at 10 while Tajikistan is at 128. The Sub-Saharan Africa region continues to be home to the economies with the least business-friendly regulations on average.

If you’re wondering where the rest of world’s nations rank, click on the table in the excerpt. One thing that stands out is that Venezuela – finally! – isn’t in last place. Though being 187 out of 190 is not exactly something to brag about.

While it’s good to give favorable attention to the nations with the highest scores, it’s also worthwhile to see which countries are moving in the right direction at the fastest pace.

Ten economies are highlighted this year for making the biggest improvements in their business regulations—Brunei Darussalam, Kazakhstan, Kenya, Belarus, Indonesia, Serbia, Georgia, Pakistan, the United Arab Emirates and Bahrain.

Kudos to Georgia (the one wedged between Turkey and Russia on the Black Sea, not the one that is home to my beloved – but underperforming – Bulldogs). It’s the only country that is both in the overall top 20 and among the 10 nations that delivered the most positive reforms.

Here’s the table from the report showing why these 10 nations enjoyed a lot of improvement.

The report observes that a more sensible regulatory approach is associated with higher levels of prosperity.

A considerable body of evidence confirms that cross-country differences in the quality of business regulation are strongly correlated with differences in income per capita across economies.

But here’s the part that should open a few eyes among our leftist friends.

A more market-friendly regulatory environment also is linked to lower levels of inequality.

There is a negative association between the Gini index, which measures income inequality within an economy, and the distance to frontier score, which measures the quality and efficiency of business regulation when the data are compared over time (figure 1.8). Data across multiple years and economies show that as economies improve business regulation, income inequality tends to decrease in parallel.

As I’ve said many times tomorrow, I don’t care about differences in income. I simply want economic liberty so everybody has a chance to earn more income.

Nonetheless, it’s good have some evidence for statists who fixate on how the pie is sliced. Here’s the relevant chart from the report.

And here’s another chart showing that lots of regulation and red tape in labor markets (inevitably imposed for the ostensible goal of “protecting” workers) is correlated with a bigger underground economy.

Reminds me of the research showing how “labor protection” laws actually hurt workers.

Let’s now turn to the tax component, which predictably the part that grabbed my interest.

The score for this component is based on both the tax burden and the cost of tax compliance.

While the size of the tax cost imposed on businesses has implications for their ability to invest and grow, the efficiency of the tax administration system is also critical for businesses. A low cost of tax compliance and efficient tax-related procedures are advantageous for firms. Overly complicated tax systems are associated with high levels of tax evasion, large informal sectors, more corruption and less investment.

Here’s a table from the report showing some of the good reforms that have happened in various nations.

Sadly, America did not make any improvements in tax policy, so we don’t show up on any of the lists.

But since we’re on that topic, let’s now take a closer look at the United States. As already noted, America is ranked #8, which obviously is a reasonably good score.

But if you look at the various components, you sort of get the same story that we saw with the World Economic Forum’s Global Competitiveness Report, namely that there are some sub-par government policies that are hampering an otherwise very efficient private economy.

I’m particularly displeased that the U.S. scores so poorly (#51) in “starting a business.” And just imagine how much the score will drop if statists succeed in forcing states like Delaware, Wyoming, and Nevada to alter their business-friendly incorporation laws.

And I’m also unhappy that we rank #8 when the United States started at #3 in the World Bank’s inaugural 2006 edition of Doing Business. Thanks Bush! Thanks Obama!

Read Full Post »

I don’t like international bureaucracies because they generally push for policies that expand the burden of government and undermine economic growth.

But I recognize that there are some good people who work at these institutions and I’m always willing to acknowledge when they publish good research.

The IMF said that Greece had reached the tipping point where taxes were too high.

The World Bank put together a report showing how anti-money laundering regulations hurt the poor.

The United Nations acknowledged the Laffer-Curve insight that taxes can be too high.

The OECD admitted that income taxes undermine growth and that tax competition restrains the greed of the political class.

The European Central Bank found excessive government spending undermines economic performance.

We can now add some new research to that list. The World Bank has just published a new study highlighting the link between tax complexity and tax corruption.

You can peruse the entire report if you’re so inclined, but here are the key details from the abstract.

This paper seeks to find empirical evidence of a link between tax simplification and corruption in tax administration. …The study includes 104 countries from different income groups and regions of the world. The time period is 2002–12. The empirical findings support the existence of a significant link between the measure of tax corruption and tax simplicity, so a less complex tax system is shown to be associated with lower corruption in tax administration. It is predicted that the combined effect of a 10 percent reduction in both the number of payments and the time to comply with tax requirements can lower tax corruption by 9.64 percent….The positive link between tax simplicity and lower tax corruption has useful policy implications.

There are a few caveats. While people have a greater incentive to rig the system when tax rates are high, the report only addresses this issue tangentially. This is a very unfortunate oversight.

Also, the data show that corruption is higher in developing nations, which is not terribly surprising. Though I think this might be unfair because corruption is narrowly defined so that it’s simply a measure of lawbreaking.

I suspect there are similar amounts of corruption in developed nations, but it takes the form of influence peddling and legislative favors. That’s definitely the mother’s milk of Washington’s sleazy insiders.

And if you look at this chart, this chart, or this chart, there’s no doubt that the internal revenue code is riddled with loopholes.

This video elaborates on the connection between bloated government and legal corruption.

And this video shows how our corrupt tax code could be fixed.

P.S. Just so you don’t think I’m getting soft-hearted about the World Bank, just remember that this is the bureaucracy that put together a tax “report card” that gave nations higher grades for having more punitive fiscal policy.

P.P.S. In the interests of fairness, I am a fan of the World Bank’s Doing Business Index.

P.P.P.S. I’ve written several times about overpaid bureaucrats and fat-cat lobbyists.

Well, here’s a look at per capita personal income in Washington, DC, compared to the rest of America.

You’ll notice that Washington got substantially richer during both Bush Administrations.

But it’s not just the District of Columbia. If you click on this map, you’ll see that a majority of America’s richest communities are the suburbs of Washington.

A lot of fat and happy people living directly or indirectly off your tax dollars.

Read Full Post »

Remember when you were a kid and your parents would either be happy or angry depending on whether your report card said you were trying hard or being a slacker? No matter whether your grades were good or bad, it helped to get an “A for Effort.”

But sometimes a high level of effort isn’t a good thing.

The World Bank has a new study that measures national tax burdens. But instead of using conventional measures, such as top tax rates or tax collections as a share of GDP, the international bureaucracy has developed an index that measures “tax effort” and “tax capacity” after adjusting for variables such as per-capita GDP, corruption, and demographics.

One goal of the study is to develop an apples-to-apples way of comparing tax burdens for nations at various levels of development. Poor nations, for instance, tend to have low levels of tax revenue even though they often have high tax rates. This is partly because of Laffer Curve reasons, but perhaps even more so because of corruption and incompetence. Rich nations, by contrast, usually have much greater ability to enforce their tax codes. So if you want to compare the tax system of Paraguay with the tax system of Sweden, you need to take these factors into account.

Here’s a description of how the authors addressed this issue.

Measuring taxation performance of countries is both theoretically and practically challenging. …tax economists have attempted to deal with this problem by applying an empirical approach to estimate the determinants of tax collection and identify the impact of such variables on each country’s taxable capacity. The development of a tax effort index, relating the actual tax revenues of a country to its estimated taxable capacity, provides us with a tempting measure which considers country specific fiscal, demographic, and institutional characteristics. …Tax effort is defined as an index of the ratio between the share of the actual tax collection in GDP and the taxable capacity.

This is a worthwhile project. There sometimes are big differences between nations and those should be part of the equation when comparing tax policies. Indeed, this is why my recent post on the rising burden of the value-added tax looked at data for nations at different levels of development.

But I’m irked by the World Bank study because it’s really measuring “tax onerousness.” I’m not even sure onerousness is a word, but I sure don’t like the term “tax effort” because it implies that a higher tax burden is a good thing. After all, we learned from our report cards that it’s good to demonstrate high effort and not be a slacker.

And just so you know I’m not just imagining things, the authors explicitly embrace the notion that bigger tax burdens are desirable. They assert (without any evidence, of course) that higher levels of tax promote “development” and that more money for politicians is “desirable.”

The international development community is increasingly recognizing the centrality of effective taxation to development. …higher tax revenues are important to lower the aid dependency in low-income countries. They also encourage good governance, strengthen state building and promote government accountability. …many developing countries experience a chronic gap between the actual and desirable levels of tax revenues. Taxation reforms are needed to close this gap.

If the authors of the study looked at economic history, they would understand that they have things backwards. “Effective taxation” doesn’t lead to “development.” It’s the other way around. The western world became rich when the burden of government was very small and most nations didn’t even have income tax regimes. It was only after nations because prosperous that politicians figured out how to extract significant shares of economic output.

But let’s set that aside and see which nations have the most and least onerous tax systems. Here’s a table from the report and it seems that Papua New Guinea has the world’s worst tax system and Bahrain has the best tax system. Among developed nations, New Zealand is the worst and Japan is the best. The United States (circled in red) gets a decent score. We’re not nearly as good as Switzerland and we’re slightly worse than Canada, but our politicians expend less “effort” than their counterparts in nations such as France, Italy, and Belgium.

By the way, I’m not endorsing either the methodology or the results. I like what the authors are trying to do (at least in terms of creating an apples-to-apples measure), but some of the results seem at odds with reality. New Zealand’s tax system isn’t great, but it certainly doesn’t seem as bad as the French tax code. And I have a hard time believing that Japan’s tax code is less onerous than the Swiss system.

The World Bank study also breaks down the data so that countries can be put into a matrix based on how much money they collect and how much “effort” they expend.

Here’s where the authors let their bias show. In their descriptions of the various boxes, they reflexively assume that higher tax collections are a good thing. Here is some of what they wrote in that section of the study.

The collection of taxes in this group of countries is currently low and lies below their respective taxable capacity. These countries have potential to succeed in deepening comprehensive tax policy and administration reforms focusing on revenue enhancement. …Botswana and Chile were originally in the low-effort, low-collection group, but they made it to the high-effort, high-collection group after recent improvements in revenue performance. …Although countries in this [high collection, low effort] group have already achieved a high tax collection, fiscally they still have the potential to implement reforms to reduce distortions and reach a higher level of efficiency of tax collection, since their tax effort index is low.

Very Orwellian, wouldn’t you say? We’re supposed to conclude that it’s bad if nations are “below their respective taxable capacity” because they can “succeed in deepening comprehensive tax policy” for purposes of “revenue enhancement.” Other nations, though, got gold stars because of “improvements in revenue performance.” And others were encouraged to try harder, even if they already collected a lot of revenue, in order to “reach of a higher level of efficiency of tax collection.”

But, to be fair, the study does include some semi-sensible comments acknowledging that there are limits to the greed of the political class. For all intents and purposes, the authors warn that there will be Laffer Curve effects if “high effort” nations seek to make their tax systems even more onerous.

Given that the level of tax intake in this group of countries is already high and stays above their respective taxable capacity, a further increase in tax revenue collection may lead to unintended economic distortions. …low-income countries with a low level of tax collection but high tax effort have less opportunity to increase tax revenues without possibly creating distortions or high compliance costs.

Just in case you’re not familiar with the lingo, “distortion” refers to the economic damage caused by high tax rates. This can be because high tax rates lead to a reduction in work, saving, investment, entrepreneurship, and other productive behaviors. Or it can be because high tax rates encourage people to make economically inefficient choices solely for tax planning purposes.

So the fact that the World Bank recognizes that taxes can hurt economic performance in at least some circumstances puts them ahead of the Congressional Budget Office and Joint Committee on Taxation. That’s damning with faint praise, to be sure, but I wanted to close on an upbeat note.

P.S. If you peruse the matrix, you’ll notice that New Zealand is considered a developing country. I’m sure that will be the source of amusement to my friends in Australia.

Read Full Post »

I have a love-hate attitude toward international bureaucracies.

I’m mostly negative about organizations such as the IMF, World Bank, UN, and OECD. In part this is because they are a very expensive burden on taxpayers, but also because they generally push for bad policy.

It’s reprehensible, for instance, that the OECD has allied itself with the Obama Administration to push for class-warfare tax policy. And it’s disgusting that these pampered bureaucrats at the IMF get tax-free salaries while pushing for bailouts and higher taxes.

But I confess that the international bureaucracies sometimes generate good data and produce interesting studies. The World Bank, for instance, showed how the welfare state and excessive government spending are reducing prosperity in Europe. And the European Central Bank also has produced solid research showing that large public sectors undermine economic growth.

One very good source of data from an international bureaucracy is the Doing Business Index, published each year by the World Bank. As you can see from the image (click to enlarge), the United States does relatively well in this ranking.

Since the United States has dropped in the Economic Freedom of the World Index and the World Economic Forum’s Global Competitiveness Report, it’s nice to see that the news isn’t all bad in the international rankings.

The one area where the U.S. gets a very poor score, though, is in the “paying taxes” category. This is yet another reason why we should junk the corrupt internal revenue code and replace it with a simple and fair flat tax.

Hong Kong and Singapore are at the top of the rankings, unsurprisingly. The Nordic nations also do well, which fits with the analysis showing they are very free market in areas other than fiscal policy. And it’s always good to see Estonia with a relatively high score.

Read Full Post »

Even though there is a wealth of evidence for the Laffer Curve, statists and other big-government advocates routinely claim that incentives don’t matter.

So I wonder how they’ll react to this new research showing that incentives have an impact on sexual choices. Here are some blurbs from The Economist.

…if you are a poor African teenager, having a sugar daddy is not such a bad deal. Eventually, Mr Right may come along and in the meantime life is, as the term suggests, a lot sweeter than it might otherwise be. Except for one thing. In many parts of Africa, relationships between older men and younger women are one of the main transmitters of HIV. With that in mind, it has often been hypothesised that if teenage girls were given an alternative income—one that might, for instance, allow them to stay on at school—they would be less likely to get infected. It is a plausible hypothesis but one that has not, until now, actually been tested. That lack has just been remedied by Berk Özler, of the World Bank, and his colleagues. In a paper just published by the Lancet, they describe how they conducted a randomised clinical trial of the idea that money, and money alone, can stop the spread of HIV. …In some they and their parents were given small amounts of money each month (between $1 and $5 for the women, and between $4 and $10 for the parents), again decided at random by the computer. In a third set of areas money was doled out in a similar way, but only in exchange for a promise by the woman to attend school. If she failed to do so, no money was forthcoming. …the team found that the unpaid women had suffered more than twice the HIV infection rate experienced by the paid women over the course of the 18 months of the experiment, and four times the infection rate of genital herpes. Intriguingly, there was no difference between the infection rate suffered by those required to go to school and those who received the money unconditionally. …What is abundantly clear, however, was that the money did make women behave differently. They had younger boyfriends than those in the control group, and had sex less frequently. Liberated from the need to find a sugar daddy, they could behave in a safer way. Those attempting to stop the spread of AIDS have, in the past, tried many ways of getting people to change their behaviour in order to reduce the risk of infection. They have extolled, exhorted and even threatened, all to little avail. They have not, though, previously, resorted to bribery. But it seems to work.

Upon reading this, I had several reactions.

  • I first thought being a sugar daddy would be a nice gig, but then I realized that I don’t have nearly enough sugar in my bank account. Life obviously isn’t fair.
  • I then thought that I’m not a fan of the World Bank, but I must admit that this seems to be a reasonably good way for them to spend money.
  • I also wondered why nobody is arresting, harassing, or otherwise going after these SOBs that are infecting the young girls. If I was the father of one of these girls, it definitely would be time for some vigilante justice.
  • Finally, being a policy geek, I wondered whether this powerful example of incentives might get some leftists to draw some obvious conclusions about the need for better tax policy.

But then I came to my senses. It seems that many of the statists I debate and deal with support punitive taxation for reasons of spite and envy. As such, they don’t really care about the impact on either the economy or tax revenues.

And if you’re wondering why they would come to such a crazy conclusion, watch this video – especially beginning about the 4:30 mark.

It’s enough to make you wonder whether they realize that this strategy is self defeating. Heck, even a former socialist President of Brazil noted that there’s nothing to redistribute if some people don’t first produce.

Read Full Post »

When Ronald Reagan said that big government undermined the economy, some people dismissed his comments because of his philosophical belief in liberty.

And when I discuss my work on the economic impact of government spending, I often get the same reaction.

This is why it’s important that a growing number of establishment outfits are slowly but surely coming around to the same point of view.

This is remarkable. It’s beginning to look like the entire world has figured out that there’s an inverse relationship between big government and economic performance.

That’s an exaggeration, of course. There are still holdouts pushing for more statism in Pyongyang, Paris, Havana, and parts of Washington, DC.

But maybe they’ll be convinced by new research from the World Bank, which just produced a major report on the outlook for Europe. In chapter 7, the authors explain some of the ways that big government can undermine prosperity.

There are good reasons to suspect that big government is bad for growth. Taxation is perhaps the most obvious (Bergh and Henrekson 2010). Governments have to tax the private sector in order to spend, but taxes distort the allocation of resources in the economy. Producers and consumers change their behavior to reduce their tax payments. Hence certain activities that would have taken place without taxes, do not. Workers may work fewer hours, moderate their career plans, or show less interest in acquiring new skills. Enterprises may scale down production, reduce investments, or turn down opportunities to innovate. …Over time, big governments can also create sclerotic bureaucracies that crowd out private sector employment and lead to a dependency on public transfers and public wages. The larger the group of people reliant on public wages or benefits, the stronger the political demand for public programs and the higher the excess burden of taxes. Slowing the economy, such a trend could increase the share of the population relying on government transfers, leading to a vicious cycle (Alesina and Wacziarg 1998). Large public administrations can also give rise to organized interest groups keener on exploiting their powers for their own benefit rather than facilitating a prosperous private sector (Olson 1982).

In other words, government spending undermines growth, and the damage is magnified by poorly designed tax policies.

The authors then put forth a theoretical hypothesis.

…economic models argue that the excess burden of tax increases disproportionately with the tax rate—in fact, roughly proportional to its tax rate squared (Auerbach 1985). Likewise, the scope for self-interested bureaucracies becomes larger as the government channels more resources. At the same time, the core functions of government, such as enforcing property rights, rule of law and economic openness, can be accomplished by small governments. All this suggests that as government gets bigger, it becomes more likely that the negative impact of government might dominate its positive impact. Ultimately, this issue has to be settled empirically. So what do the data say?

These are important insights, showing that class-warfare tax increases are especially destructive and that government spending undermines growth unless the public sector is limited to core functions.

Then the authors report their results.

Figure 7.9 groups annual observations in four categories according to the share of government spending in GDP during that year. Both samples show a negative relationship between government size and growth, though the reduction in growth as government becomes bigger is far more pronounced in Europe, particularly when government size exceeds 40 percent of GDP. …we provide new econometric evidence on the impact of government size on growth using a panel of advanced and emerging economies since 1995. As estimates can be biased due to problems of omitted variables, endogeneity, or measurement errors, it is necessary to rely on a broad range of estimators. …They suggest that a 10 percentage point increase in initial government spending as a share of GDP in Europe is associated with a reduction in annual real per capita GDP growth of around 0.6–0.9 percentage points a year (table A7.2). The estimates are roughly in line with those from panel regressions on advanced economies in the EU15 and OECD countries for periods from 1960 or 1970 to 1995 or 2005 (Bergh and Henrekson 2010 and 2011).

These results aren’t good news for Europe, but they also are a warning sign for the United States. The burden of government spending has jumped by about 8-percentage points of GDP since Bill Clinton left office, so this could be the explanation for why growth in America is so sluggish.

Last but not least, they report that social welfare spending does the most damage.

Governments are big in Europe mainly due to high social transfers, and big governments are a drag on growth. The question is whether this is because of high social transfers? The answer seems to be that it is. The regression results for Europe, using the same approach as outlined earlier, show a consistently negative effect of social transfers on growth, even though the coefficients vary in size and significance (table A7.4). The result is confirmed through BACE regressions. High social transfers might well be the negative link from government size to growth in Europe.

The last point in this passage needs to be emphasized. It is redistribution spending that does the greatest damage. In other words, it’s almost as if Obama (and his counterparts in places such as France and Greece) are trying to do the greatest possible damage to the economy.

In reality, of course, these politicians are simply trying to buy votes. But they need to understand that this shallow behavior imposes very high costs in terms of foregone growth.

To elaborate, this video discusses the Rahn Curve, which augments the data in the World Bank study.

As I argue in the video, even though most of the research shows that economic growth is maximized when government spending is about 20 percent of GDP, I think the real answer is that prosperity is maximized when the public sector consumes less than 10 percent of GDP.

But since government in the United States is now consuming more than 40 percent of GDP (about as much as Spain!), the first priority is to figure out some way of moving back in the right direction by restraining government so it grows slower than the private sector.

Read Full Post »

Welcome Instapundit readers. Thanks Glenn! And speaking of international bureaucracies, readers may want to read this post about the Greek bailout.

=============================================================================

Regular readers know that I’m not a big fan of the international bureaucracies. I don’t like the International Monetary Fund because it encourages bad policy by bailing out nations such as Greece. I don’t like the Organization for Economic Cooperation and Development because it promotes bigger government with its anti-tax competition campaign. And I don’t like the United Nations because it is a wasteful and corrupt bureaucracy, though at least it is ineffective so we don’t have to worry too much about the bad ideas it generates (such as global taxes – see here, here, and here).

If I had to pick my “least despised” international bureaucracy, it would be the World Bank. Yes, it engages in lots of counterproductive income transfers, and yes, it has a long track record of wasting money with foreign aid boondoggles. But unlike other international bureaucracies, at least the World Bank doesn’t try to act like some sort of global economic policymaker.

Moreover, it occasionally is a force for good. The World Bank for years has been actively involved in helping nations develop and implement private Social Security systems. And the bureaucracy’s “Doing Business Index” and “Governance Indicators” help promote market-friendly reforms by publicizing which nations have bloated and inefficient public sectors.

And since I’m feeling temporarily warm and fuzzy about the World Bank, I should acknowledge that their researchers sometimes produce good research. I’m particularly impressed by a new study showing that economic freedom is the key to prosperity. The abstract of the paper summarizes the results.

Reviewing the economic performance—good and bad—of more than 100 countries over the past 30 years, this paper finds new empirical evidence supporting the idea that economic freedom and civil and political liberties are the root causes of why some countries achieve and sustain better economic outcomes. For instance, a one unit change in the initial level of economic freedom between two countries (on a scale of 1 to 10) is associated with an almost 1 percentage point differential in their average long-run economic growth rates. In the case of civil and political liberties, the long-term effect is also positive and significant with a differential of 0.3 percentage point. In addition to the initial conditions, the expansion of freedom conditions over time (economic, civil, and political) also positively influences long-run economic growth. In contrast, no evidence was found that the initial level of entitlement rights or their change over time had any significant effects on long-term per capita income, except for a negative effect in some specifications of the model. These results tend to support earlier findings that beyond core functions of government responsibility—including the protection of liberty itself—the expansion of the state to provide for various entitlements, including so-called economic, social, and cultural rights, may not make people richer in the long run and may even make them poorer.

Let’s apply these finding to the United States. Under Bush and Obama, the United States has suffered an expansion in the burden of government and a loss of economic freedom. This means our economy will grow at a slower rate, our incomes will not climb as fast, and our future will be less prosperous. There are real consequences to bad policy.

Read Full Post »

I’ve remarked before about how I get especially upset when well-to-do people figure out ways of ripping off taxpayers. Redistribution from rich to poor is not a good idea, but it is far more offensive when the coercive power of government is used to transfer money from ordinary people to the elite.

A good (perhaps “reprehensible” would be a better word to use) example if the scam created by international bureaucracies. The folks who work for entities such as the International Monetary Fund, World Bank, United Nations, and Organization for Economic Cooperation get wildly excessive compensation packages. To add insult to injury, their income is tax free!

Here are some excerpts from a Richard Pollack column at Pajamas Media.

At the World Bank, Inter-American Development Bank, the African Development Bank, and at the IMF, you find extravagantly paid men and women who masquerade as anti-poverty fighters for the Third World. As one World Bank vice president said upon his resignation: “Poverty reduction is the last thing on most World Bank bureaucrats’ minds.” These global institutions are supposed to act as non-profits, but big salaries and big perks rule as the norm. And you’re paying for them: as the largest single contributor, American taxpayers pick up the tab. By now everyone knows about DSK’s extravagant $420,000 employment agreement that included an additional $73,000 for living expenses — a provision explained thusly by the IMF: “To enable you to maintain … a scale of living appropriate to your position.” …A PJM survey found that a common annual compensation package for senior management at the anti-poverty banks exceeds $500,000 — tax-free. World Bank President Robert Zoellick currently receives $441,980 in base salary and $284,500 in other benefits. Strauss-Kahn’s deputy, John Lipsky, receives $384,000 in base salary plus “living allowances.” …Ten of Zoellick’s deputies receive tax-free base pay of $321,00 to $347,000, plus enjoy an additional $210,000 in benefits. Even mid-level World Bank employees earn well into six digits: the average salary for a professional manager is $181,000, plus $97,000 in benefits. A senior adviser receives on average $238,000 plus $127,000 in benefits. A vice president receives $286,000 plus $153,000 in benefits. The biggest hidden benefits are the off-the-book perks called “living allowances.” These perks can nearly double a stated salary. Of the 2,600 IMF and 10,000 World Bank full-time employees, all receive some form of supplemental living allowances in addition to their base pay. These include home leave grants, dependent allowances, travel perks, and education “grants” for their children to attend private schools. In addition, they offer generous pensions and health insurance policies. According to a U.S. General Accounting Office study, the average cost for these additional perks added $197,300 per employee cost beyond their base pay in 1994 dollars.

The column doesn’t mention my “favorite” international bureaucracy, which is the Paris-based Organization for Economic Cooperation and Development. The OECD’s budget is small compared to some of the other parasitic bodies mentioned in the column, but this video explains how big-government policies are being financed with the $100 million-plus of American tax dollars sent to France to subsidize the OECD.

Read Full Post »