Feeds:
Posts
Comments

Posts Tagged ‘Rahn Curve’

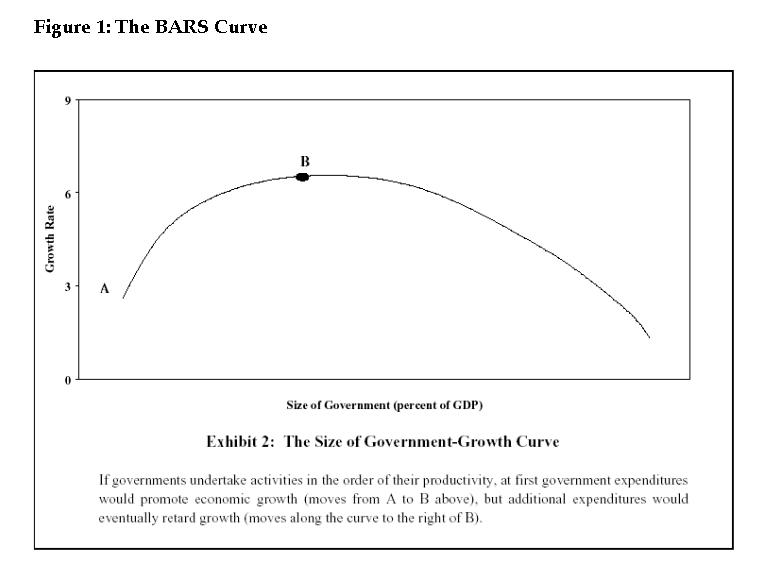
At the end of last month, I wrote about the growth-maximizing size of government, citing a study that estimated that the public sector in Sudan should not consume more than 11.17 percent of the nation’s economic output.

I realize that very few people care about Sudanese fiscal policy, but the research gave me an opportunity to condemn the OECD, IMF, and UN for peddling the nonsensical argument that more government spending would promote faster growth in poor nations.

Today, I want to cite another study, in this case about the growth-maximizing size of government in India. But, once again, I’m citing some research to make a bigger point.

First, here are the findings from the study, written by Neha Jain and Niharika Sinha.

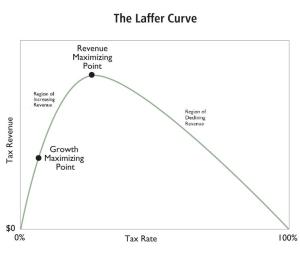
The present study aims to examine the relationship between government size and economic growth in India for the period from 1961 to 2018. Additionally, as a novel contribution, the current study also attempts to examine the existence of Armey curve and estimate the threshold level of government size in India. …The result of the study confirms…the existence of Armey curve and supports the Armey curve hypothesis in India. There exists a positive impact of government size till the threshold level, and beyond the threshold level, the coefficient of economic growth tends to decrease. The estimated optimal government size is 11.89% for India…the findings of the study also suggest that a large size of the government can be harmful for the efficiency of economic growth; thus, adjusting the government at its optimum is crucial to the economy.

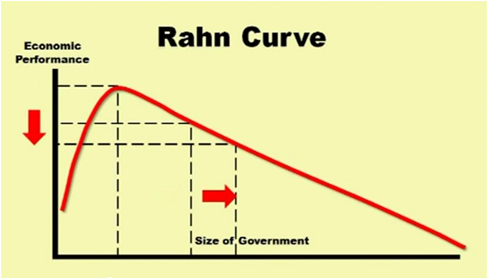
By the way, the Armey Curve is the Rahn Cure and the Rahn Curve is the Armey Curve (there’s ongoing discussion of who was the first to visually depict the upside-down-U-shaped relationship between the size of government and economic performance).

But let’s set aside that discussion. Regardless of who deserves credit, it’s vitally important that policymakers understand that excessive government spending is very harmful for prosperity.

That’s true in India, and that’s true in the United States (especially since government is too big right now and is expected to become a bigger burden in the future).

But while it’s good to have a discussion on the quantity of government spending, let’s not forget that the quality of government spending also matters.

To be more precise, some types of government spending can be helpful to growth and other types of spending are usually harmful to growth.

  • Rule-of-law spending – If done effectively, spending for pure public goods such as administration of justice and enforcement of contracts can create a favorable environment for more growth.
  • Physical capital spending – The growth impact (or anti-growth impact) depends on whether money for ports, roads, etc, is spent efficiently, thus offsetting the cost of diverting resources from the economy’s productive sector.
  • Human capital spending – The growth impact (or anti-growth impact) depends on whether money for education, training, etc, is spent efficiently, thus offsetting the cost of diverting resources from the economy’s productive sector.
  • Defense/military spending – May be necessary for national survival, but otherwise bad for growth since labor and capital are diverted from the economy’s productive sector to government.
  • Social welfare spending – May be compassionate (or dependency inducing), but otherwise bad for growth since labor and capital are diverted from the productive sector to government.

The purpose of today’s column is to conceptually explain how different types of government spending may or many not affect economic performance, but I can’t resist noting that the United States does a terrible job of spending money on human capital and physical capital.

And I can’t resist observing that the vast majority of America’s federal budget is for social welfare spending.

P.S. Developing nations do a bad job of providing rule of law, but I have near-zero faith that more government spending will lead to improvements. Instead, more spending will be a vehicle for ruling elites to cement their power by buying votes.

Read Full Post »

Most people have heard of the Laffer Curve, which shows that there is a non-linear relationship between tax rates and tax revenues (for instance, doubling tax rates won’t produce a doubling of tax revenue because people and businesses will have less incentive to earn and report income).

There’s something similar on the spending side of the budget. I call it the Rahn Curve and it shows there is a non-linear relationship between government spending and economic performance.

The concept is not controversial, just like the concept of a Laffer Curve is not controversial.

What does trigger disagreement, however, is figuring out the shape of the curve, especially the growth-maximizing size of government (or, in the case of the Laffer Curve, the revenue-maximizing tax rate).

Much of the academic literature suggests that is maximized when government spending consumes about 20-plus percent of economic output.

But I’ve questioned whether these studies are correct, based on data limitations that are inherent when doing research based on post-WWII numbers.

Those numbers tell us interesting things (the East Asian tiger economies have been star performers and have relatively small spending burdens), but does that mean government should consume 20 percent of GDP when we know from history that Western nations grew rapidly in the 1800s and early 1900s when there was no welfare state and the public sector consumed only about 10 percent of economic output?

Given my interest in these issues, I was intrigued to see a new study on the Social Science Research Network. Authored by Hisham Mohamed Hassan of the University of Khartoum, it estimates the growth-maximizing size of government in Sudan.

The bad news is that the study is in Arabic. The good news is that there is an abstract in English. Here are some of the findings.

Policies related to the level of government spending are considered one of the most important economic issues, and aspects that drew particular attention of its impact on economic growth. This paper aims to determine the size of the government of Sudan, which is reflecting positively on the optimal allocation of the resources and the level of public spending that maximizes economic growth. In addition to testing whether there is a long-run relationship between the size of the government and economic growth in Sudan? The findings show that the relationship between government size and economic growth in Sudan is nonlinear (Armey) curve, the ARDL model shows that there is a short and long-run relationship between the size of the government and economic growth in Sudan. The optimal size of the Sudanese government, based on the share of public spending, should not exceed 11.17% of GDP.

Since I can’t read the full study, there’s no way of assessing the quality of the research and/or if the conclusions are only appropriate for Sudan, or also appropriate for other developing nations, or universally applicable to all countries.

But even if the results are not applicable to rich countries, the conclusions are very useful since they debunk the absurd notion (peddled by the IMF, OECD, and UN) that developing nations should have bigger governments.

P.S. For those interested, here’s my video explaining the Rahn Curve (or Armey Curve if you prefer).

P.P.S. You can watch other videos on this topic by clicking here, here, here, and here).

P.P.P.S. Interestingly, some normally left-leaning international bureaucracies have acknowledged you get more prosperity with smaller government. Check out the analysis from the IMFECBWorld Bank, and OECD.

Read Full Post »

Echoing remarks earlier this month to a group in Nigeria, I spoke today about fiscal economics to the 2022 Africa Liberty Camp in Entebbe, Uganda.

During the Q&A session, I was asked to specify the ideal amount of government spending. I addressed that issue in an April interview while visiting Spain.

You’ll notice that I didn’t give a specific number in the above video. Just like I didn’t give a specific number to the audience in Uganda.

That’s because there is not an exact answer. The only thing we can definitively state is that government in most nations should be far smaller than it is today.

This is illustrated by the “Rahn Curve,” which I discussed both in the interview and in my speech today.

What is the Rahn Curve? Here’s some of what I wrote back in 2015.

…it shows the non-linear relationship between the size of government and economic performance. Simply stated, some government spending presumably enables growth by creating the conditions (such as rule of law and property rights) for commerce. But as politicians learn to buy votes and enhance their power by engaging in redistribution, then government spending is associated with weaker economic performance because of perverse incentives and widespread misallocation of resources.

And here’s a visual depiction of the Rahn Curve. The upward-sloping part of the curve shows that spending on genuine public goods is associated with more prosperity. But once government budgets exceed a certain level, additional spending means weaker economic performance.

In the above graph, I show that growth is maximized when government consumes about 15 percent-20 percent of economic output.

But I actually think prosperity would be maximized if government was a smaller burden, perhaps about 5 percent-10 percent of GDP.

In 2017, I explained the appropriate role of government in a libertarian society. My analysis was based on my “minarchist” views, which imply government only spends money for national defense and rule of law.

By contrast, my anarcho-capitalist friends would say we don’t need any government.

Meanwhile, moderate libertarians (or conservative Republicans) might be amenable to having state and local governments play a role in education and infrastructure.

The bottom line is that I think growth would be maximized if government consumes – at most – 10 percent of economic output (which was the size of government in the 1800s when the Western world became rich).

But I will be happy with any progress (particularly since government is projected to become an even bigger burden if left on autopilot).

If you want to watch more videos related to the Rahn curve, there are many options.

P.S. Here’s my response to a critic from the left.

P.P.S. Interestingly, some normally left-leaning international bureaucracies have acknowledged you get more prosperity with smaller government. Check out the analysis from the IMF, ECB, World Bank, and OECD.

Read Full Post »

The International Monetary Fund is infamous for its advocacy of higher taxes.

Heck, it’s not merely advocacy. The international bureaucracy uses bailout money as a tool to coerce politicians into approving higher tax burdens.

This is so reprehensible that I’ve referred to the IMF as the “Dumpster Fire of the Global Economy” and called it the “Doctor Kevorkian of Global Economic Policy.”

The bureaucrats also are quite inventive when it comes to rationalizing tax increases.

For instance, a new report from the IMF suggests that a minimum tax level is critical for achieving rapid growth and development.

Is there a minimum tax to GDP ratio associated with a significant acceleration in the process of growth and development? We give an empirical answer to this question by investigating the existence of a tipping point in tax-to-GDP levels. We use two separate databases: a novel contemporary database covering 139 countries from 1965 to 2011 and a historical database for 30 advanced economies from1800 to 1980. We find that the answer to the question is yes. Estimated tipping points are similar at about 12¾ percent of GDP. For the contemporary dataset we find that a country just above the threshold will have GDP per capita 7.5 percent larger, after10 years. The effect is tightly estimated and economically large.

Here’s a depiction of the IMF’s perspective.

At some level, there is a correlation between prosperity and taxation. For instance, some poor nations in the developing world are so corrupt and incompetent that they are incapable of collecting much tax revenue.

But that doesn’t mean higher taxes would somehow make those nations richer. After all, correlation does not imply causation (i.e., crowing roosters don’t cause the sun to rise).

Professor Bryan Caplan of George Mason University points out the methodological shortcomings is the “state capacity” theory.

In recent years, many social scientists…have fallen in love with the concept of “state capacity.” …To my mind, this is scarcely better than saying, “Good government is good; bad government is bad.” Matters would be different, admittedly, if the state capacity literature showed that good government is the crucial ingredient required for success.  But researchers rarely even try to show this.  Instead, they look at various societies and say, “Look at how well-run the governments in successful countries are – and look at how poorly-run the governments in unsuccessful countries are.”  The casual causal insinuation is palpable. …why not just ditch your premature focus on “state capacity” in favor of an open-minded exploration of social capacity?  Good government might be the crucial ingredient for success.  But maybe good government is a byproduct of wealth, trust, intelligence, freedom, or some cocktail thereof. …While good social outcomes all tend to go together, the state capacity literature fails to show that government is the crucial factor that makes all the others possible.

Two other scholars from George Mason University, Professor Peter Boettke and Rosolino Candela, address the issue in an academic study.

This paper reconceptualizes and unbundles the relationship between public predation, state capacity and economic development. …we argue that to the extent that a causal relationship exists between state capacity and economic development, the relationship is proximate rather than fundamental. State capacity emerges from an institutional context in which the state is constrained from preying on its citizenry in violation of predefined rules limiting its discretion. When political constraints are not established to limit political discretion, then state capacity will degenerate from a means of delivering economic development to a means of predation.

They cite Mancur Olson’s work on “political bandits” to understand the limited conditions that would be necessary for there to be a causal relationship between taxes and growth.

Olson’s famous distinction between a “stationary bandit” and a “roving bandit” provides an illustration of our point regarding the emphasis placed on initial conditions. Olson provides a powerful argument for understanding how the self-interest of a revenue-maximizing ruler will align with the political conditions necessary for wealth maximization, not only for himself, but also for his subjects. In a world of roving banditry, a political ruler will have little incentive to invest in fiscal technologies required for regular taxation and judicial technologies that secure property rights and enforce contracts. Only when a bandit has settled down will he or she be incentivized to invest in the provision of public goods that encourage individuals to accumulate wealth, rather than concealing it from predators. However, by Olson’s own admission, his stationary bandit argument is a necessary, though not a sufficient condition for taming public predation.

Their conclusion is that constitutional constants on government are needed to ensure taxes aren’t a tool for additional predation.

In unbundling the relationship between state capacity and economic development, we have distinguished between the protective state, the productive state and the predatory state. To the extent that expansions in state capacity are consistent with economic development, this is because a credible commitment to a set of rules that constrain political discretion have been established. …Fundamentally, economic development requires a protective state from which state capacity emerges as a byproduct. If, however, political constraints are not established to limit political discretion, then state capacity will degenerate from a means of delivering economic development to a means of predation.

Professor Mark Koyama of George Mason University also has written wisely on this topic.

I’m not an academic, so I have a much simpler way of thinking about this issue.

When the IMF (and other bureaucracies) assert that higher taxes are good for growth, I explain that it’s all based on fairy dust or magic beans.

P.S. In a perverse way, I admire the IMF. The bureaucracy’s rationale for existence (dealing with fixed exchange rates) disappeared decades ago, yet the IMF managed to reinvent itself and is now bigger and more bloated than ever.

P.P.S. You won’t be surprised to learn that IMF bureaucrats receive tax-free salaries while pushing for higher taxes on everyone else.

Read Full Post »

I gave a couple of speeches about fiscal policy in Australia late last week.

During the Q&A sessions (as so often happens when I speak overseas), the audiences mostly asked questions about Donald Trump. I generally give a three-part response.

So when I was asked to appear on Australian television, you won’t be surprised to learn that I was asked several questions about Trump.

But the good news is that the segment lasted for more than 18 minutes so I got a chance to pontificate about taxes and spending.

In particular, I had an opportunity to explain two very important principles of fiscal policy.

First, I explained the Rahn Curve and discussed why both Australia and the United States should worry that the public sector is too large. This means less growth in our respective nations because government spending (whether financed by taxes or borrowing) diverts resources from the productive sector of the economy.

Second, I explained the Laffer Curve and tried to get across why high tax rates are a bad idea (even if they raise more revenue). As always, my top goal was to explain that a nation should not seek to be at the revenue-maximizing point.

I also had an opportunity to take some potshots at international bureaucracies such as the IMF and OECD. Yes, we get good statistics from such organizations and even some occasional good research, but they have a statist policy agenda that undermines global growth. And I never cease to be offended that bureaucrats at these organizations get tax-free salaries, yet get to jet around the world urging higher taxes on the rest of us.

Read Full Post »

It’s not that much fun to be a libertarian, at least if you work in public policy.

You spend your days hoping that “Public Choice” can be overcome, which means you’re laboring to fulfill Sisyphean tasks.

  • Trying to convince politicians and bureaucrats to voluntary give up power and control over the economy. Good luck with that.
  • Trying to convince voters that it’s not right use government coercion to steal other people’s money. An increasingly hard task.

Needless to say, these are not easy tasks, which is why most of my time is spent playing defense. In other words, I’m trying to prevent government from getting even bigger.

But what if there was an opportunity to wipe the slate clean and start all over? Imagine a libertarian fantasy world, where proponents of freedom decide the proper size and scope of government?

Well, that fantasy world exists, sort of. It’s called Liberland, an island in the Danube River that isn’t claimed by either Serbia or Croatia. So a group of libertarians, led by Vít Jedlička, claimed the island and announced the creation of the Free Republic of Liberland.

That’s the good news. The bad news is that neither Serbia nor Croatia recognize Vit’s claim. Indeed, Croatian police arrest people who set foot on the island, which is rather strange since Croatia says the island isn’t Croatian territory (Wikipedia has the details on Liberland’s status).

Notwithstanding these obstacles, the Liberland community is relentlessly hopeful of a good outcome. Indeed, they just held a conference to mark Liberland’s second anniversary.

And I was asked to speak about the ideal fiscal policy for this new country. Here’s my speech, which begins with a discussion of government as a “stationary bandit” and then explores some of the theoretical issues of setting up a freedom-oriented society.

Yes, I realize I’m talking about the theoretical nature of a theoretical state, but I very much enjoyed this opportunity to engage in a Walter Mitty-style dream about how Liberland might operate.

And I even had Liberland’s president as an assistant for my talk.

After spending the first part of my speech contemplating the theoretical nature of a Liberland government (or private governance), I spend the last part of the speech explaining that the public sector should be very small because there are very few genuine “public goods.”

I discussed the Rahn Curve and cited the data showing that the federal government was a very tiny burden for much of America’s history.

I also pointed out that the burden of government was similarly modest in other western nations during the 1800s and early 1900s, which was when those countries went from agricultural poverty to middle-class prosperity.

And I pointed out that taxation would be a trivial issue if Liberland came into existence and has a very small government.

For those interested in the idea of new libertarian societies, there’s “seasteading.”

Seasteading, the concept of building freer societies upon unincorporated parts of the world’s oceans, is one of those so-crazy-it-just-might-work ideas within liberty/stateless circles. Long discussed, presented, talked about, mulled over, most cranks like myself mentally pocketed the idea years ago. Compelling enough, definitely, but it seemed wishful, immediately impractical. …The concept of seasteading really begins in earnest with Patri Friedman, grandson of Nobel Laureate Milton Friedman. The third generation Friedman doesn’t shy away from his famous lineage, which also includes anarcho-capitalist philosopher father David Friedman. …Mr Friedman vowed to take theory into practice. Real world. Right now. He, along with gadfly investor Peter Thiel, founded The Seasteading Institute. …The Seasteading Institute has inked a deal with French Polynesia for a trial city off their shores. It’s happening.

And “special economic zones” are another example of libertarian-style governance.

…two kinds of special jurisdictions — private communities and “Special Economic Zones” — are quietly taking over functions and providing options that traditional polities cannot or will not. This gentle revolution has already brought comparative wealth and better living to millions of people… In a Special Economic Zone (SEZ), a government creates exceptions to its own rules — a select haven from the status quo that prevails elsewhere in the national territory. The goal, says the World Bank, is to create a “business environment that is intended to be more liberal from a policy perspective and more effective from an administrative perspective than that of the national territory.” …The antecedents of modern SEZs date from 166 BCE, when Roman authorities made the island of Delos a free port, exempting traders from the usual taxes in order to stimulate local commerce. …The astonishing growth in SEZs qualifies as a revolution of sorts, but not the usual, political kind. Instead of being imposed by domestic or foreign enemies, this revolution has come from within, allowed or even encouraged by existing authorities.

And here’s a video about Liberland for those interested.

Let’s close with some wonkiness by looking at some academic research about fiscal policy and the evolution of government.

We’ll start with some excerpts from Tanzi and Schuknecht’s analysis of Public Spending in the 20th Century.

Classical economists thought that the government’s role should be limited to national defense, police, and administration because government “cannot have any other rational function but the legitimate defense of individual rights” (Bastiat, 1944–5). …For classical economists, the government role should be small… The countries’ institutional frameworks, such as the U.S. Constitution, did not specify any other economic role for the state. Consequently, in the last century, public spending was minimal in a number of industrialized countries for which data for 1870 could be found… In the United States, government expenditure was about 7 percent of GDP, and, in most newly industrialized European countries of the period, such as Germany, the United Kingdom, or the Netherlands, expenditure did not exceed 10 percent of GDP. A leading French economist of the time, Paul Leroy-Beaulieu (1888), addressing the question of the proper share of taxes in the economy, suggested that a share of 5–6 percent was moderate while a share beyond 12 percent had to be considered “exorbitant” and would damage the growth prospects of an economy.

Hmmm, I though Bastiat was the only good French economist. But Monsieur Leroy-Beaulieu obviously is a very sensible person.

Now let’s look at historical estimates of tax revenue, as presented in a study from two academics published by the London School of Economics.

…it was states in Europe that were the first to permanently break cycles of gains and losses in centralized fiscal and coercive capacity and build towards the modern state system. …we divide the annual per capita central tax revenues in silver by the daily wages of unskilled workers in silver. …The daily wages of unskilled urban workers in grams of silver…are available annually for most polities and in the absence of reliable estimates for per capita income, are frequently used by economic historians as a proxy for per capita income for this period. …During the first half of the sixteenth century, annual tax revenues per capita did not exceed 5 days of unskilled urban wages in most European countries. The only exceptions were the small and highly urbanized entities such as Venice and Holland. By the end of the eighteenth century, however, …many others had reached the 10 to 15 daily wages range and annual per capita revenues of the central administration in the Dutch Republic exceeded 20 days of urban wages. It is worth noting that the middle group where annual per capita revenues reached 10 to 15 daily wages included not only the more urbanized western European countries such as England, France, Spain and Venice but also the more rural and agricultural countries in central and eastern Europe such as Austria

Here’s a chart from the study that gives an idea of the tax burden in various nations from 1500-1800.

Last but not least, we have a very detailed study about the evolution of the state from economists at George Mason University. I’ve culled some of the key passages.

Recent scholarship in both political economy and development economics has emphasized the importance of state capacity in explaining why some countries have succeeded in achieving economic development whereas others have not. This literature points to the role of state capacity in explaining the durability of institutions that are both conducive to markets and to economic growth. …This literature recognizes both that predatory behavior by states is frequently a cause of economic stagnation and that well-functioning states can provide the institutional framework necessary for sustained economic growth. … Economies governed by strong, cohesive, and constrained states are better able to overcome vested interests and avoid disastrous economic policies, while societies ruled by weak states are prone to rentseeking, corruption and civil war. State capacity, therefore, can complement market-supporting institutions in providing a conducive setting for economic development. This insight was understood by Adam Smith who noted the importance of the provision of peace, justice, and easy taxation (Smith, 1763). …Economic growth in the absence of sufficient state capacity was not self-sustaining precisely because economically successful societies attracted predators. …Greater state capacity enabled the states of western Europe to escape from this violence trap in the eighteenth and nineteenth centuries. …Well functioning markets are not only required for allocative economic efficiency, they also provide the necessary conditions for sustained economic growth over time. But markets cannot operate in an institutional vacuum. They require property rights that are well defined and enforced and rely on governance institutions that can arbitrate claims and disputes. Governance institutions do not have to be provided by a state—that is by an organization that claims a monopoly on the legitimate use of force within a circumscribed territory. Historically there are many instances of market actors developing their own governance mechanisms in the absence of state enforcement through private-order arrangements… The state is certainly not required for either impersonal trade or for the emergence of rules of behavior and the rule of law. What the historical record suggests, however, is that during the relevant centuries prior to the industrial revolution, commerce and trade came increasingly under the purview of the public-order institutions. …State capacity, as we have noted, need not promote economic growth. States with high capacity can pursue destructive economic policies. Rather the point is that state capacity can be beneficial for growth when the state is constrained by law. One of the reasons for this is that high capacity states have the ability to enforce general rules. This ability is closely linked to what social scientists typically mean by rule of law. …What enables some societies to build effective states—states that are able to provide basic public goods but which are constrained and limited in scope and scale? …The origins of modern economic growth are to be found in the expansion of market exchange and trade that gave rise to a more sophisticated and complex division of labor that rewarded innovation and to the cultural and potentially non-economic factors that helped spur innovation (Howes, 2016; McCloskey, 2016; Mokyr, 2016). The importance of the rise of high capacity states to this story is that these states helped to provide the institutional conditions that either enabled growth and innovation to take place or at least prevented their destruction through warfare or rent-seeking. The emergence of sustained economic growth in the nineteenth century was associated with strong but limited states. Twentieth century ambitions to use state power to remold societies either ended in failure or were at least partially reversed. We have focused on the recent literature linking the rise of the modern state to positive economic outcomes, but do not want to give the impression that we are neglecting how easy it is for governments to destroy economies (e.g., Shleifer and Vishny, 1998; Easterly, 2001).

The core message is that the key to prosperity is having a state strong enough and effective enough to provide rule of law, but to somehow constrain that state so that it doesn’t venture into destructive redistribution policies.

This is why competition between governments played a key role in the economic development of the western world. When governments have to worry about productive resources escaping, that forces them to focus on things that help an economy (i.e., rule of law) while minimizing the policies that hinder prosperity (i.e., high taxes and spending).

P.S. I got a nice surprise at the conference. I was made a citizens of Liberland.

P.P.S. America’s Founding Fathers dealt with the same issues that I discussed at the Liberland conference. Their solution was a constitution that explicitly limited the size and scope of the federal government. As I noted in my speech, that system worked reasonably well until the 1930s. Now we’ve gone so far in the other direction that the Supreme Court says Washington can compel us to buy things from cronyist companies.

Avoiding the same fate will be a major challenge for Liberland. Assuming, of course, it gets off the ground.

Read Full Post »

At the risk of understatement, I’m not a fan of the Organization for Economic Cooperation and Development. Perhaps reflecting the mindset of the European governments that dominate its membership, the Paris-based international bureaucracy has morphed into a cheerleader for statist policies.

All of which was just fine from the perspective of the Obama Administration, which doubtlessly appreciated the OECD’s partisan work to promote class warfare and pimp for wasteful Keynesian spending.

What is particularly irksome to me is the way the OECD often uses dishonest methodology to advance the cause of big government.

But my disdain for the leftist political appointees who run the OECD doesn’t prevent me from acknowledging that the professional economists who work for the institution occasionally generate good statistics and analysis.

For instance, I’ve cited two  examples (here and here) of OECD research showing that spending caps are only effective fiscal rule. And I praised another OECD study that admitted the beneficial impact of tax competition. I even listed several good example of OECD research on tax policy as part of a column that ripped the bureaucracy for some very shoddy work in favor of Obama’s redistribution agenda.

And now we have some more good research to add to that limited list. A new working paper by two economists at the OECD contains some remarkable findings about the negative impact of government spending on economic performance. If you’re pressed for time, here’s the key takeaway from their research.

Governments in the OECD spend on average about 40% of GDP on the provision of public goods, services and transfers. The sheer size of the public sector has prompted a large amount of research on the link between the size of government and economic growth. …This paper investigates empirically the effect of the size and the composition of public spending on long-term growth… The main findings that emerge from the analysis are…Larger governments are associated with lower long-term growth. Larger governments also slowdown the catch-up to the productivity frontier.

For those who want more information, the working paper is filled with useful information and analysis.

Here’s one of the charts from the study, showing how government spending is allocated in OECD nations.

The report also acknowledges that there’s a lot of preexisting research showing that government spending hinders economic growth.

There is a vast empirical literature investigating the relationship between the size of the government and economic growth (see Slemrod, 1995; Myles 2009; Bergh and Henrekson, 2011 for overviews). A review by Bergh and Henrekson (2011), based on papers published in peer reviewed journals after 2000, suggested a negative relationship in OECD countries. Likewise, a recent OECD study confirmed a negative relationship between the size of government and GDP growth (Fall and Fournier, 2015). …the link between the size of government and growth may vary with the income level and could be hump-shaped (Armey, 1995). A few studies have found support for the existence of a non-linear relationship between the size of government and growth (e.g. Vedder and Gallaway, 1998; Pevcin, 2004; Chen and Lee, 2005).

By the way, the reference to “hump-shaped” means that the OECD is even aware of the Rahn Curve.

The methodology in the paper is not ideal from my perspective. For all intents and purposes, the economists compare economic performance of the OECD’s big-government nations with the growth numbers from the OECD’s not-quite-as-big-government nations. But even with that limitation, the study generates some powerful results.

…the simulation assumes that in countries where the size of government is above the average level of countries in the bottom half of the sample, the government size will gradually converge to this level (36% of GDP). Similar to the spending mix reforms, this reform is phased in over 10 years. Such a reduction in the size of the government could increase long-term GDP by about 10%, with much larger effects in some countries with currently large or ineffective governments. …a reduction of the size of government has a positive, but moderate, effect on the income of the poor. The average disposable income also rises. However, the rich gain relatively more. Finally, in countries where the government is less effective (such as Italy) the growth effect dominates and a moderate reduction of the size of government would have a large growth effect, so that it would lift all boats.

And here’s a chart showing how much more growth would be possible if the countries with really-big government downsized their public sectors to the somewhat-big level.

Even with the methodology limitations I described, these results are astounding. Potential GDP gains of more than 30 percent for Greece and Italy. Gains of more than 20 percent for Slovenia, France, and Hungary. And more than 10 percent for Belgium, Czech Republic, Portugal, and Poland.

The working paper also looks at the composition of government spending. In other words, just as not all taxes are equally damaging, the same is true for spending programs.

The results from the estimation of the size of the government and the public spending mix illustrate that public spending matters for long-term growth…pension and subsidy spending [are] the two items with a significantly negative effect on growth. As each regression includes the size of government and one spending share, the estimates provide the effect of increasing this type of spending while decreasing spending on other items to keep the spending to GDP ratio unchanged… larger governments are in several specifications significantly and negatively associated with long-term growth. This is consistent with the literature… Larger governments can impede convergence (Table 8, columns 1 and 3), because they are associated with higher taxation that can discourage business investment including foreign investment and households to supply labour.

Pensions and subsidies seem to cause the most economic harm.

Reducing the share of pension spending in primary spending yields sizeable growth gains with no significant adverse effect on disposable income inequality. This reduction could be achieved by an increase in the effective retirement age or by cutting the replacement rate. …Cutting public subsidies boosts growth, as public subsidies…can distort the allocation of resources and undermine competition. …Education outcomes depend not only on education spending but also on the effectiveness of education policies, and the literature suggest the latter can be more important. Since the seminal work of Coleman (1966), a broad literature suggests that there is no clear link between education spending and education outcomes. …policies aimed at increasing education spending effectiveness can be more appropriate than an across-the-board rise of education spending. …It may be that, beyond a certain point, additional spending on investment has adverse effects, if poorly managed.

For those of you with statistical/econometric knowledge, here’s some relevant data from the study.

And you can match the numbers in Table 6 with these excerpts.

…pension spending reduces growth (Table 6, columns 2, 5, 7 and 10). Increasing the share of pension spending in primary spending by one percentage point (offset by a reduction in other spending) would decrease potential GDP by about 2%. …Public spending on subsidies also reduces growth (Table 6, columns 3, 5, 8 and 10). …increasing the share of public subsidies in primary spending by one percentage point would decrease potential GDP by about 7%.

If you’re not a stats wonk, these two charts may be more helpful and easy to understand.

What jumped out at me is how the normally sensible nation of Switzerland is very bad about subsidies. That’s a policy they obviously need to fix (along with the fact that they also have a wealth tax, which is very uncharacteristic for that country).

But I’m digressing.

Let’s return to the study. One of the interesting things about the working paper is that it notes that bad fiscal policy can be somewhat mitigated by having market-oriented policies in other areas, which is a point I always make when writing about Scandinavian nations.

…countries with a high level of public spending may also be characterised by features that partly offset the adverse growth effect of government size. …in Sweden the mix of growth-friendly structural policies…may have offset the adverse growth effect of a large government sector.

In other words, the moral of the story is that smaller government is good and free markets are good. Mix the two together and you have best of all worlds.

P.S. Even if the OECD published dozens of quality studies like this one, I would still argue that American taxpayers should no longer be forced to subsidize the Paris-based bureaucracy. And even if the OECD’s political types stopped pushing statist policies, I would still have the same view about ending handouts from American taxpayers. This has nothing to do with the fact that the bureaucrats once threatened to have me arrested and thrown in a Mexican jail. I simply don’t think taxpayers should fund international bureaucracies.

P.P.S. Other international bureaucracies, including the World Bank and European Central Bank, also have published good research about the negative effect of excessive government spending.

P.P.P.S. My general disdain for the OECD (notwithstanding my qualified praise today for their new study on spending) may be exceeded by my hostility for the International Monetary Fund. I’ve referred to the IMF as both “the Dumpster Fire of the Global Economy” and “the Dr. Kevorkian of Global Economic Policy.”

Read Full Post »

Back in 2011, I shared a video that mocked libertarians by claiming that Somalia was their ideal no-government paradise.

I pointed out, of course, that the argument was silly. Sort of like claiming that North Korea is the left’s version of policy paradise.

But the video was very clever, and I’m more than willing to disseminate anti-libertarian humor if it’s clever and well done.

Some folks on the left, however, confuse satire with serious argument.

Consider the recent New York Times column by Nicholas Kristof. He wants his readers to think that advocates of small government somehow should be saddled with the blame for the dysfunctional nightmare of South Sudan. Seriously.

After hearing Republican presidential candidates denounce big government and burdensome regulation, I’d like to invite them to spend the night here in the midst of the civil war in South Sudan. You hear gunfire, competing with yowls of hyenas, and you don’t curse taxes. Rather, you yearn for a government that might install telephones, hire a 911 operator and dispatch the police. …Ted Cruz…is clamoring for: weaker government, less regulation… In some sense, you find the ultimate extension of all that right here.

Gee, isn’t Kristof clever. If you don’t support a bankrupt entitlement state and inane over-regulation, then you must want chaos and civil war.

Just in case you think I’m taking him out of context to make his argument look foolish, here are more excerpts.

No regulation! No long lines at the D.M.V., because there is no D.M.V. in the conflict areas. In practice, no taxes or gun restrictions. No Obamacare. No minimum wage. No welfare state to breed dependency. …In a place that might seem an anti-government fantasy taken to an extreme, people desperately yearn for all the burdens of government…that Americans gripe about. …One lesson of South Sudan is that government and regulations are like oxygen: You don’t appreciate them until they’re not there.

Notice how he wants to make it seem like the choice is South Sudan on one hand versus “all the burdens of government” on the other.

To be fair, Kristof does attempt a serious argument later in his column.

Two political scientists, Jacob Hacker and Paul Pierson, argue that America’s achievements rest on a foundation of government services… “We are told that the United States got rich in spite of government, when the truth is closer to the opposite,” they write. Every country that journeyed from mass illiteracy and poverty to modernity and wealth did so, they note, because of government instruments that are now often scorned. …What we Americans excel at are our institutions. We have schools, laws, courts, police, regulators, bureaucracies, safety nets — arms of a government that is often frustrating but always indispensable. These institutions are the pillars of our standard of living. …Government, laws and taxes are a burden, indeed, but they are also the basis for civilization.

I haven’t read the work of Hacker and Pierson, but there’s been extensive research about the factors that produce economic growth. So if Hacker and Pierson are merely claiming that certain things traditionally provided by governments – such as rule of law, protection of property rights, enforcement of contracts, courts and police, and national defense – are associated with economic growth, then we’re on the same page.

But that’s an argument for a small state. Indeed, I’ve pointed that the United States (and other nations in the western world) became rich in the 1800s when there was a limited government providing these core “public goods.”

And at the time, there was virtually no redistribution. Not only in the United States, but in other developed nations as well.

The problem is that Kristof and other statists want large welfare states with lots of redistribution. And those are the policies that lead to less prosperity. And perhaps even fiscal chaos.

Indeed, that’s the argument behind the Rahn Curve. A small amount of (properly focused) government is associated with growth. But once the public sector gets too large, then government spending saps a nation’s economy.

To conclude, perhaps there is common ground. If Kristof is willing to admit that a bloated welfare states is misguided, then I’ll be willing to say that no government can lead to South Sudan.

P.S. There are serious scholars who argue “public goods” can be provided privately. Click here for a good introduction to the issue.

P.P.S. Leftists like to share the quote from Justice Oliver Wendell Holmes about “taxes are the price we pay for a civilized society.” This statement is even etched in stone at the headquarters of the internal revenue service.

What folks conveniently forget, though, is that Holmes reportedly made that statement in 1904, nine years before there was an income tax, and then again in 1927, when federal taxes amounted to only $4 billion and the federal government consumed only about 5 percent of economic output.

As I wrote in 2013, “I’ll gladly pay for that amount of civilization.”

P.P.P.S. In his column, Kristof uses Trump as a foil even more than Cruz. Since I’m unconvinced that Trump believes in smaller government, I didn’t include those excerpts (while Cruz, even while he has some views I don’t like, seems to be a sincere and principled advocate of economic liberty).

Read Full Post »

As a fiscal policy economist who believes in individual liberty and personal responsibility, I have two goals.

1. Replace the corrupt and punitive internal revenue code with a simple and fair flat tax that raises necessary revenue in the least-destructive and least-intrusive manner possible.

2. Shrink the size of the federal government so that it only funds the core public goods, such as national defense and rule of law, envisioned by America’s Founding Fathers.

Needless to say, I haven’t been doing a great job. The tax code seems to get worse every year, and even though we’ve made some progress in recent years on spending, the long-run outlook is still very grim because there’s hasn’t been genuine entitlement reform.

But I continue with my Sisyphean task. And part of my efforts include educating people about the Rahn Curve, which is sort of the spending version of the Laffer Curve. it shows the non-linear relationship between the size of government and economic performance.

Simply stated, some government spending presumably enables growth by creating the conditions (such as rule of law and property rights) for commerce.

But as politicians learn to buy votes and enhance their power by engaging in redistribution, then government spending is associated with weaker economic performance because of perverse incentives and widespread misallocation of resources.

I’ve even shared a number of videos on the topic.

The video I narrated explaining the basics of the Rahn Curve, which was produced by the Center for Freedom and Prosperity.

A video from the Fraser Institute in Canada that reviews the evidence about the growth-maximizing size of government.

A video from the Centre for Policy Studies in the United Kingdom that explores the relationship between prosperity and the size of the public sector.

Even a video on the Rahn Curve from a critic who seems to think that I’m a closeted apologist for big government.

Now we have another video to add to the collection.

Narrated by Svetla Kostadinova of Bulgaria’s Institute for Market Economics, it discusses research from a few years ago about the “optimal size of government.”

If you want to read the research study that is cited in the video, click here. The article was written by Dimitar Chobanov and Adriana Mladenova of the IME

The evidence indicates that the optimum size of government, e.g. the share of overall government spending that maximizes economic growth, is no greater than 25% of GDP (at a 95% confidence level) based on data from the OECD countries. In addition, the evidence indicates that the optimum level of government consumption on final goods and services as a share of GDP is 10.4% based on a panel data of 81 countries. However, due to model and data limitations, it is probable that the results are biased upwards, and the “true” optimum government level is even smaller than the existing empirical study indicates.

Two points in that excerpt are worth additional attention.

First, they understand that not all forms of government spending have equal effects.

Spending on core public goods (rule of law, courts, etc) generally are associated with better economic performance.

Spending on physical and human capital (infrastructure and education) can be productive, though governments often do a poor job based on a money-to-outcomes basis.

Most government spending, though, is for transfers and consumption, and these are areas where the economic effects are overwhelmingly negative.

So kudos to the Bulgarians for recognizing that it’s particularly important to restrain some types of outlays.

The other point that merits additional emphasis is that the growth-maximizing size of government is probably far lower than 25 percent of economic output.

Here’s what they wrote, citing yours truly.

…the results from the above mentioned models should not be taken as the “true” optimal level of government due to limitations of the models, and lack of data as already discussed. As Dan Mitchell commented, government spending was about 10% of GDP in the West from the end of the Napoleonic wars to World War I. And we do not have any data to think that growth would have been higher if government was doubled or tripled. However, what the empirical results do show is that the government spending should be much less than is the average of most countries at the moment. Thus, we can confidentially say the optimum size of general government is no bigger than 25% but is likely to be considerably smaller because of the above-mentioned reasons.

And here’s their version of the Rahn Curve, though I’m not a big fan since it seems to imply that government should consume about one-third of economic output.

I much prefer the curve to show the growth-maximizing level under 20 percent of GDP.

Though I often use a dashed line to emphasize that we don’t really know the actual peak because there unfortunately are no developed nations with modest-sized public sectors.

Even Singapore and Hong Kong have governments that consume about 20 percent of economic output.

But maybe if I someday achieve my goal, we’ll have better data.

And maybe some day I’ll go back to college and play quarterback for my beloved Georgia Bulldogs.

P.S. Since I shared one video, I can’t resist also including this snippet featuring Ronald Reagan talking about libertarianism.

What impresses me most about this clip is not that Reagan endorses libertarianism.

Instead, notice how he also explains the link between modern statism and fascism.

He had a much greater depth of knowledge than even supporters realize. Which also can be seen in this clip of Reagan explaining why the Keynesians were wrong about a return to Depression after World War II.

And click here if you simply want to enjoy some classic Reagan clips. For what it’s worth, this clip from his first inauguration is my favorite.

Given my man crush on the Gipper, you also won’t be surprised to learn that this is the most encouraging poll I’ve ever seen.

Read Full Post »

What’s the relationship between the Rahn Curve and the Laffer Curve?

For the uninitiated, the Rahn Curve is the common-sense notion that some government is helpful for prosperous markets but too much government is harmful to economic performance.

Even libertarians, for instance, will acknowledge that spending on core “public goods” such as police protection and courts (assuming, of course, low levels of corruption) can enable the smooth functioning of markets.

Some even argue that government spending on human capital and physical capital can facilitate economic activity. For what it’s worth, I think that the government’s track record in those areas leaves a lot to be desired, so I’d prefer to give the private sector a greater role in areas such as education and highways.

The big problem, though, is that most government spending is for programs that are often categorized as “transfers” and “consumption.” And these are outlays that clearly are associated with weaker economic performance.

This is why small-government economies such as Hong Kong and Singapore tend to grow faster than the medium-government economies such as the United States and Australia. And it also explains why growth is even slower is big-government economies such as France and Italy.

The Laffer Curve, for those who don’t remember, is the common-sense depiction of the relationship between tax rates and tax revenue.

The essential insight is that taxable income is not fixed (regardless of the Joint Committee on Taxation’s flawed methodology).

When tax rates are low, people will earn and report lots of income, but when tax rates are high, taxpayers figure out ways of reducing the amount of taxable income they earn and report to government.

This is why, for instance, the rich paid much more to the IRS after Reagan lower the top tax rate from 70 percent to 28 percent.

So why am I giving a refresher course on the Rahn Curve and Laffer Curve?

Because I’ve been asked on many occasions whether there is a relationship between the two concepts and I’ve never had a good answer.

But I’m happy to call attention to the good work of other folks, so here’s a very well done depiction of the relationship between the two curves (though in this case the Rahn Curve is called the Armey Curve).

I should hasten to add, by the way, that I don’t agree with the specific numbers.

I think the revenue-maximizing rate is well below 45 percent and I think the growth-maximizing rate is well below 30 percent.

But the image above is spot on in that it shows that a nation should not be at the revenue-maximizing point of the Laffer Curve.

Since I’m obviously a big fan of the Rahn Curve and I also like drawing lessons from cross-country comparisons, here’s a video on that topic from the Center for Freedom and Prosperity.

Well done, though I might quibble on two points, though the first is just the meaningless observation that the male boxer is not 6′-6″ and 250 lbs.

My real complaint (and this will sound familiar) is that I’m uneasy with the implication around the 1:45 mark that growth is maximized when government spending consumes 25 percent of economic output.

This implies, for instance, that government in the United States was far too small in the 1800s and early 1900s when the overall burden of government spending was about 10 percent of GDP.

But I suppose I’m being pedantic. Outlays at the national, state, and local level in America now consume more than 38 percent of economic output according to the IMF and we’re heading in the wrong direction because of demographic changes and poorly designed entitlement programs.

So if we can stop government from getting bigger and instead bring it back down to 25 percent of GDP, even I will admit that’s a huge accomplishment.

Libertarian Nirvana would be nice, but I’m more concerned at this point about simply saving the nation from becoming Greece.

P.S. I’ve shared numerous columns from Walter Williams and he is one of America’s best advocates of individual liberty and economic freedom.

Now there’s a documentary celebrating his life and accomplishments. Here’s a video preview.

Given Walter’s accomplishments, you won’t be surprised to learn that there’s another video documentary about his life.

Read Full Post »

I’ve shared lots of data and evidence about the harmful economic impact of government spending.

Simply stated, budgetary outlays divert resources from more productive uses. And this results in labor and capital being misallocated, leading to less economic output.

The damage is even more pronounced when you look at how politicians finance the budget. Whether they use taxes or borrowing (or even printing money), there are additional distortions that hinder the private sector.

Today, we’re going to look at the economic impact of a particular type of government spending. A new working paper by two academics at the University of Miami has revealed a negative relationship between government consumption spending and economic growth.

But before digging into the details, what do public finance economists mean when they talk about “consumption spending”? At the risk of over-simplifying, it’s the part of the budget used to purchase goods and services. Everything from soldiers to housing and from jails to education.

It’s basically the so-called discretionary portion of the federal budget, minus “investment spending” (which would be things like roads).

Anyhow, here are some of the key findings.

This paper tests the Mundellian hypothesis that too much government spending reduces economic growth… In this paper, we analyze annual panel data from 1999 to 2011 for 31 OECD countries to examine the role of government spending in determining economic growth. In particular, we will focus our attention on government consumption spending on non-market goods such as defense and justice for collective consumption and its effect on growth in real GDP growth. …We find that government consumption spending on non-market goods signifi cantly reduces economic growth. A one percentage point increase in government consumption of non-market goods as a percent of GDP is associated with a 0.86 percentage lower growth rate in GDP. …This result is compatible with Barro (1990)’s fi nding for the Summers and Heston database, but suggests a stronger negative eff ect of government consumption on economic growth.

That’s a big number, which implies that we’re definitely on the downward-sloping portion of the Rahn Curve.

By the way, just in case you’re wondering why Obama’s “stimulus” was such a flop, the study also notes that “the 2009 American Reinvestment and Recovery Act envisaged less than 5% spending on public investment, and over 95% on consumption.”

In other words, Obama increased the type of government spending with the worst impact on the economy. Something to keep in mind when politicians, lobbyists, interest groups, and other insiders argue that there’s no need to cut back on discretionary spending.

But it’s also important to note that the study has some findings that may distress libertarians and small-government conservatives. It finds, for instance, that “government investment spending is positively related to growth.”

Also, it’s important to realize that the study is limited to only certain forms of discretionary spending. As the authors explain, they examine, “the impact of government consumption spending net of health, education and housing service.”

But even with those caveats, we have another strong piece of evidence that our economy would grow much faster if we reduced the burden of government spending.

And if you need more evidence on the harmful effect of government spending (either generally or specific types of outlays), allow me to call your attention to research even from normally left-leaning international bureaucracies such as the Organization for Economic Cooperation and Development, International Monetary Fund, World Bank, and European Central Bank.

And you can find similar findings in the work of scholars from all over the world, including the United States, Finland, Australia, Sweden, Italy, Portugal, and the United Kingdom.

Read Full Post »

There’s an old saying that there’s no such thing as bad publicity.

That may be true if you’re in Hollywood and visibility is a key to long-run earnings.

But in the world of public policy, you don’t want to be a punching bag. And that describes my role in a book excerpt just published by Salon.

Jordan Ellenberg, a mathematics professor at the University of Wisconsin, has decided that I’m a “linear” thinker.

Here are some excerpts from the article, starting with his perception of my view on the appropriate size of government, presumably culled from this blog post.

Daniel J. Mitchell of the libertarian Cato Institute posted a blog entry with the provocative title: “Why Is Obama Trying to Make America More Like Sweden when Swedes Are Trying to Be Less Like Sweden?” Good question! When you put it that way, it does seem pretty perverse.  …Here’s what the world looks like to the Cato Institute… Don’t worry about exactly how we’re quantifying these things. The point is just this: according to the chart, the more Swedish you are, the worse off your country is. The Swedes, no fools, have figured this out and are launching their northwestward climb toward free-market prosperity.

I confess that he presents a clever and amusing caricature of my views.

My ideal world of small government and free markets would be a Libertopia, whereas total statism could be characterized as the Black Pit of Socialism.

But Ellenberg’s goal isn’t to merely describe my philosophical yearnings and policy positions. He wants to discredit my viewpoint.

So he suggests an alternative way of looking at the world.

Let me draw the same picture from the point of view of people whose economic views are closer to President Obama’s… This picture gives very different advice about how Swedish we should be. Where do we find peak prosperity? At a point more Swedish than America, but less Swedish than Sweden. If this picture is right, it makes perfect sense for Obama to beef up our welfare state while the Swedes trim theirs down.

He elaborates, emphasizing the importance of nonlinear thinking.

The difference between the two pictures is the difference between linearity and nonlinearity… The Cato curve is a line; the non-Cato curve, the one with the hump in the middle, is not. …thinking nonlinearly is crucial, because not all curves are lines. A moment of reflection will tell you that the real curves of economics look like the second picture, not the first. They’re nonlinear. Mitchell’s reasoning is an example of false linearity—he’s assuming, without coming right out and saying so, that the course of prosperity is described by the line segment in the first picture, in which case Sweden stripping down its social infrastructure means we should do the same. …you know the linear picture is wrong. Some principle more complicated than “More government bad, less government good” is in effect. …Nonlinear thinking means which way you should go depends on where you already are.

Ellenberg then points out, citing the Laffer Curve, that “the folks at Cato used to understand” the importance of nonlinear analysis.

The irony is that economic conservatives like the folks at Cato used to understand this better than anybody. That second picture I drew up there? …I am not the first person to draw it. It’s called the Laffer curve, and it’s played a central role in Republican economics for almost forty years… if the government vacuums up every cent of the wage you’re paid to show up and teach school, or sell hardware, or middle-manage, why bother doing it? Over on the right edge of the graph, people don’t work at all. Or, if they work, they do so in informal economic niches where the tax collector’s hand can’t reach. The government’s revenue is zero… the curve recording the relationship between tax rate and government revenue cannot be a straight line.

So what’s the bottom line? Am I a linear buffoon, as Ellenberg suggests?

Well, it’s possible I’m a buffoon in some regards, but it’s not correct to pigeonhole me as a simple-minded linear thinker. At least not if the debate is about the proper size of government.

I make this self-serving claim for the simple reason that I’m a big proponents of the Rahn Curve, which is …drum roll please… a nonlinear way of looking at the relationship between the size of government and economic performance. And just in case you think I’m prevaricating, here’s a depiction of the Rahn Curve that was excerpted from my video on that specific topic.

Moreover, if you click on Rahn Curve category of my blog, you’ll find about 20 posts on the topic. And if you type “Rahn Curve” in the search box, you’ll find about twice as many mentions.

So why didn’t Ellenberg notice any of this research?

Beats the heck out of me. Perhaps he made a linear assumption about a supposed lack of nonlinear thinking among libertarians.

In any event, here’s my video on the Rahn Curve so you can judge for yourself.

And if you want information on the topic, here’s a video from Canada and here’s a video from the United Kingdom.

P.S. I would argue that both the United States and Sweden are on the downward-sloping portion of the Rahn Curve, which is sort of what Ellenberg displays on his first graph. Had he been more thorough in his research, though, he would have discovered that I think growth is maximized when the public sector consumes about 10 percent of GDP.

P.P.S. Ellenberg’s second chart puts the U.S. and Sweden at the same level of prosperity. Indeed, it looks like Sweden is a bit higher. That’s certainly not what we see in the international data on living standards. Moreover, Ellenberg may want to apply some nonlinear thinking to the data showing that Swedes in America earn a lot more than Swedes still living in Sweden.

Read Full Post »

I feel a bit like Goldilocks.

No, this is not a confession about cross-dressing or being transsexual. I’m the boring kind of libertarian.

Instead, I have a run-of-the-mill analogy. Think about when you were a kid and your parents told you the story of Goldilocks and the Three Bears.

You may remember that she entered the house and tasted bowls of porridge that were too hot and also too cold before she found the porridge that was just right.

And then she found a bed that was too hard, and then another that was too soft, before finding one that was just right.

Well, the reason I feel like Goldilocks is because I’ve shared some “Rahn Curve” research suggesting that growth is maximized when total government spending consumes no more than 20 percent of gross domestic product. I think this sounds reasonable, but Canadians apparently have a different perspective.

Back in 2010, a Canadian libertarian put together a video that explicitly argues that I want a government that is too big.

Now we have another video from Canada. It was put together by the Fraser Institute, and it suggests that the public sector should consume 30 percent of GDP, which means that I want a government that is too small.

My knee-jerk reaction is to be critical of the Fraser video. After all, there are examples – both current and historical – of nations that prosper with much lower burdens of government spending

Singapore and Hong Kong, for instance, have public sectors today that consume less than 20 percent of economic output. Would those fast-growing jurisdictions be more prosperous if the burden of government spending was increased by more than 50 percent?

Or look at Canadian history. As recently as 1920, government outlays were 16.7 percent of economic output. Would Canada have grown faster if lawmakers at the time had almost doubled the size of government?

And what about nations such as the United States, Germany, France, Japan, Sweden, and the United Kingdom, all of which had government budgets in 1870 that consumed only about 10 percent of GDP. Would those nations have been better off if the burden of government spending was tripled?

I think the answer to all three questions is no. So why, then, did the Fraser Institute conclude that government should be bigger?

There are three very reasonable responses to that question. First, the 30 percent number is actually a measurement of where you theoretically maximize “social progress” or “societal outcomes.” If you peruse the excellent study that accompanies the video, you’ll find that economic growth is most rapid when government consumes 26 percent of GDP.

Second, the Fraser research – practically speaking – is arguing for smaller government, at least when looking at the current size of the public sector in Canada, the United States, and Western Europe. According to International Monetary Fund data, government spending consumes 41 percent of GDP in Canada, 39 percent of GDP in the United States, and 55 percent of GDP in France.

The Fraser Institute research even suggests that there should be significantly less government spending in both Switzerland and Australia, where outlays total “only” 34 percent of GDP.

Third, you’ll see if you read the underlying study that the author is simply following the data. But he also acknowledges “a limitation of the data,” which is that the numbers needed for his statistical analysis are only available for OECD nations, and only beginning in 1960.

This is a very reasonable point, and one that I also acknowledged when writing about some research on this topic from Finland’s Central Bank.

…those numbers…are the result of data constraints. Researchers looking at the post-World War II data generally find that Hong Kong and Singapore have the maximum growth rates, and the public sector in those jurisdictions consumes about 20 percent of economic output. Nations with medium-sized governments, such as Australia and the United States, tend to grow a bit slower. And the bloated welfare states of Europe suffer from stagnation. So it’s understandable that academics would conclude that growth is at its maximum point when government grabs 20 percent of GDP. But what would the research tell us if there were governments in the data set that consumed 15 percent of economic output? Or 10 percent, or even 5 percent? Such nations don’t exist today.

For what it’s worth, I assume the author of the Fraser study, given the specifications of his model, didn’t have the necessary post-1960 data to include small-state, high-growth, non-OECD jurisdictions such as Hong Kong and Singapore. If that data had been available, I suspect he also would have concluded that government should be closer to 20 percent of economic output.

I explore all these issues in my video on this topic.

The moral of the story is that government is far too large in every developed nation.

I suspect even Hong Kong and Singapore have public sectors that are too large, causing too many resources to be diverted from the private sector.

But since I’m a practical and moderate guy, I’d be happy if the burden of government spending in the United States was merely reduced back down to 20 percent of economic output.

P.S. Though I would want the majority of that spending at the state and local level.

P.P.S. Since I’m sharing videos today, here’s an amusing video from American Commitment about the joy of being “liberated” from employment.

And if you like snarky videos about Obamacare, here are some based on sex and mockery, and there’s even a Hitler parody.

P.P.P.S. This has nothing to do with public policy, but I got a good chuckle from this news out of Iraq.

A group of Sunni militants attending a suicide bombing training class at a camp north of Baghdad were killed on Monday when their commander unwittingly conducted a demonstration with a belt that was packed with explosives, army and police officials said. …Twenty-two ISIS members were killed, and 15 were wounded, in the explosion at the camp.

One of the reasons I laughed is that I recalled a cartoon that was sent to me many years ago. And when I dug into my humor folder, it was still there.

I think you’ll see the obvious connection.

Terrorist School

And since we’re venturing into humor about self-detonating terrorists, here’s another joke from my treasure trove.

===================================

Guy goes into a sex shop and asks for an inflatable doll.

Guy behind the counter says, “Male or female?”

Customer says, “Female.”

Counter guy asks, “Black or white?

Customer says, “White.”

Counter guy asks, “Christian or Muslim?”

Customer says, “What the hell does religion have to do with it?”

Counter guy says, “The Muslim one blows itself up.”

===================================

And here’s another joke that’s worth sharing.

Garfield Terrorist

If this isn’t enough terrorism-related humor for you, we also have this collection of stereotypes I received from an English friend.

This image, meanwhile, doubtlessly has caused a few nightmares in certain quarters.

And this Jay Leno joke is one of the best examples of anti-political correctness I’ve ever seen.

Read Full Post »

My goal in life is very simple. I want to promote freedom and prosperity by limiting the size and scope of government.

That seems like a foolish and impossible mission, perhaps best suited for Don Quixote. After all, what hope is there of overcoming the politicians, interest groups, bureaucrats, and lobbyists who benefit from bigger government?

But I don’t think I’m being totally irrational. I’ve pointed out, for instance, that we can make progress if we simply restrain the growth of government so that it expands slower than the private sector. Surely that’s not asking too much, right? Heck, we’ve done that for the past two years!

Moreover, while much of Washington is a fact-free zone, I’m encouraged by the wealth of evidence showing that big government is bad for growth.

I’ve cited research on the negative impact of excessive government spending from international bureaucracies such as the Organization for Economic Cooperation and Development, International Monetary Fund, World Bank, and European Central Bank. And since most of those organizations lean to the left, these results should be particularly persuasive.

I’ve also cited the work of scholars from all over the world, including the United States, Finland, Australia, Sweden, Italy, and the United Kingdom.

And I share additional compelling data in this video, including a comparison of the United States and Europe.

Now we have some more evidence to add to our collection. Here are some excerpts from a study by two European economists. We’ll start with a blurb from the abstract that tells you everything you need to know.

The aim of this paper is to analyze the impact of government spending on the private sector, assessing the existence of crowding-out versus crowding-in effects. Using a panel of 145 countries from 1960 to 2007, the results suggest that government spending produces important crowding-out effects, by negatively affecting both private consumption and investment.

But if you want to understand how they did their research, here are some methodological details.

While most of the tests of the “crowding-out” versus “crowding-in” hypothesis that have been carried in previous papers focus on a time series or cross-country approach, this work extends such analysis to a panel data set of 145 countries from 1960 to 2007. The results show that government spending produces important crowding-out effects, by negatively affecting both private consumption and investment. …In addition, we analyze possible asymmetries of the effect of government consumption on private consumption and investment. In particular, we test: i) whether the effect varies among regions; and ii) whether it depends on to the phase of the economic cycle. We find that the effect varies substantially among regions, but it does not seem to depend on the phase of the economic cycle. …we study the impact of changes in the ratio of government spending to GDP on the growth of real per capita private consumption and private investment.

Here are some of the key results, starting with how government spending impacts consumption.

Starting with the analysis of the effect of government consumption on private consumption (Table 5a), we can immediately see that it is negative and statistically significant. The results also suggest that not only contemporaneous changes in the government consumption-GDP ratio matter, but also its past lags (specifically, the 2nd and 3rd ones). In particular, the cumulative effect of government spending on private consumption is about 1.9 %, of which about 1.2% captured by contemporaneous changes in the government consumption-GDP ratio and 0.7 % by its lags. This result can be interpreted as follows: an increase of government consumption by 1 % of real GDP immediately reduces consumption by approximately 1.2%, with the decline continuing for about four years when the cumulative decrease in consumption has reached approximately 1.9 %.

And here’s the data on how government spending affects investment.

Similarly to what we obtained for private consumption, both current and lagged changes in government consumption-GDP ratio have a negative and significant effect on private investment, with a cumulative effect of approximately 1.8%. The main difference between the effect on consumption and investment is that, while contemporaneous change in the government consumption-GDP ratio seems to have a bigger effect on consumption, lagged changes are more detrimental for investment.

Interestingly, the economists find that the harmful impact of government spending varies by region and country.

But is the effect similar for different regions and countries? To answer this question, we replicate the estimations for specific geographical areas and countries. …The results show that the effect varies substantially between areas. In particular, while we find statistically significant crowding-out effects in Africa, Europe and South America, government spending does not seem to have (statically) significant affects in the other areas considered. We also assess whether the effect is different between developed (OECD) and developing countries. The results suggest that the impact of government spending on both private consumption and investment is more detrimental in the OECD group. …it emerges that the “crowding-out” effects of government consumption are largest in relatively less developed countries (such as Mexico and Turkey) and in those countries with a high share of government spending (such as Finland, Sweden and Norway).

While I’m always cautious about drawing sweeping conclusions from any single piece of empirical research, these results make a lot of sense.

Rahn CurveThe Rahn Curve (which is sort of a spending version of the Laffer Curve) is based on the theory that a very modest level of government, focusing on providing core public goods, is associated with better economic performance. But once government gets too big, than the relationship is reversed and higher levels of spending are associated with weaker performance.

So it’s no surprise that bigger government has particularly bad effects in nations that already have bloated public sectors. Here’s the video I narrated on the Rahn Curve, which provides additional analysis.

Last but not least, it also makes sense that bigger government has a pronounced negative effect in less-developed nations. Those are countries that generally have serious problems with corruption, cronyism, and the rule of law (i.e., Argentina), so the budget often is simply a tool for transferring funds to those with power and political connections.

For all their flaws, the Nordic nations at least are reasonably honest and well run. That being said, the fact that they can endure a larger level of government doesn’t mean it’s a good idea.

P.S. Someone did a video attacking my analysis of the Rahn Curve. Except it isn’t really an attack since I agree with the criticism.

P.P.S. For those who want to argue that the relative prosperity (by global standards) of Western Europe is evidence that big government is good for growth, I invite you to look at this chart. Simply stated, Western Europe became rich when government was very small.

P.P.P.S. Just as there’s lots of evidence about the damaging impact of government spending, there’s also a lot of research showing that high tax rates are economically destructive.

P.P.P.P.S. While I sometimes myopically focus on fiscal policy, remember that there are many other policies that determine economic performance.

Read Full Post »

The fiscal policy debate often drives me crazy because far too many people focus on deficits.

The Keynesians argue that deficits are good for growth and this leads them to support more government spending.

The “austerity” crowd at places such as the International Monetary Fund, by contrast, argues that deficits are bad for growth and this leads them to support higher taxes.

Then you have institutions such as the Congressional Budget Office that want the worst of all worlds, supporting Keynesian spending in the short run while advocating higher taxes in the long run.

But since I don’t like higher spending or higher taxes, you can see why I want to pull my hair out.

With this in mind, I’m pleased that economists at the European Central Bank have released some new research on “Fiscal Composition and Long-Term Growth” which doesn’t reflexively assume that red ink is the key variable. Instead, they dispassionately look at how several fiscal policy variables impact economic performance.

Here is the general conclusion.

In this study we use a large panel of developed and developing countries for the period 1970-2008. …Specifically, we examine the following issues: the influence of which budgetary components have a stronger influence in affecting (positively or negatively) per capita GDP growth rates… Our evidence suggests that for the full sample…government expenditures appear with significant negative signs.

This makes sense. Whether financed by taxes or borrowing, excessive government expenditures hurt an economy by diverting resources from productive uses.

But not all government spending is created equal. Here are some of the specific findings.

In a nutshell, our results comprise notably: i) for the full sample revenues have no significant impact on growth whereas government expenditures have significant negative effects; ii) the same is true for the OECD sub-sample with the addition that total government revenues have a negative impact on growth; iii) taxes on income are less welcome for growth; iv) public wages, interest payments, subsidies and government consumption have a negative effect on output growth; v) expenditures on social security and welfare are less growth enhancing.

It’s noteworthy that government spending is negatively correlated with economic performance for both developing and advanced nations.

It’s also interesting that taxes on income are bad for growth everywhere, and overall revenue is bad for growth in advanced nations (both of these findings, incidentally, suggest that Obama’s class-warfare tax agenda is quite misguided).

The authors of the study also find that some forms of government spending are particularly harmful for growth. That also makes a lot of sense since I’ve explained in my video on the Rahn Curve that core public goods can be good for growth while other types of government spending undermine prosperity.

So what does all this mean? Simply stated, the fiscal problem in virtually all nations is not red ink. It’s big government. Large deficits aren’t desirable, to be sure, but they’re best understood as side effects of too much spending.

In other words, entitlements need to be reformed and discretionary spending needs to be reduced. Solve these underlying problems and you fix the symptoms of red ink and sluggish growth.

Read Full Post »

Back in 2010, I wrote a post entitled “What’s the Ideal Point on the Laffer Curve?

Laffer CurveExcept I didn’t answer my own question. I simply pointed out that revenue maximization was not the ideal outcome.

I explained that policy makers instead should seek to maximize prosperity, and that this implied a much lower tax rate.

But what is that tax rate, several people have inquired?

The simple answer is that the tax rate should be set to finance the legitimate functions of government.

But that leads to an obvious follow-up question. What are those legitimate functions?

According to my anarcho-capitalist friends, there’s no need for any public sector. Even national defense and courts can be shifted to the private sector.

In that case, the “right” tax rate obviously is zero.

But what if you’re a squishy, middle-of-the-road moderate like me, and you’re willing to go along with the limited central government envisioned by America’s Founding Fathers?

That system operated very well for about 150 years and the federal government consumed, on average, only about 3 percent of economic output. Historical Burden of Federal SpendingAnd even if you include state and local governments, overall government spending was still less than 10 percent of GDP.

Moreover, for much of that time, America prospered with no income tax.

But this doesn’t mean there was no tax burden. There were excise taxes and import taxes, so if the horizontal axis of the Laffer Curve measured “Taxes as a Share of GDP,” then you would be above zero.

Or you could envision a world where those taxes were eliminated and replaced by a flat tax or national sales tax with a very low rate. Perhaps about 5 percent.

So I’m going to pick that number as my answer, even though I know that 5 percent is nothing more than a gut instinct.

For more information about the growth-maximizing size of government, watch this video on the Rahn Curve.

There are two key things to understand about my discussion of the Rahn Curve.

First, I assume in the video that the private sector can’t provide core public goods, so the discussion beginning about 0:33 will irk the anarcho-capitalists. I realize I’m making a blunt assumption, but I try to keep my videos from getting too long and I didn’t want to distract people by getting into issues such as whether things like national defense can be privatized.

Second, you’ll notice around 3:20 of the video that I explain why I think the academic research overstates the growth-maximizing size of government. Practically speaking, this seems irrelevant since the burden of government spending in almost all nations is well above 20 percent-25 percent of GDP.

But I hold out hope that we’ll be able to reform entitlements and take other steps to reduce the size and scope of government. And if that means total government spending drops to 20 percent-25 percent of GDP, I don’t want that to be the stopping point.

At the very least, we should shrink the size of the state back to 10 percent of economic output.

And if we ever get that low, then we can have a fun discussion with the anarcho-capitalists on what else we can privatize.

P.S. If a nation obeys Mitchell’s Golden Rule for a long enough period of time, government spending as a share of GDP asymptotically will approach zero. So perhaps there comes a time where my rule can be relaxed and replaced with something akin to the Swiss debt brake, which allows for the possibility of government growing at the same rate as GDP.

Read Full Post »

Earlier this year, I reported on some remarkable research from the World Bank, which found that “big governments are a drag on growth.”

Other international bureaucracies also have begun to admit that the welfare state isn’t conducive to prosperity.

The negative relationship between economic performance and a bloated public sector also has been confirmed by research from other places not often associated with libertarian thought, including Harvard and Sweden.

And now we have some very interesting findings in this new research from the Bank of Finland.

Europe suffers from a growth slowdown. The GDP growth in Europe has lagged behind the GDP growth in the US and has been far worse than the GDP growth in the NIC countries, particularly China… However, what is the reason for slow or rapid economic growth? …In many respects, the labour market plays the key role in the economy because it determines both the use of the labour input and the level of overall competitiveness of a nation. Obviously, the functioning of the labour market is not independent of the public sector. A large government is almost inevitably associated with a large tax wedge, and the functioning of the labour market appears to be critically dependent on the size of the tax wedge. It may be fair to say that the harmful consequences of a high tax wedge are exceptionally well and unambiguously documented in the literature. …On the basis of the estimates derived in this study, the following guide for growth policies appears to be warranted: …Do not over-expand the welfare state. Larger governments are associated with slower growth rates.

Gee, that sounds quite familiar. Where have we come across this notion that big government has a negative impact on growth? Sounds a lot like the Rahn Curve.

Indeed, the paper makes another point that is very consistent with the Rahn Curve.

Rahn CurveAs this simple chart illustrates, the Rahn Curve is sort of the spending equivalent of the Laffer Curve.

Except government spending is on the horizontal axis and economic performance is on the vertical axis.

The ideal outcome is for government to be kept small so that economic output is at its maximum point. The academic literature suggests that prosperity is at its peak level when the burden of government spending is about 20 percent of GDP.

I actually disagree with those numbers, and I think they are the result of data constraints. Researchers looking at the post-World War II data generally find that Hong Kong and Singapore have the maximum growth rates, and the public sector in those jurisdictions consumes about 20 percent of economic output. Nations with medium-sized governments, such as Australia and the United States, tend to grow a bit slower. And the bloated welfare states of Europe suffer from stagnation.

So it’s understandable that academics would conclude that growth is at its maximum point when government grabs 20 percent of GDP. But what would the research tell us if there were governments in the data set that consumed 15 percent of economic output? Or 10 percent, or even 5 percent?

Such nations don’t exist today, but it’s worth noting that the western world became rich when the burden of government spending averaged about 10 percent of GDP.

Rahn Curve A-BBut I’m digressing. Let’s get back to the research from the Bank of Finland. The author makes a very sensible point that even modest reductions in the burden of government can yield positive results – sort of like going from Point A to Point B on the Rahn Curve.

Various nations have done this, achieving better economic performance after shrinking government spending relative to the productive sector of the economy.

Here’s the relevant excerpt from the study.

…a revolution is not required to generate one per cent of additional growth each year: the “welfare state” does not need to be eliminated, wages do not need to be lowered to subsistence income levels, and working hours do not need to be increased to medieval levels. In fact, in most instances, significant improvements in economic growth could be produced by simply reverting to the conditions of approximately one decade ago. …by reducing the growth of the public sector and decreasing tax rates, one may increase both the labour supply and the competitiveness of the private sector. The future development of the public sector is indeed the key aspect of determining the future development of the economy. If the public sector can be maintained in a reasonable fashion, one may manage to achieve low tax rates and low tax wedges in labour markets, and one can also avoid fiscal crises and keep the risk premia (of interest rates) low.

These findings should be read by every glum libertarian and every sad conservative. Yes, there are plenty of reasons to be pessimistic about America’s future, particularly since both the Bank for International Settlements and the Organization for Economic Cooperation and Development estimate that America’s long-run fiscal status is even worse than most of Europe’s welfare states.

But it doesn’t actually take much to move policy back in the right direction. A modest bit of fiscal restraint can solve the short-run challenge and some well-crafted entitlement reform can avert the long-run crisis.

All we really need to do is give the private sector some breathing room, which is the point I make in this interview with Larry Kudlow. I was talking about the regulatory burden, but my argument is equally applicable to fiscal policy.

This doesn’t exactly get us to our libertarian Nirvana, of course, so I realize that “breathing room” isn’t the most inspirational motto.

But it should help us understand that the fight isn’t over. I certainly haven’t given up.*

* I reserve the right to defect to the Cayman Islands if the crooks in Washington ever succeed in saddling America with a value-added tax.

Read Full Post »

I’m in Vilnius, Lithuania, where I just finished speaking to a regional conference of the European Students for Liberty.

I subjected the kids to more than 90 minutes of pontificating and 73 PowerPoint slides, but I could have saved them a lot of time if I simply showed them this Rahn Curve video and then posted just one slide – the one showing that the burden of government spending in Europe used to be very small.

This slide shows that government spending used to consume only about 10 percent of European economic output in the 1800s and less than 15 percent of GDP as late as 1913.

I explained to the students that it was during this period of small government that Europe became a rich continent. It was back during this time that most European nations didn’t have income taxes, so there wasn’t big government to misallocate economic output, and there weren’t high tax rates to discourage economic output.

So no wonder Europe went from agricultural poverty to middle class prosperity (and here’s a post where I specifically discuss how Denmark became prosperous when government was small).

To be sure, fiscal policy is not the only variable that determines prosperity, and I gave some big caveats about the importance of good monetary policy, good trade policy, good regulatory policy, etc, etc.

In my conclusion, I offered the students a good news scenario and bad news scenario. The good news is that we know how Europe became rich and we know that a return to small government and free markets will enable Europe to again enjoy rapid growth.

The bad news is that Europe will probably move in the wrong direction rather than right direction. I shared this data from the Bank for International Settlements, showing that even supposedly sober-minded and prudent nations such as Germany and the Netherlands are going to face Greek-Style fiscal crises.

Which is why I was only half-joking during the Q&A session when I suggested that the students stock up on guns and ammo. If and when the continent-wide fiscal crisis occurs (because Europe has poorly designed entitlement programs, just like America), and there’s no Germany or no IMF to provide bailouts, the looters and the moochers are going to switch from being run-of-the-mill rioters and instead become marauding gangs.

In that Mad Max Dystopia, as I explained last year on the NRA’s TV program, the ability to engage in self defense will be highly prized.

Read Full Post »

It seems I was put on the planet to educate people about the negative economic impact of excessive government. Though I must be doing a bad job because the burden of the public sector keeps rising.

But hope springs eternal. To help make the case, I’ve cited research from international bureaucracies such as the Organization for Economic Cooperation and Development, International Monetary Fund, World Bank, and European Central Bank. And since most of those organizations lean to the left, these results should be particularly persuasive.

I’ve also cited the work of academic scholars from all over the world, including the United States, Australia, and Sweden. The evidence is very persuasive that big government is associated with weaker economic performance.

Now we have some new research from the United Kingdom. The Centre for Policy Studies has released a new study, authored by Ryan Bourne and Thomas Oechsle,  examining the relationship between economic growth and the size of the public sector.

The chart compares growth rates for nations with big governments and small governments over the past two decades. The difference is significant, but that’s just the tip of the iceberg. The most important findings of the report are the estimates showing how more spending and more taxes are associated with weaker performance.

Here are some key passages from the study.

Using tax to GDP and spending to GDP ratios as a proxy for size of government, regression analysis can be used to estimate the effect of government size on GDP growth in a set of countries defined as advanced by the IMF between 1965 and 2010. …As supply-side economists would expect, the coefficients on the tax revenue to GDP and government spending to GDP ratios are negative and statistically significant. This suggests that, ceteris paribus, a larger tax burden results in a slower annual growth of real GDP per capita. Though it is unlikely that this effect would be linear (we might expect the effect to be larger for countries with huge tax burdens), the regressions suggest that an increase in the tax revenue to GDP ratio by 10 percentage points will, if the other variables do not change, lead to a decrease in the rate of economic growth per capita by 1.2 percentage points. The result is very similar for government outlays to GDP, where an increase by 10 percentage points is associated with a fall in the economic growth rate of 1.1 percentage points.16 This is in line with other findings in the academic literature. …The two small government economies with the lowest marginal tax rates, Singapore and Hong Kong, were also those which experienced the fastest average real GDP growth.

The folks at CPS also put together a short video to describe the results. It’s very well done, though I’m not a big fan of the argument near then end that faster growth is a good thing because it generates more tax revenue to finance more government. Since I’m a big proponent of the Laffer Curve, I don’t disagree with the premise, but I would argue that additional revenues should be used to finance lower tax rates.

Since I’m nit-picking, I’ll also say that the study should have emphasized that government spending is bad for growth because it inevitably and necessarily leads to the inefficient allocation of resources, and that would be true even if revenues magically floated down from heaven and there was no need for punitive tax rates.

This is my message in this video on the Rahn Curve.

When the issue is government, size matters, and bigger is not better.

Read Full Post »

Almost exactly one year ago, I did a post entitled “A Laffer Curve Tutorial” because I wanted readers to have all the arguments and data in one place (and also because it meant I wouldn’t have to track down all the videos when someone asked me for the full set).

Riders from the fiscal policy short bus

Today, I’m doing the same thing on the issue of government spending. If you watch these four videos, you will know more about the economics of government spending than 99.9 percent of the people in Washington. That’s not a big achievement, to be sure, since you’re being compared to a remedial class, but it’s nonetheless good to have a solid understanding of an issue.

The first video defines the problem, explaining that deficits and debt are bad, but then explaining that red ink is best understood as a symptom of the real problem of too much government spending.

The second video reviews the theoretical reasons why a large public sector undermines prosperity.

The next video examines the empirical evidence, citing both cross-country data and academic research.

Last but not least, the final video looks at the research about the growth-maximizing size of government.

You may have noticed, by the way, that this post does not include any of the videos about Keynesian economics or Obama’s stimulus. That’s an entirely different issue, perhaps best described as being a debate over whether it’s good or bad in the short run to increase the burden of government spending. The videos in this post are about the appropriate size and scope of government in the long run.

This post also does not include the video about fiscal restraint during the Reagan and Clinton years, or the video looking at how nations such as New Zealand and Canada were able to restrain spending. Those are case studies, not economics.

Read Full Post »

I don’t expect a  good outcome to the European fiscal crisis, largely because nobody seems to understand that the real problem is excessive government spending.

The economic illiterates in the press sometimes say the fight in Europe is between austerity and Keynesianism, but that’s not accurate. It’s really a battle between those who think big government should be financed by taxes and those who think big government should be funded by taxes and debt.

And it doesn’t help that the supposedly conservative governments in places such as Spain, Germany, France, and the United Kingdom are run by statists.

The good news is that some people understand the real problem. The bad news is that they generally don’t live in Europe. Writing for the Australian, Professor Judith Sloan cites the Rahn Curve as she explains the need to reduce the size and scope of the public sector.

Here’s some of what she included in her article.

The real question that a number of European and other countries should be asking themselves is this: what should be the role of government in terms of providing an environment for economic prosperity and security? There is absolutely no doubt that the size of the public sector and the intrusion of government have grown to excessive proportions in a number of these countries. A pervading sense of entitlement – on the part of retirees, welfare recipients, parents, university students, public servants and others – has been encouraged by these governments, but now threatens to block reform. …What is required is a complete rethink of the role of government. …According to the Rahn curve, the rate of economic growth initially increases with government spending (as a proportion of gross domestic product). Establishing and funding a quality judicial system, defending a country, ensuring the safety of citizens, funding (but not necessarily providing) some basic services: these are legitimate functions of government. But beyond a certain point (about 20-25 per cent of GDP) long-term economic growth tends to fall as government spending rises. This is the zone – well above 25 per cent in most instances – in which EU countries find themselves. …There are a number of reasons why the size of government really matters. After all, government spending has to be paid for by taxes, and almost all taxes reduce rewards for effort. …Moreover, government spending is often not subject to rigorous cost-benefit analysis in the same way private spending is.

To be fair, some people in Europe understand this issue, including economists at the European Central Bank who recently produced a study finding that, “…using a long time span running from 1970-2008, and employing different proxies for government size… Our results show a significant negative effect of the size of government on growth.”

And Swedish economists also have acknowledged the negative relationship between government spending and economic performance, writing that, “…there is a negative correlation between total government size and growth. It appears fair to say that an increase in total government size of ten percentage points in tax revenue or expenditure as a share of GDP is on average associated with an annual lower growth rate of between one-half and one percentage point.”

But these are lonely voices in Europe.

I’ve also weighed in on the topic from this side of the Atlantic, having produced this paper when I worked at the Heritage Foundation, and I also narrated this video for the Center for Freedom and Prosperity.

Unfortunately, all this research isn’t having much impact. Only the Baltic nations have done the right thing and reduced spending. The Germans also have been semi-responsible in the past couple of year, though that’s not saying much. And the Swiss were smart enough not to go overboard for big government in the first place.

What about the other European countries? Well, even though their economies are falling behind, their governments are going bankrupt, and their societies are becoming unstable, the politicians in the rest of Europe don’t seem to care about all the real-world evidence.

They’re still spending like there’s no tomorrow. I just hope American politicians won’t be foolish enough to provide a bailout when the house of cards comes tumbling down.

Read Full Post »

Last month, I shared a video about bloated bureaucracy from a group called Government Gone Wild.

That generated a big response, so here’s another video from the same group, only this one looks at egregious examples of government waste.

If you like videos on wasteful spending, but prefer a more attractive narrator, click here.

And if you want a video that looks at the economic cost of excessive government spending, watch this mini-documentary on the Rahn Curve.

We’ve reached a point where even economists from the welfare state of Sweden are producing studies showing there’s a negative relationship between government spending and economic performance.

One can only hope this message seeps through the thick skulls of the political class before it’s too late.

Read Full Post »

The President’s “green energy” loan program has turned into an embarrassment for the White House, in part because of the sordid corruption associated with the bankruptcy of Solyndra.

But the subsidy program also has attracted some negative attention for its failure to create jobs – even from media outlets that normally are sympathetic to big government.

Here’s a passage from a story in today’s Washington Post.

A $38.6 billion loan guarantee program that the Obama administration promised would create or save 65,000 jobs has created just a few thousand jobs two years after it began, government records show. The program — designed to jump-start the nation’s clean technology industry by giving energy companies access to low-cost, government-backed loans — has directly created 3,545 new, permanent jobs after giving out almost half the allocated amount, according to Energy Department tallies.

Wow, more than $19 billion lent out, and only 3,545 jobs created.  I’m not a math genius, but that seems to be more than $5 million per job.

But let’s suspend reality and accept the Administration’s nonsensical projections that the full $38.6 billion will lead to more than 60,000 jobs. That still works out to be in the neighborhood of $600,000 per job.

Even using that ultra-optimistic scenario, this certainly seems to be a case of government spending far too much money to achieve a particular goal.

But this analysis is grossly inadequate, and White House critics are understating the argument against the scandal-tainted green energy program.

You don’t measure the job impact of a government program simply by dividing the number of jobs into the amount of money that has been spent. That only gives you part of the answer.

You also have to estimate how many jobs would have been created if the $19 billion (or full $38.6 billion) had been left in the private sector rather than being diverted by the heavy hand of government.

In other words, to paraphrase Bastiat, we want to look not only as the “seen” of government spending, but we also want to look at the “unseen” of how the money otherwise would have been allocated. What modern economists sometimes refer to as the “opportunity cost.”

It is not easy, of course, to estimate the number of jobs that would have been created if the government wasn’t diverting money into a green energy program. Ask 10 economists and you’ll get 15 answers.

But we know these effects are real.

To understand what this means, let’s create a rough-and-ready rule of thumb.

According to Tables B-102 and B-103 of the Federal Reserve’s Flow of Funds report, the combined non-financial capital of non-farm businesses is about $20.7 trillion. And the Labor Department says we have close to 140 million people employed, which means the average amount of capital per job is about $155,000.

You can also take a different approach and look at the non-financial capital of households from Table B-100, which is a bit over $23 trillion. Using that number, the average amount of capital is about $165,000 per job.

In either case, it’s quite obvious that the private sector utilizes capital far more efficiently than government. Instead of using $5 million of capital to create a job, as has been the case so far with the Administration’s green energy program, the private sector requires about $160 thousand.

But let’s not forget that we want to give the White House the benefit of the doubt, so we will use the Administration’s future projection that each job will cost “only” $600,000. That’s still almost four times as much as it costs to create a job in the private sector.

Keeping in mind that good analysis requires us to measure the “seen” and “unseen,” let’s now look at net job creation, which is where the rubber meets the road. The federal government is going to divert $38.6 billion from private capital markets for its green energy program, and the Administration claims this will lead to 60,000-65,000 jobs.

However, based on the existing ratio of non-financial capital to employment, that same $38.6 billion, if left in the productive sector of the economy, would create about 240,000 jobs.

In other words, for every one job “created” by the government, almost four jobs will be foregone. The Obama White House isn’t defending a program that spends a lot of money to create very few jobs. The Administration is defending a program that spends a lot of money and – as a result – reduces total jobs by perhaps 180,000.

P.S. This analysis, by the way, is incomplete. You also should estimate how many jobs might be lost because of secondary economic effects such as the expectation of higher taxes caused by additional red ink. And what about the tertiary effects such as companies and investors responding to big government by inefficiently allocating  resources to lobby for DC handouts.

P.P.S. This analysis applies to all government spending, whether it is for short-run Keynesian stimulus or long-run entitlement programs. The relevant question, from an economic perspective, is whether the government can utilize resources more efficiently and productively than the private sector. Needless to say, there are not many types of government spending that meet this test. This is why the academic research, as explained in this video, shows that we would be much more prosperous if government was much smaller.

P.P.P.S There are any number of ways one can measure the amount of capital per job. Very broad measures, such as total net worth in the economy, would push the number higher, but presumably would overstate the amount of capital needed to create an average job in the private sector. Narrower measures, such as the value of business equipment and structures, would generate a much smaller number, but presumably understate the amount of capital needed to create an average job in the private sector. Or, instead of looking at the stock of capital and the total number of jobs, we could look at incremental flows of capital and incremental employment changes. I don’t pretend that my rule-of-thumb estimate is ideal. The goal is simply to create an example so we can understand why it is important to consider both the “seen” and the “unseen.” And using that approach helps explain why the economy gets weaker as the government gets bigger.

Read Full Post »

The United States has been on a decade-long spending binge. Thanks to the profligate policies of both Bush and Obama, the burden of federal spending has climbed to about 25 percent of economic output, up from 18.2 percent of GDP when Bill Clinton left office.

The political class tells us that more government is good for the economy since it an “investment” and/or a “stimulus.”

The academic research, however, tells a different story. Here are some brief excerpts from a recent study by two Swedish economists, including a critically important observation about the impact of bigger government on economic performance.

…most recent studies typically find a negative correlation between total government size and economic growth. …the most convincing studies are those most recently published. …In general, research has come very close to a consensus that in rich countries there is a negative correlation between total government size and growth. It appears fair to say that an increase in total government size of ten percentage points in tax revenue or expenditure as a share of GDP is on average associated with an annual lower growth rate of between one-half and one percentage point.

Let’s focus on the last sentence of the excerpt and contemplate the implications. The research cited above tells us that annual growth is 0.5 percentage point-1.0 percentage point lower if the burden of government rises by 10 percentage points of GDP. Well, the burden of federal spending has jumped by more than 5 percentage points of GDP during the Bush-Obama years, indicating that annual growth in America is now 0.25 percentage point-0.5 percentage point lower than it otherwise would be.

Now let’s take the best-case scenario, and assume that annual growth has only dropped by 0.25 percentage points, and consider what that means. It may not sound like much, but even small differences in growth rates become very important over time. For an average household over a 25-year period, the loss of 0.25 percentage points of growth means annual income will rise, but the total increase will be about $5,000 smaller by the 25th year.

The budgetary implications of growth also are rather important. According to the Congressional Budget Office, the economy’s performance has a large impact on tax receipts (more growth means higher incomes and more taxpayers) and a small effect on government spending (more growth means fewer people at the public trough). CBO even publishes a “sensitivity table” with specific estimates (Table B-1).

If we once again use the best-case scenario and assume the Bush-Obama spending binge has reduced annual growth by only 0.25 percentage points, the CBO numbers show this means more than $750 billion of additional red ink. This is something to keep in mind as the White House argues that job-killing class-warfare tax hikes will somehow improve the budget situation.

Let’s now return to the academic research. The authors included a very helpful table showing the results of recent studies on the relationship between the size of government and economic performance. Click on the image for a full-size look at how the majority of scholarly research this century confirms that big government is bad for prosperity.

For all intents and purposes, all this research shows that developed nations are on the downward-sloping portion of the Rahn Curve. Named after my Cato colleague Richard Rahn and explained in the video below, the Rahn Curve is sort of a spending version of the Laffer Curve.

Richard Rahn

It shows that growth is maximized by small governments that focus on core “public goods” like rule of law and protection of property rights. But when governments expand beyond a certain growth-maximizing level (the research says about 20 percent of GDP, by I explain in the video why the right number is probably much smaller), the result is slower growth and less prosperity.

With the exception of high-growth Hong Kong and Singapore, all developed nation have public sectors that consume at least 30 percent of economic output. This means that government spending is undermining prosperity all around the world. And since the burden of government spending is close to 40 percent of GDP in the United States…well, you can fill in the blanks.

Read Full Post »

Since it is tax-filing season and we all want to honor our wonderful tax system, let’s go into the archives and show this video from last year about the onerous compliance costs of the internal revenue code.

The mini-documentary explains how needless complexity creates an added burden – sort of like a hidden tax that we pay for the supposed privilege of paying taxes.

Two things from the video are worth highlighting.

First, we should make sure to put most of the blame on Congress. The IRS is in the unenviable position of trying to enforce Byzantine tax laws. Yes, there are examples of grotesque IRS abuse, but even the most angelic group of bureaucrats would have a hard time overseeing 70,000-plus pages of laws and regulations (by contrast, the Hong Kong flat tax, which has been in place for more than 60 years, requires less than 200 pages).

Second, we should remember that compliance costs are just the tip of the iceberg. The video also briefly mentions three other costs.

1. The money we send to Washington, which is a direct cost to our pocketbooks and also an indirect cost since the money often is used to finance counterproductive programs that further damage the economy.

2. The budgetary burden of the IRS, which is a staggering $12.5 billion. This is the money we spend to employ an army of tax bureaucrats that is larger than the CIA and FBI combined.

3. The economic burden of the tax system, which measures the lost economic output from a tax system that penalizes productive behavior.

The way to fix this mess, needless to say, is to junk the entire tax code and start all over.

I’ve been a big proponent of the flat tax, which would mean one low tax rate, no double taxation of savings, and no corrupt loopholes. But I’m also a big fan of national sales tax proposals such as the Fair Tax, assuming we can amend the Constitution so that greedy politicians don’t pull a bait and switch and impose both an income tax and a sales tax.

But the most important thing we need to understand is that bloated government is our main problem. If we had a limited federal government, as our Founding Fathers envisioned, it would be almost impossible to have a bad tax system. But if we continue to move in the direction of becoming a European-style welfare state, it will be impossible to have a good tax system.

Read Full Post »

David Ignatius has a thoroughly boring and utterly predictable establishment left-wing column in the Washington post, but it is a perfect illustration of my maxim that “Bad government policy begets bad government policy.” In this case, Ignatius wants to expand gun control in the United States in response to the foolhardy drug war in Mexico. Neither effort will succeed, at least if either society wants even a smidgen of individual liberty, but statists never seen to worry about such niceties. If one of their policies leads to a mess, that’s just an excuse for more bad policy.

Mexico is reeling from a drug-cartel insurgency that is armed mainly with weapons acquired in the United States… Naming a new ATF chief to lead the fight against illegal weapons would be a small symbolic step. But it would signal to Mexicans and Arizonans alike that the administration is mobilizing to deal with these problems — and is willing to take some political heat in the process. …”The absence of a chief has hamstrung ATF’s ability to aggressively target gun trafficking rings or corrupt firearms dealers and has demoralized its agents,” Paul Helmke, president of the Brady Campaign to Prevent Gun Violence, wrote in a June 10 letter to Obama. …The prevailing political wisdom in America, to which the Obama administration evidently subscribes, is that it’s folly to challenge the gun lobby. When Mexico’s President Felipe Calderón addressed a joint session of Congress in May, he all but pleaded with lawmakers to help stop the flow of assault weapons. His call to action produced little more than a shrug of the shoulders in Washington.

By the way, several of you have been ribbing me for calling this phenomenon Mitchell’s Law when great economists like Mises have written about this pattern. But I’m not saying that I invented the concept. I’m just trying to popularize it, much as I gave the name “Rahn Curve” to the theory about a growth-maximizing level of government. In effect, I’m trying to mimic Art Laffer. Art will freely tell anyone he meets that the concept behind the Laffer Curve existed for centuries. But he turned in into a curve and brought it to the attention of the world.

Read Full Post »

I’m used to being attacked, but usually by statists. In a man-bites-dog development, here’s a 12-1/2-minute video dedicated to the proposition that I was hopelessly squishy in my Rahn Curve video.

What makes this situation rather ironic is that I agree with the guy tearing me a new you-know-what.

But this is also my defense. At the risk of oversimplifying, his critiques fall into two categories.

One category could be called sins of omission. To cite an example, he correctly points out that the growth-maximizing level of government may or may not be accurate, depending on how the money is being spent. For instance, if government only consumes 5 percent of GDP, but spends that money on law enforcement, that might be good (the video also notes, quite accurately, that law enforcement can be bad if the police are enforcing oppressive policies). If that modest level of government is devoted to welfare, by contrast, that would be bad. At the risk of stating the obvious (or at least what I hope everybody who reads this blog has already figured out), I obviously agree. But when I put together these videos, all sorts of simplifying assumptions must be made to keep them to a reasonable length. In many instances, the final video only includes about one-half of what was in the original script. So I plead guilty of not fully elaborating, but I limit details because I think too much information would undermine my goal of reaching people who are not already true believers.

The other category could be called bad assumptions, and here’s where I would argue that my critic is being a bit unfair. My main example is that he implies that I support a government that consumes 20 percent of GDP. Yet I think a careful viewer would agree that all I’m saying is that the existing academic research identifies this level of government spending as being consistent with maximum growth. But the last part of the video is my (hopefully compelling) argument that the actual growth-maximizing level of government spending is much lower than 20 percent of economic output.

That being said, it is always a good idea to be suspicious about anybody from Washington. I haven’t sold out yet, but that certainly happens quite often in Washington. So I welcome readers to pick through my blog posts with a fine-toothed comb.

Read Full Post »

Please share this video with everyone you know. It explains the “Rahn Curve,” which is a spending version of the Laffer Curve. Named after Cato Institute’s Richard Rahn, the Curve shows that modest amounts of government spending – for core “public goods” such as rule of law and protection of property rights – is associated with better economic performance.

But when government rises above that level (as it has in all developed nations), then more government is associated with slower growth.

Read Full Post »