Feeds:
Posts
Comments

Posts Tagged ‘Productivity’

In early September, I wrote about how capital and labor are both necessary to create prosperity.

Economists sometimes explain this with lots of jargon, referring to capital and labor as “factors of production” and pointing out how they are “complementary.”

In ordinary English, this simply means that workers earn more income when they are equipped with better machinery, equipment, and technology. Similarly, investors can only generate earnings if they have people to utilize capital.

This doesn’t mean that there’s a happy relationship between labor and capital. Indeed, there’s a constant tug or war over who gets what slice of the economic pie.

That being said, the relationship tends to be reasonably cordial so long as the pie is growing.

According to some folks on the left, though, that’s not the case. From their perspective, workers get screwed and capitalists grab ever-larger slices. Consider, for example, this tweet from @existentialcoms.

This tweet made a big splash, with nearly 30,000 likes and more than 12,500 re-tweets.

But there was a slight problem. Actually, a big problem.

There was a counter-tweet from @ne0liberal featuring three graphs that demolish the core premise of the tweet from @existentialcoms.

Here are the three graphs that @ne0liberal shared.

The first one confirms that workers enjoy far more leisure time than in the past.

The second one uses current data to show that more productive workers have much more leisure time.

And the third one reveals that worker compensation has increased significantly.

The unambiguous conclusion is that capitalism produces very good outcomes for workers. If @existentialcoms and @ne0liberal were in a boxing match, this would be a first-round knockout.

My modest contribution to this discussion is to point out that there are no real-world examples of good results produced by socialism. Or Marxism. Or fascism. Or by any form of statism.

Yes, there are some rich nations with big welfare states, but they only imposed those policies after they became rich.

Which is why I’m still waiting for any of my friends on the left to successfully respond to this challenge.

P.S. Since I’ve decided that @ne0liberal produced the counter-tweet of the year, I may as well also call attention to the best-ever tweet about capitalism and socialism, the world’s most-depressing tweet, and Trump’s worst-ever tweet.

Read Full Post »

I’ve periodically explained that capital formation (more machines, technology, etc) is necessary if we want higher wages.

Simply stated, workers get paid on the basis of what they produce and the most effective way of boosting productivity is to have more saving and investment.

This is (one of the reasons) why I have so much disdain for politicians who try to foment discord and division between workers and capitalists.

To be sure, there will always be a tug of war between investors and employees over which group gets bigger or smaller slices. But so long as we have the right policies, they’ll be bickering over how to divide an ever-growing pie.

That’s a nice problem to have. Especially compared to what happens when politicians intervene – for the ostensible purpose of helping workers – and adopt policies that create economic stagnation.

Think Greece or Venezuela.

Larry Reed of the Foundation for Economic Education wrote with great insight about the link between labor and capital a few years ago. He starts with some basic economics.

…as complementary factors of production, labor and capital are not only indispensable but hugely dependent upon each other as well. Capital without labor means machines with no operators, or financial resources without the manpower to invest in. Labor without capital looks like Haiti or North Korea: plenty of people working but doing it with sticks instead of bulldozers, or starting a small enterprise with pocket change instead of a bank loan. …There may be no place in the world where there’s a shortage of labor but every inch of the planet is short of capital. There is no worker who couldn’t become more productive and better himself and society in the process if he had a more powerful labor-saving machine or a little more venture funding behind him. It ought to be abundantly clear that the vast improvement in standards of living over the past century is not explained by physical labor (we actually do less of that), but rather to the application of capital.

He concludes that we should be celebrating Labor Day and Capital Day.

I’m not “taking sides” between labor and capital. I don’t see them as natural antagonists in spite of some people’s attempts to make them so. Don’t think of capital as something possessed and deployed only by bankers, the college-educated, the rich, or the elite. We workers of all income levels are “capital-ists” too—every time we save and invest, buy a share of stock, fix a machine, or start a business. …I’ve traditionally celebrated labor on Labor Day weekend—not organized labor or compulsory labor unions, mind you, but the noble act of physical labor to produce the things we want and need. …on Labor Day weekend, I’ll also be thinking about the remarkable achievements of inventors of labor-saving devices, the risk-taking venture capitalists who put their own money (not your tax money) on the line and the fact that nobody in America has to dig a ditch with a spoon or cut his lawn with a knife. …Labor Day and Capital Day. I know of no good reason why we should have just one and not the other.

Courtesy of Mark Perry at the American Enterprise Institute, here’s a nice depiction of how labor and capital are interdependent.

P.S. When economists write about the relationship between capital and labor (savings => investment => productivity => wages), some critics assert this is nothing other than “trickle-down economics.”

Yet this is the mechanism for growth under every economic theory – even Marxism and socialism. The only thing that changes under those approaches is that politicians and bureaucrats control investment decisions. And we know that doesn’t work very well.

Read Full Post »

Some economic statistics are very important in the world of politics.

When President Obama’s so-called stimulus was in effect, critics (including me) kept pointing to higher-than-predicted unemployment rates. President Trump, meanwhile, mistakenly thinks America somehow is losing because of the trade deficit. And the GDP numbers are the subject of considerable discussion on all sides.

Another very important piece of data is wage growth, especially since Trump wants to claim his policies are generating big results. I take a jaundiced view on such claims, but the issue is very important, so let’s take a look at two interesting columns.

Michael Strain of the American Enterprise Institute, writing for Bloomberg, starts by noting that some folks on the left think workers are being screwed.

Are wages determined by market forces, or do businesses get to decide what pay they offer to workers? …Why has wage growth been so sluggish for so many years? …you might answer that employers have made the decision to boost profits at the expense of raising wages. …it is common to hear some prominent analysts and organizations on the left argue that the link between wages and productivity for most workers has effectively been severed.

Not so fast, he writes.

Businesses don’t pay employees less than the value of their productivity — the amount of revenue workers generate for their employer — because doing so would result in their workers taking another job where they would get paid what they’re worth. In this sense, employers don’t “decide” what wages they pay. Instead, wages are set in markets. …worker productivity remains the dominant force in setting wages. …Market forces are powerful. A recent paper by economists Anna M. Stansbury and Lawrence H. Summers of Harvard confirms this. They find that over the last four decades, a one-percentage-point increase in productivity growth is associated with a 0.73 percentage point increase in the growth rate of median compensation. That’s a strong link.

I have two thoughts on this. First, productivity is the key to our prosperity. I’m in full agreement with Paul Krugman’s observation that, “Productivity isn’t everything, but in the long run it is almost everything.”

Second, as illustrated by this chart, we get more productivity with greater levels of investment.

The problem is that government often undermines productivity growth.

Governments have thrown a wrench in the market machine through the absurd proliferation of occupational licenses, reducing wages for workers who can’t get a license and restricting the mobility of licensed workers. A recent study finds that the rate of migration across state lines for individuals in occupations with state-specific licensing requirements is over one-third lower than among individuals in occupations that don’t have such rules.

Amen.

And there are plenty of additional policies that have a negative effect as well.

In a column for the Wall Street Journal, David Henderson says the data on wage growth tell an incomplete story.

Standard wage data show that between the spring of 2017 and the spring of 2018, real wages in the U.S. increased only 0.1%. But there are three major problems with these data. First, they don’t account for fringe benefits, which are an increasing proportion of employee pay. Second, standard wage data use an index that overstates the inflation rate. Third, each year the composition of the workforce changes, as older, higher-paid workers retire and young, lower-paid workers enter the workforce.

He digs into some of the data that have been shared by the CEA.

…the White House Council of Economic Advisers addresses these three biases and concludes that real wages grew by 1% in 2017-18, not the measly 0.1% reported in the wage data. …including benefits would add 0.2 percentage point to the 2017-18 figure. …An alternate measure of inflation, the personal- consumption-expenditures price index, while also imperfect, is a better measure of inflation. Economists at the Federal Reserve prefer the PCEPI to the CPI. Using the PCEPI adds 0.5 percentage point to the 2017-18 growth of real wages. …The Census Bureau estimates that 3.57 million people turned 65 in 2017, compared with 2.68 million in 2010. Taking account of the decline in older, higher-paid workers and the increase in younger, lower-paid workers, the CEA estimates that this “composition factor” added 0.3 percentage point to real wage growth from 2017-18.

I have two thoughts about this data.

First, I don’t pretend to know the ideal measure to capture inflation, but I definitely know that we’d have lower prices in the absence of government intervention.

Second, the CEA definitely is right about fringe benefits being an ever-larger share of total compensation (mostly driven by government intervention).

And these observations apply, regardless of who’s in the White House.

This is not a partisan point. The same methodology would show that real wages grew more than was reported during much of President Obama’s time in office. …there is, in this context, one relevant difference between the Trump and Obama administrations: the 2017 tax cut. Real after-tax wages increased 1.4% between 2017 and 2018, according to the CEA study.

I obviously like the part about tax cuts being helpful, but I’ll reiterate my concern that this effect will evaporate if GOPers don’t get serious about spending restraint.

And I’ll close with the essential observation that there is no substitute for across-the-board pro-market policies if the goal is improving people’s lives.

Read Full Post »

The most common arguments for reducing the 35 percent federal tax on corporate income usually revolve around the fact that having the developed world’s highest tax rate on business undermines competitiveness and reduces investment in America.

And all of that is true. But we should never lose sight of the fact that the corporate income tax is merely a collection device. Businesses may pay the tax, but the real burden is borne by people.

  • Shareholders (investors) receive lower dividends.
  • Consumers pay more for goods and services.
  • Workers receive lower levels of compensation.

Politicians don’t really care about investors since some shareholders are rich, but they definitely pay lip service to the notion that they are on the side of consumers and workers.

So I think this new study from German scholars is worth sharing because it measures the effect of corporate taxation on wages. Here are some of the highlights.

In this paper, we revisit the question of the incidence of corporate taxes on wages both theoretically and empirically. …we exploit the specific institutional setting of the German local business tax (LBT) to identify the corporate tax incidence on wages. …we test the theoretical predictions using administrative panel data on German municipalities from 1993 to 2012. Germany is well suited to test our theoretical model for several reasons. First, we have substantial tax variation at the local level. From 1993 to 2012, on average 12.4% of municipalities adjusted their LBT rates per year. Eventually, we exploit 17,999 tax changes in 10,001 municipalities between 1993 to 2012 for identification. …Moreover, the municipal autonomy in setting tax rates allows us to treat municipalities as many small open economies within the highly integrated German national economy – with substantial mobility of capital, labor and goods across municipal borders.

And here are the key results. There’s a good bit of economic jargon, so the main takeaway is that 43 percent of the corporate tax is borne by workers.

For our baseline estimate, we focus on firms that are liable to the LBT. Figure 2 depicts the results. Pre-reform trends are flat and not statistically different from zero. After a change in the municipal business tax rate in period 0 (indicated by the vertical red line), real wages start to decline and are 0.047 log points below the pre-reform year five years after the reform. The coefficient corresponds to a wage elasticity with respect to the LBT rate of 0.14. …this central estimate implies that a 1-euro increase in the tax bill leads to a 0.56-euro decrease in the wage bill. …we have to rely on estimates from the literature to quantify the total incidence on labor. If we assume a marginal deadweight loss of corporate taxation of 29% as suggested by Devereux et al. (2014), 43% of the total tax burden is borne by workers. This finding is comparable to other studies analyzing the corporate tax incidence on wages (Arulampalam et al., 2012; Liu and Altshuler, 2013; Su´arez Serrato and Zidar, 2014). …We find that part of the tax burden is borne by low-skilled workers. …the view that the corporate income tax primarily falls on firm owners is rejected by our analysis.

For what it’s worth, I use a different approach when trying to explain the impact of the corporate income tax.

I state that shareholders pay 100 percent of the corporate income tax when looking at the direct (or first-order) effect.

However, since shareholders respond to this tax by investing less money in businesses, that means productivity won’t grow as fast, and this translates into lower wages for workers (compared to how fast they would have grown if the tax was lower or didn’t exist). This is the indirect (or second-order) effect of corporate taxation, and it’s akin to the “deadweight loss” discussed in the aforementioned study.

And this is also the approach that can be used to calculate the damage to consumers.

For today, though, the moral of the story is very simple. A high corporate tax rate is bad for growth and competitiveness, but one of the main effects is that workers wind up earning less income. So when the class-warfare crowd takes aim at “rich corporations,” there’s a lot of collateral damage on ordinary people.

P.S. For more information, here’s a video from the Center for Freedom and Prosperity that describes some of the warts associated with the corporate income tax.

P.P.S. There’s lots of evidence – including some from leftist international bureaucracies – that a lower corporate tax rate won’t mean less tax revenue.

Read Full Post »

Here’s a simple and fundamental question: What is economic growth?

And here’s a simple answer: It’s when there’s more national income.

That’s seems like a trivial tautology, but let’s explore some implications. When you dig into the numbers, it turns out that increases in national income (usually measured by gross domestic product, though I prefer gross domestic income) are driven by two factors.

  • More people.
  • More output per hour, also known as increased productivity.

This is why people sometimes say that GDP growth is a function of population growth plus productivity growth.

And what really matters, at least if we want higher living standards, is to have more output per hour. As a result, we should be very concerned that productivity growth seems to be lagging in the United States.

Here’s a chart that was created by the Wall Street Journal, showing data from the Labor Department on productivity all the way back to the 1950s.

And here’s what I wrote about these numbers in a column for the Hill, starting with the observation that productivity growth is very important for long-run prosperity.

…one thing that presumably unites economists is that we all recognize higher productivity is a good thing. It’s what enables higher wages for workers, higher earnings for companies and higher living standards for the nation.

I then point out that we have a problem.

…when we see weak productivity numbers, that’s not good news. …there is a very worrisome trend this century. Productivity is increasing, but at ever-lower rates, which helps to explain why the overall rate of economic growth this century has lagged compared to the post-World War II average.

But I also share suggestions for policy reforms that would lead to higher productivity.

…tax reform could be…beneficial. …a lower corporate tax rate…a key reason…is that investors will have a bigger incentive to finance new projects that will boost productivity and thus boost wages. …to replace “depreciation” with “expensing” would be particularly helpful since the current approach imposes an unwarranted tax on new investments.

The column explains why it’s foolish to impose tax penalties on income that is saved and invested. Policies such as the capital gains tax and death tax punish capital formation and thus reduce productivity growth.

Politicians impose these levies to go after “the rich,” but it’s the rest of us who suffer because of slower growth.

But my column doesn’t just focus on investments in “physical capital.” I also argue that our current education system does a very poor job of boosting “human capital.”

The United States spends more on education — on a per-pupil basis — than other nations. Yet, international test scores show that we get very mediocre results. We see a similar pattern inside the country, with high levels of spending associated with more bureaucracy rather than better outcomes. …it’s time to unleash the power of markets by allowing greater school choice. There’s certainly plenty of evidence that this approach will be more effective.

I closed the column by noting that productivity growth increased under both Ronald Reagan and Bill Clinton when the United States was moving in the direction of free markets Conversely, I also noted that productivity growth has declined under the government-centric policies of George W. Bush and Barack Obama.

Seems like the lesson should be obvious.

P.S. I looked at this same issue back in 2012 when writing about the recipe for increased prosperity. I pointed out that capital and labor are the two factors of production and explained that a bigger economy is a function of more labor, more capital, and/or the more efficient use of labor and capital. Well, another way of saying “more efficient use” is to say “higher productivity.”

After all, it’s much better to have a bigger economy because we’re more productive rather than because we all take a second job on the weekends.

P.P.S. For those who want to get deeper in the economic weeds, this column on China includes a discussion of potential production and this column on Hong Kong includes two great videos on growth from Marginal Revolution University.

Read Full Post »

James Pethokoukis of the American Enterprise Institute has an intriguing idea. Instead of a regular debate, he would like presidential candidates to respond to a handful of charts from the recent Economic Report of the President that supposedly highlight very important issues.

We’d quickly find out — I hope — who has real deep knowledge on key economic issues and challenges facing America.

I don’t always agree with Pethokoukis’ views (see here, here, and here), but he has a very good idea. He may not have picked the charts I would rank as most important, but I think 5 of the 6 charts he shared are worthy of discussion (I’m not persuaded that the one about government R&D spending has much meaning).

Let’s look at them and elaborate on why they are important.

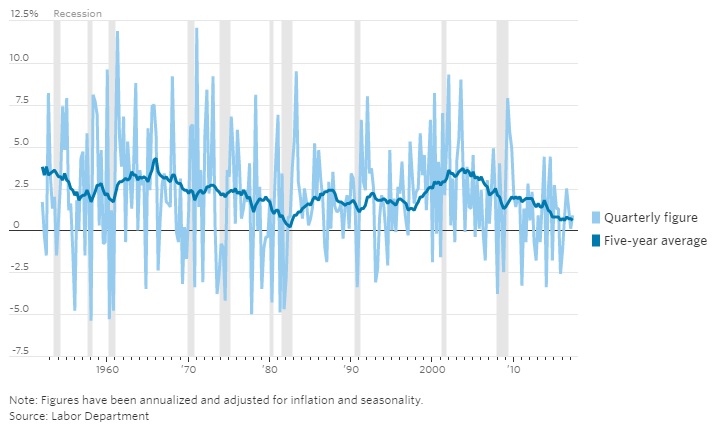
We’ll start with the chart of labor productivity growth, which has been declining over time.

I think this is a very important chart since productivity growth is a good proxy for the growth in living standards (workers, especially in the long run, get paid on the basis of what they produce).

So what should we think about the depressing trend of declining productivity numbers?

First, some of it is unavoidable. The United States has an advanced economy and we don’t have a lot of “low-hanging fruit” to exploit. Simply stated, it’s much easier to boost labor productivity in a poor country.

Second, to the degree we want to boost labor productivity, more investment is the best option. That’s why I’m so critical of class-warfare policies that penalize capital formation. When politicians go after the “evil” and “bad” rich people who save and invest, workers wind up being victimized because there’s less saving and investment.

But this isn’t just an issue of machines, equipment, and technology. We also should consider human capital, which is why it is a horrible scandal that America spends more on education – on a per-capita basis – than any other nation, yet we get very mediocre results because of a government monopoly school system that – at least in practice – seems designed to protect the privileges of teacher unions.

The next chart looks at the number of companies entering and exiting the economy. As you can see, the number of businesses that are disappearing is relatively stable, but there’s been a disturbing decline in the rate of new-company formation.

As with the first chart, some of this may simply be an inevitable trend. In a mature economy, perhaps the rate of entrepreneurship declines?

But that’s not intuitively obvious, and I certainly haven’t seen any evidence to suggest why that should be the case.

So this chart presumably isn’t good news.

Some of the bad news is probably because of bad government policy (capital gains taxes, regulatory barriers, licensing mandates, etc) and some of it may reflect undesirable cultural trends (less entrepreneurship, more risk-aversion, more dependency).

Speaking of which, the next chart looks at the share of the workforce that is regulated by licensing laws.

This is a very disturbing trend.

Licensing rules basically act as government-created barriers to entry and they are especially harmful to poor people who often lack the time and money to jump through the hoops necessary to get some sort of government-mandated certification.

By the way, this is one area where the federal government is not the problem. These are mostly restrictions imposed by state governments.

The next chart looks at how much money is earned by the rich in each country.

I think this chart is very important, but only in the sense that any intelligent candidate should know enough to say that it’s almost completely irrelevant and misleading.

The economy is not a fixed pie. Income earned by the “rich” is not at the expense of the rest of us (assuming honest markets rather than government cronyism). It doesn’t matter if the rich are earning more money. What matters is whether there’s growth and mobility for people on the lower rungs of the economic ladder.

A good candidate should say the chart should be replaced by far more important variables, such as what’s happening to median household income.

Lastly, here’s a chart comparing construction costs with housing prices.

This data is important because you might expect there to be a close link between construction costs and home prices, yet that hasn’t been the case in recent years.

There may be perfectly reasonable explanations for the lack of a link (increased demand and/or changing demographics, for instance).

But in all likelihood, there may be some undesirable reasons for this data, such as Fannie-Freddie subsidies and restrictionist zoning policies.

As with the licensing chart, this is an area where the federal government doesn’t deserve all the blame. Bad zoning policies exist because local governments are catering to the desires of existing property owners.

By the way, while I think Pethokoukis shared some worthwhile charts, I would have augmented his list with charts on the rising burden of government spending, the tax code’s discrimination against income that is saved and invested, declining labor-force participation, changes in economic freedom, and the ever-expanding regulatory burden.

If candidates didn’t understand those charts and/or didn’t offer good solutions, they would be disqualifying themselves (at least for voters who want a better future).

Read Full Post »