There’s endless “spin” in over-politicized and self-serving Washington, with Democrats and Republicans both trying to convince people why any particular bit of economic data is either wonderful news or horrible news.
Since I care about policy rather than politics, I like to think I’m largely immune from this tendency. I criticize either Republicans or Democrats when they do something wrong, and I also offer praise when either Republicans or Democrats do something right.
That applies to Trump, of course.
For instance, the Department of Labor just released new numbers on the job market and Trump loyalists are bragging that this is additional confirmation that the president has steered the economy into glorious prosperity after the supposed wretched misery of the Obama years.
Is that true?
Well, here’s a chart showing total employment in the United States, taken directly from the Bureau of Labor Statistics. We see that jobs have been increasing, but can anybody identify a change in the trend line when Trump took office in January 2017?
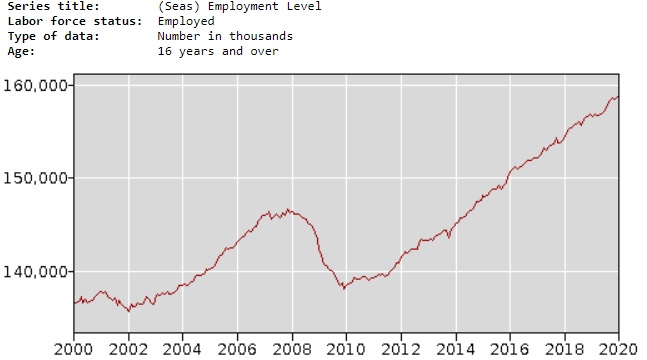
For what it’s worth, the average monthly increase in employment has actually been smaller under Trump than it was under Obama.
Though Brian Riedl of the Manhattan Institute correctly observes that it’s harder to get more jobs when the unemployment rate is low.
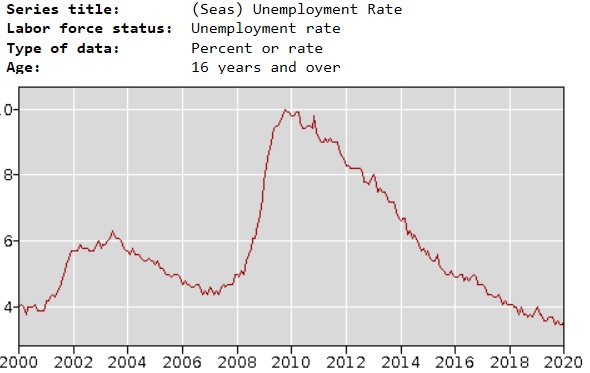
Now that we’ve looked at total employment, let’s examine the BLS numbers for the unemployment rate.
Yes, we see better numbers during the Trump years, but we’ve been getting better numbers ever since 2010.
Can anyone look at this data and make a compelling case that there was some big change starting in 2017?
Next we have the BLS chart showing the employment-population ratio, which measures the share of the adult population which is actually employed (a key factor since economic output is a function of the quantity and quality of both labor and capital).
Notice, once again, that there’s no obvious change in the trend line when Trump took over from Obama.
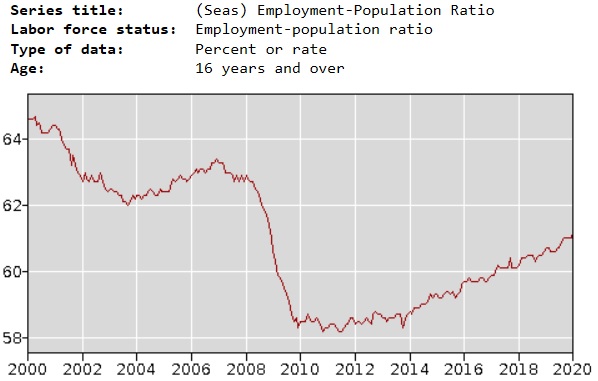
It’s not good news, by the way, that the employment-population ratio is still below where it was before the 2008 crisis.
Though it’s worth noting that the employment-population numbers look much better if they’re adjusted for demographic change.
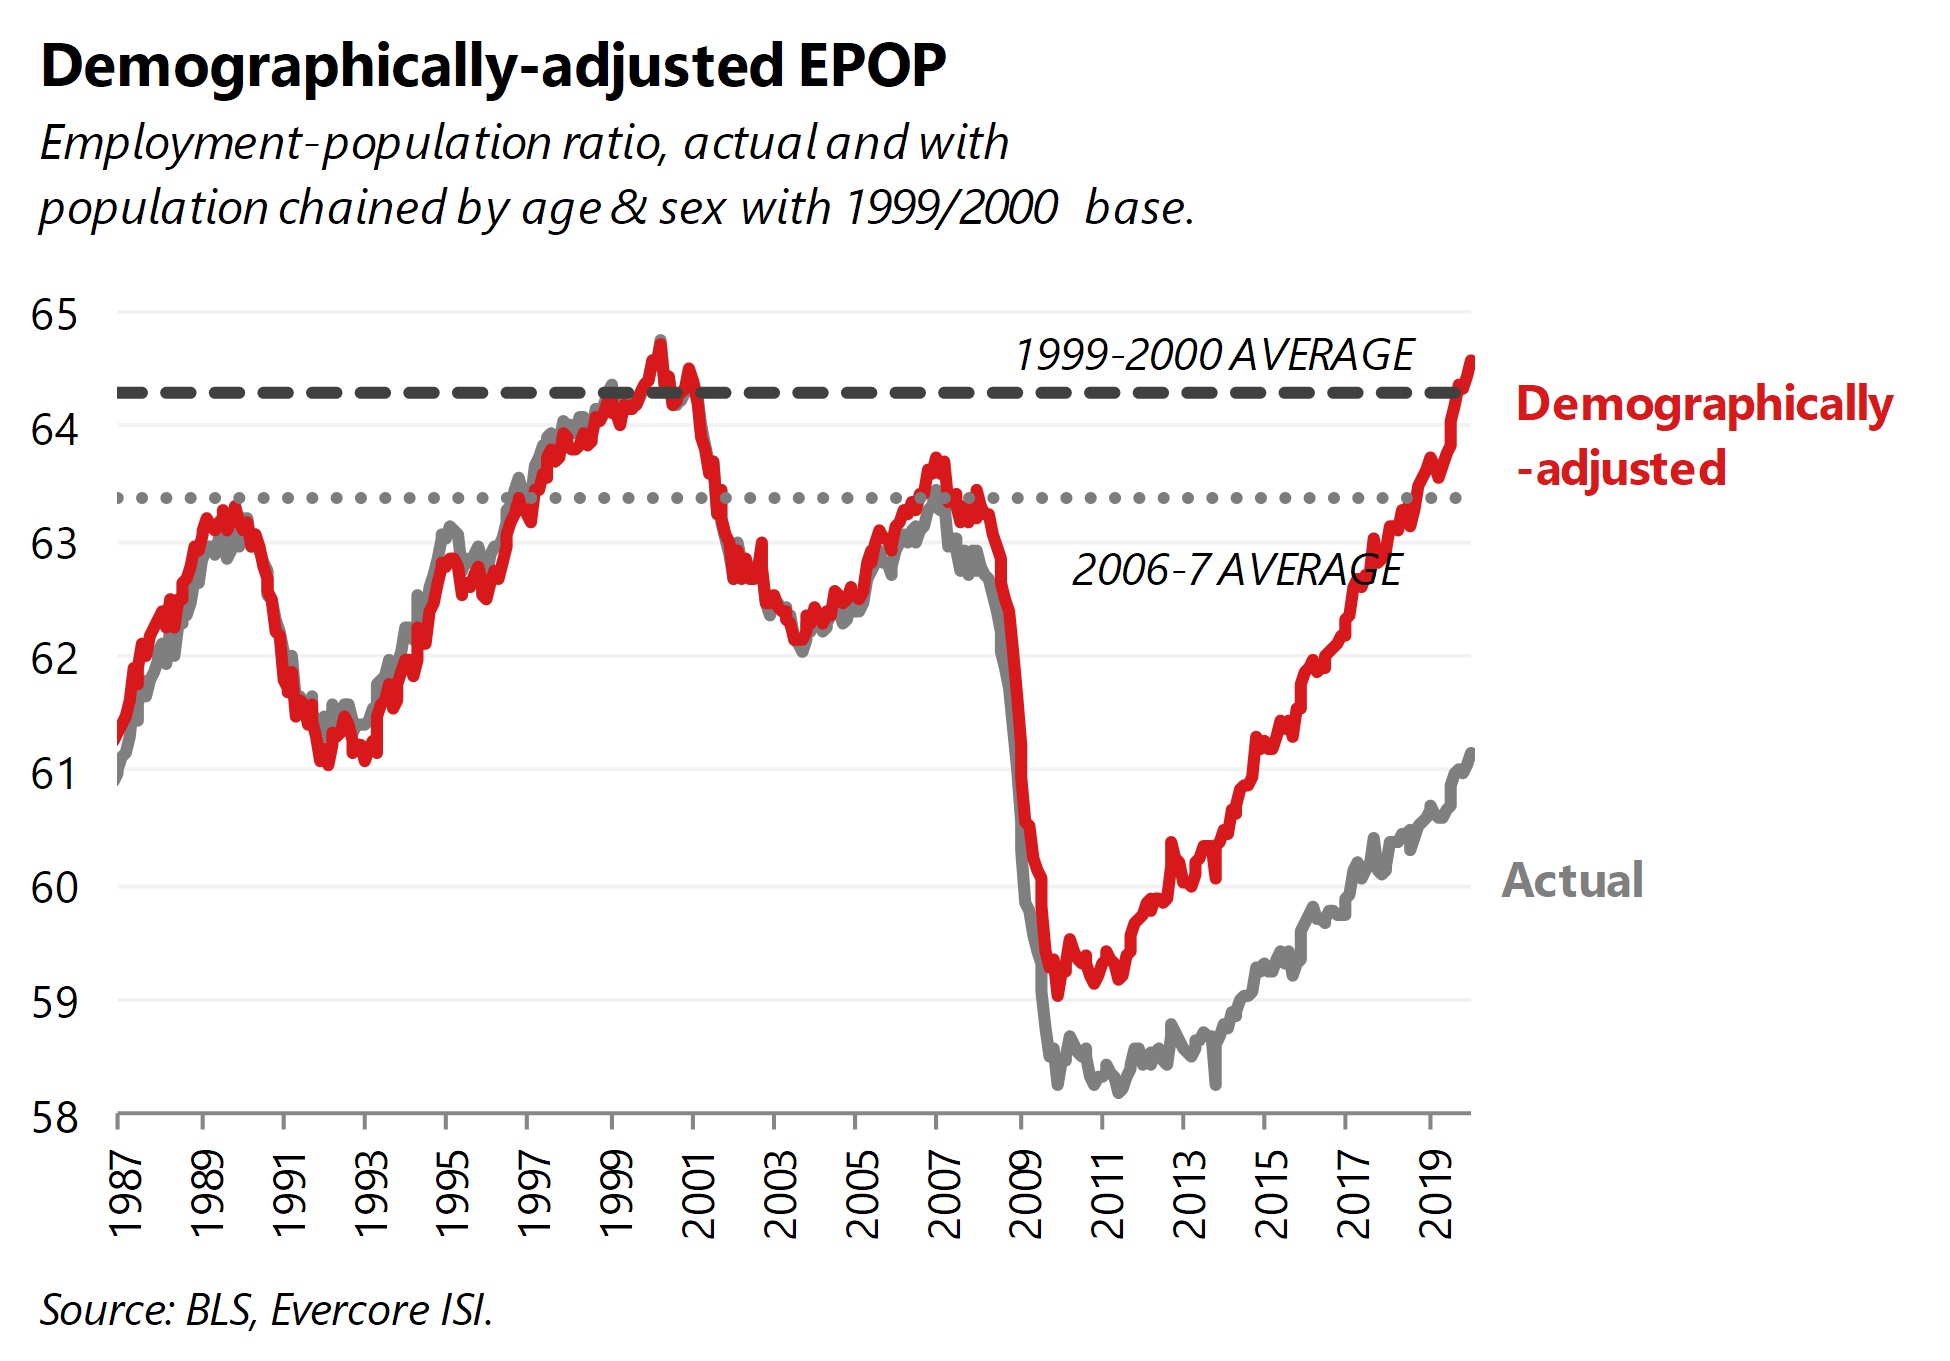
But adjusting the numbers for demographic change doesn’t have any impact on the point I’m making today. Notice that there hasn’t been any obvious change in the trend since Trump got to the White House.
So why do I keep making the point that the trend hasn’t changed?
Because I want people to understand that policy matters, not partisan affiliation. And the bottom line is that the trend line hasn’t noticeably changed because Trump hasn’t noticeably changed the overall level of economic freedom compared to Obama.
Yes, Trump has moved policy in the right direction on some issues (taxes and regulation), but he’s also moved policy in the wrong direction on other issues (trade and spending). Simply stated, his bad policies are offsetting his good policies.
Obama moved policy in the wrong direction, of course, but that was largely during his first two years. There was a policy stalemate his final six years.
And in terms of overall economic liberty, the post-2010 policy stalemate under Obama produced similar scores to the zig-zag policy we’re getting under Trump. So we shouldn’t be surprised that the trend lines are so similar.

[…] Which is certainly a legitimate argument, though honest journalists would have cited some people making the counter argument that his policies did make a difference (for what it’s worth, I think it’s a combination of both). […]
[…] Which is certainly a legitimate argument, though honest journalists would have cited some people making the counter argument that his policies did make a difference (for what it’s worth, I think it’s a combination of both). […]
Alternate Unemployment Charts
http://www.shadowstats.com/alternate_data/unemployment-charts
Whatever demo adjustment means, how come it makes almost no difference for pre-2009 data while for later points it grows by a lot?
I’m pretty much in agreement. But my eyes keep going back to that Gene Sperling tweet above, emphasizing the difference between job creation rates, 227K vs. 191K. Whether that’s a significant difference is a testable hypothesis, isn’t it? (And if it’s not a testable hypothesis, should Sperling have made it?)
Just a general comment in response to all the comments about technical details and data accuracy. The biggest change in the 2017 tax reform was lowering the corporate tax rate. That should encourage business investment, which may lead to more jobs, but maybe not for a few years. Meaning the jury is still out on the 2017 reform. Measuring employment in 2018 by any methodology may not be an appropriate measure of success.
I love data and try to use it whenever possible, but we need to understand it’s usually flawed or incomplete in some way. Besides that, there are so many moving parts in the economy that can boost the expected outcome OR offset it. Therefore, I think it’s just as important, or more important, to understand the logical rationale WHY things happen. It is quite possible for a logical rationale to be true even if the data don’t show it it to be true. This is why basic understanding of economic principles is so important.
bluecat57,
Re: “1. The PRESIDENT does NOT have the AUTHORITY for ‘spending’.”
The president has the power to veto bad spending bills. President Trump has not vetoed any spending bills. If Trump vetoed bad spending bills and Congress overrode his vetos, Trump would be off the hook for contributing to the explosion of debt and reckless spending. Unfortunately Trump is working in cahoots with Congress to turn the US into Greece.
By the way, shouting (uppercase words) detracts from your arguments.
Good point on the BLS revising its employment numbers. As for the “statistical significance” bit, I fed the BLS data to an online calculator (https://www.socscistatistics.com/tests/studentttest/default2.aspx) that claims to do a t-test. There are some parameters you can fiddle with, but even with those I could not get the calculator to detect a significant difference between the pre- and post-tax cut BLS numbers.
This might not be the right way to do it. Comparing different time windows could give different results. And I could have screwed up on the interpretation. As I said, I’m not a statistics guy. Interested people with stronger stat skills are welcome to weigh in.
Whoa! Where did you learn how to write “bureaucrat”?
The “numbers” are constantly revised. In fact, when I was checking for 2008, GDP in December 2019, they were STILL revising it. And if you tried to use the “two-quarters of falling GDP” to identify the “Great Recession” you would have placed it in different places depending on which “revision” you used.
“statistically significant” is one of those concepts EVERYONE “knows” what it means, but no one bothers to define.
I calculated how “dangerous” schools are. The percentage of children exposed to violence was something like 0.004%. Yet everyone KNOWS that schools are EXTREMELY violent places.
It seems like to most, “statistically significant” for most economic statistics is 0.1%. No one bothers to ask, “What is the margin of error?” for those numbers.
Bluecat
Sorry I didn’t get the reference. That’s actually my first name.
I was guessing that you picked your “handle” after the character Ned Land in 20,000 Leagues Under the Sea. Kirk Douglas played that part.
Parties write political platforms that spell out policy, so partisan affiliation changes in successive defenstrations following disasters brought on by two different sets of destructive looter policies bring oscillations. These militate in favor of protecting the LP platform from deliberate sabotage so we can continue increasing the libertarian vote share by 80% per year.
Koik and Boit would never fall for THAT line of B.S.
That was an anti-GOD event, a backstabbing betrayal of the Kaiser and of God’s Own Prohibitionists who, after all were only tooling a little honest graft while battling the Demon Plant Leaf Avatars of Satan! Koik and Boit would’ve understood this perfectly.
“For what it’s worth, the average monthly increase in employment has actually been smaller under Trump than it was under Obama.”
I’ve seen similar claims. But the average-monthly-increase data is very noisy. When I looked at a specific claim similar to Sperling’s (comparing the two years since the Trump/GOP tax cut vs the four years prior), I found the difference in the averages was present but not statistically significant.
I’m not a statistics guy, though, so people should do their own analyses if interested.
bluecat
I’m confused at your reference. Was I saddened by a death at 103? No, it’s part of life’s cycle. Is it relevant to our discussion? No.
bluecat57, glad you liked my comment
@Cyril Morong – Thanks for pointing this statistic out. Read or skip the next bit for my thoughts on this particular statistic.*
Economic statistics are pretty meaningless. They are at best “guesses”, OK, “estimates”, of what the numbers actually are. Have you ever seen a headline, “Economist estimates right on!”?
Even those that follow the numbers often are confused by them.
I’ve been looking for an answer to a simple question:
If about 400,000 turn 16 every month, and we are only adding 200,000 jobs each month, how does unemployment not skyrocket? (Yes, there are some “obvious” things, but I’m trying to keep this comment short.)
So, I fired that question off to several economics professors and finally got an answer I wasn’t expecting.
The question is invalid. I was trying to compare apples to oranges is the simple version.
*Most economic statistics are rooted in the distant past. How many 16-year olds leave school to work full-time, yet the labor force numbers start at 16. And how many stop at 62 or thereabouts?
This particular range for labor force participation (I believe that is what Cyril is citing.) is the number “I’ve been looking for.” OK, I’d prefer something like 24 (most that go to college have finished) to 62 (youngest you can claim Social Security.). Along with a 16 – 18 (High School), 19 – 23 (College, Tech School, First Job) and 63 – ?? for old but not ready to retire. I think those numbers would be more reflective of today’s economy.
Then you have non-farm, military, farm, etc. Those categories should be revised as well since full-time “farm” is a smaller part of the labor force and is made up of “family”, visa workers, seasonal, etc. The military is now all volunteer, and even the non-farm probably could use some twerking. (sic)
Again thanks, Cyril. Now I just need to remember to look at the 25-54 stats next time I’m wondering about the labor force.
Draft Of 2021 Congressional Budget Shows Trump Admin. Efforts To Cut Wasteful Spending
https://www.oann.com/draft-of-2021-congressional-budget-shows-trump-admin-efforts-to-cut-wasteful-spending/
The fact that the numbers keep going in “positive” directions, up or down, indicates that Trump at least has not taken Krugman advice and screwed things up. If that does not change before next November he will be re-elected no matter who the Dems put up against him.
The % of 25-54 year olds employed was 80.6%. That is the highest since June 2001. Maybe the employment-population ratio is not the best measure since it includes people of retirement age and lots of people (baby boomers) have been retiring.
The % of 25-54 year olds employed rose 2.4 percentage points from Jan 2017-Jan 2020. From Jan 2014-2017 it rose 1.8 percentage points
Reblogged this on James' Ramblings.
I took an econometrics (forecasting) course as part of my degree in economics.
We were able to hit the US economy with whatever we wanted to. High unemployment, tax increases, unrestricted spending, all the bad things you could think of.
And what did we see happen to the economy? After the first year at most NOTHING. That’s right. After throwing every monkey wrench we could think of at the US economy, after at most a year the TREND line didn’t show a thing except a continued upward slope. We had to skew the axis to see any of the SMALL changes those hits caused. INDIVIDUALS will ADAPT and continue to PROFIT. Even in the Great Recession there were winners.
America is the greatest country on earth. The more you learn about WHY the Founding Fathers wrote the Constitution, the more you understand how the Constitution PREVENTS any administration from screwing things up permanently.
It is NOT government that makes those Trend Lines go up, it is individual AMERICANS doing what they do best: Improve their lives for themselves and their families. The business of America is business.
That is why Obama said he wanted to FUNDAMENTALLY change America. That is why the current crop of Democrats are proposing fundamental changes not only through legislation but to the Constitution.
Samuel Butler: All progress is based on a universal innate desire on the part of every organism to live beyond its income.
@Nedlandp
Condolences on the passing of Kirk Douglas. I’m guessing you were saddened by the news, correct?
Just for giggles, look up the GDP numbers for 2008 to 2010. Oh, couldn’t find THE numbers? That’s right, as of late last year they were still being REVISED.
Now, when did the “Great Recession” start? Wrong, calling a recession is SUBJECTIVE not objective. The “two quarters of falling GDP” is a “rule of thumb”, NOT a “rule”.
Even if you look at the initial GDP numbers you will see that GDP started declining in November 2008. My memory is a bit fuzzy that far back but didn’t some anti-American, anti-capitalist event occur that month?
Not bad, if not for a couple of glaring mistakes.
1. The PRESIDENT does NOT have the AUTHORITY for “spending”.
a. All spending authorization begins in the House of Representatives. The President has responsibility to execute the spending that Congress approves.
b. The majority of federal spending is non-discretionary. It goes out and increases whether the President wants it to or not.
c. Trump’s trade policies are “wrong”? On what planet? I will eventually find the quote by Milton Friedman in which he said something like “free trade” is the ideal, but sometimes you have to level the playing field. Trump’s trade policies are doing that, they are tactical. Trump’s strategic goal is for trade to be as free of government intervention as possible.
d. Therefore, Trump has NOT moved “spending” in the “wrong” direction. Those are not “his” “bad” policies.
2. “Obama moved policy in the wrong direction, of course, but that was largely during his first two years. “
a. Trump didn’t even have a “first two years.” Despite Republican majorities in both houses, Trump’s “policies” were never fully embraced by the Republican Congress. Beginning in year three, the Democrats have opposed virtually every policy with some exceptions. USMCA and couple of others.
b. Trump’s “policy” has consisted of two things he could do WITHOUT Congress.
a) Reduce regulation
b) Make Executive Orders that simply say, “Enforce existing law.” Much of what is attributed to Trump is just that, Trump saying “enforce the laws that the DEMOCRATS passed under Obama or other previous administrations.
While Obama cannot be blamed for the recessionary numbers in 2008-2010, he can be blamed for the lack of rebound numbers that normally follow a recession.
Early rebound numbers coming out of a recession are normally higher, while the numbers at the end of a boom period tend to be lower.
In fact the probable reason that the boom period has extended from its normal 7 year cycle to 10 years is that the early recovery was so anemic.