What does World War I have to do with Obamanomics?
There’s no real connection, of course, but it did give me an opportunity to present a good analogy. At a conference in London last week, I was discussing with some folks the state of the American economy and the role of public policy.
I was trying to explain what’s happened in the past few years, describing the avalanche of bad policy last decade, culminating with the faux stimulus in 2009 and the enactment of Obamacare in 2010.
I then said that Obama’s efforts to impose further statism have been largely stymied, particularly after the Tea Party election of 2010. There have been lots of skirmishes in recent years, to be sure, with Obama winning a few (such as the recent imposition of “net neutrality” regulations on the Internet) but also losing a few (such as spending restraint caused by policies like the sequester).
But the fact that Obama hasn’t been able to make additional “progress” is not really a victory. It’s simply a stalemate.
And that’s where the World War I analogy fits. As I was trying to get across my point, it occurred to me that it’s vaguely like World War I.
 When the war started, the Germans gained considerable ground, overrunning much of Belgium and a lot of territory in northwestern France. That’s akin to Obama’s victories in 2009-2010.
But then the period of trench warfare began and neither side made much progress. And that’s a good description of what’s been happening in recent years in Washington.
This is a good news-bad news situation. To continue with my analogy, the good news is that Obama isn’t conquering more territory. The bad news is that we aren’t pushing Obama back into Germany and reclaiming territory.
And so long as we’re in this stalemate, it’s unlikely that we’ll enjoy robust economic growth. And that’s our topic for today.
In my actual speech, I dusted off my charts based on Minneapolis Fed data, and updated them to compare today’s weak recovery with what’s happened during previous business cycles. And I specifically focused on a comparison of the very strong growth of the Reagan years with the lackluster growth of the Obama years.
But it’s a pity that my speech wasn’t one week later, because I’ve just seen some really good contributions on the same topic from economists Robert Higgs and John Taylor.
Writing for the Independent Institute, Higgs looks at what’s been happening with a key measure of our prosperity.
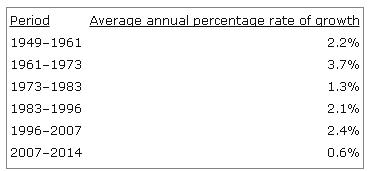
Arguably the best single, currently available measure of the entire public’s payoff from economic activity is real disposable income per capita. This is the average amount per annum that Americans receive in exchange for the use of their labor and other input services, after taxes, corrected for changes in the purchasing power of the dollar. …this measure of economic well-being has scarcely increased at all since 2007.
Higgs also prepared a table to make it easier to compare performance of this important variable during various business cycles.
As you can see, the current “recovery” has been dismal compared to previous periods.
And here’s his analysis of why we’re suffering from sub-par growth.
These figures demonstrate that even though the rate of increase has varied substantially in the past, it has never remained so low as it has been in recent years. Even during the decade of so-called stagflation from the early 1970s to the early 1980s, real disposable income per capita grew more than twice as fast as it has grown in the past seven years. In the past, recessions were always followed by relatively brisk growth during the first several years of the ensuing recovery. Such has not been the case this time. Nor do forecasters anticipate any such surge of growth in the future. Might it be that the state’s burdens loaded onto the private producers of wealth—taxes, regulations, uncertainties, intrusions of all sorts, including demands for elaborate reports, asset seizures, and threats of felony prosecution for completely innocent and harmless actions—have finally become the “last straw” for these long-suffering camels? …the current situation is clear enough. The U.S. economy, though not yet completely stagnant, has made little headway for more than seven years, and there is little reason to foresee any great change in this regard.
Returning to my analogy, Higgs is basically saying that we’ll be mired in trench warfare for the foreseeable future.
Not exactly a rosy projection.
Now let’s look at the analysis of Professor John Taylor of Stanford University. He starts by walking through a timeline of the current “recovery.”
At the time of the first anniversary of current recovery in 2010, it showed clear signs of weakness compared to the recovery from the recessions in the early 1980s and from all other deep recessions in American history. …By the recovery’s second anniversary in 2011, it was weak for long enough that I called it “a recovery in name only, so weak as to be nonexistent.” …By the recovery’s third anniversary in 2012, it was now the worst recovery from a deep recession in American history. …By the recovery’s fourth anniversary in 2013, few disputed any more that it was unusually weak and disappointing. …By the recovery’s fifth anniversary, we were so far away from the recession that linking the terrible performance to the recession became increasing far-fetched.
Professor Taylor has a couple of charts of his own that bolster his argument.
Here’s a comparison of quarterly growth during the Obama recovery and Reagan recovery.
If you’re keeping score, Reagan’s economy out-performed Obama’s economy (often by a very wide margin) in 19 out of 22 quarters.

If this was a boxing match, it would have been stopped long ago.
Taylor also looks at the performance of the labor market during the Obama recovery and Reagan recovery.

Once again, there’s no comparison. During the Reagan years more people were working and adding to the productive capacity of the nation.
During the Obama years, by contrast, the most optimistic assessment is that we’re treading water.
Here’s more of his analysis about the ongoing stagnation.
With the recovery now approaching its sixth anniversary, there is more optimism that we are finally coming out the excruciating slow growth. There is also some wishful thinking that the drop of people out of the labor force—which has made the unemployment rate come down—is due to demographic factors not the slow growth itself. And we are not as bad as Europe. But as these charts show there is still not much in this recovery to write home about. Growth over the four quarters of 2014 looks to average only 2.2% compared with 4.4% in the corresponding quarters of the 1980s recovery. And as of January 2015 the employment-to-population ratio is still lower than at the start of the recovery.
So what’s the bottom line?
To be blunt, you can’t make America more like Europe and then be surprised that our economy isn’t firing on all cylinders.
Returning to our analogy, we need to defeat the enemy of statism and reclaim our lost territory.
But that won’t happen until 2017 at the earliest. And it’s possible it will never happen, particularly if we don’t implement genuine entitlement reform.
P.S. The bad news is that we’re becoming more like Europe. The good news is that we’re not there yet. Our overall burden of government has expanded, but we still have considerably more economic liberty than the average European nation. And that helps to explain why our recovery (even though anemic by American standards) is far more impressive than what’s been happening across the Atlantic.
P.P.S. Based on insightful analysis from Thomas Sowell, John Mackey, and Ronald Reagan, it may have been more accurate (albeit snarky and inappropriate) to have used a World War II example, with Obama’s first two years being akin to the Nazi blitzkrieg and the conquest of France, and recent years being akin to the period between the Battle of Britain and D-Day.

[…] in the wrong direction, of course, but that was largely during his first two years. There was a policy stalemate his final six […]
Dan – I’m -the person who invited you to speak at the Balanced Budget Task Force (BBATF) breaklfast on December the 6th last. THANKS
I agree wiith your analysis Dan – but how are we to find ANY leader capable of defeating statism? Even Reagan failed to control deficts and built his excellent growth record on the back of wider deficits then G.W. Bush started us back on the deficit binge – only H.W. Bush and Clinton achieved balance –
That’s why we need the BBA – and it is feasible – here’s our status and analysis of why its needed
Can I call you to discuss – or you can call me 301 502 1445 –
.
With great respect and best wishes;
The Honorable
John A. Knubel
Cell: 301 502 1445
Home – land line: 615 656 1315
1365 Eliot Road
Franklin, Tennessee
37064- 4882
e mail: johnknubel@gmail.com
This paper summarizes today’s unique realities relevant to the debate surrounding ratifying a Balanced Budget Constitutional Amendment (BBA) under article V of the constitution. It’s designed for the American electorate with a focus on state legislators voting on state legislation calling on Congress to convene a limited power ‘convention of states’ to draft a BBA. Twenty five states have passed this legislation with 34 needed to force Congress to call a convention. Thirty eight are needed to ratify. A ‘road map’ plan for getting the additional nine is available on request. South Dakota was just added and the recent Republican victory nationally has built momentum.
Why today’s situation is so unique. As illustrated below, the Federal Government Fiscal Dynamic has recently reversed. From 1946 thru 2007, revenues grew faster than spending, despite tax cuts. This was true because Congress exercised budget control over more than 80 % of Federal spending in the annual budget review process, compared to less than 40% today (and falling). And a vibrant post war economy increased revenue without tax rate increases.
From 1946 though 1980, average revenue growth was 6.1% while spending grew 5.9%. The economy, (e.g. The Gross Domestic Product or GDP) , grew faster than debt causing the all important debt as a percentage of the economy, the debt to GDP ratio, to fall from about 120% in 1946 to under 30% in 1980.
From 1980 on, the same favorable underlying trends existed. A vibrant post war economy continued to create an underlying trend that increased revenue faster than spending without tax rate increases. However, tax cuts caused actual revenue to actually grow slower than spending, increasing absolute debt levels and the critical debt to GDP ratio. (A graph showing actual debt to GDP ratios is available on request.)
This ratio is crucially important because it is the metric investors use to gauge whether a country and its currency are safe investments. There are other considerations such as the size of the economy; the degree debt is funded by a countries domestic savings versus foreign investors and whether the country is incurring a positive or negative balance of trade. (1) These issues are beyond the scope of this paper to explore in depth but suffice to say that America today is headed in the wrong direction on all counts. Since WWII we have run increasing trade deficits, morphed from a net creditor to a net debtor nation, our savings rates have eroded and especially in the last eight years have run up unprecedentedly large deficits and external debt.
The ‘tax cuts will close deficits’ illusion. Increasingly from 1980 through the early 1990s, the American economy was managed under the illusion that because ‘tax cuts would cause the economy to grow faster, the deficits thus created by these tax cuts would be closed without emphasizing spending control. From 1980 on, this favorable underlying revenue spending trends made it possible for the government to forecast revenue growth exceeding forecast spending. The government was able to forecast closure of the deficits caused by those tax cuts without a great emphasis on spending control. In fact, these positive deficit closure forecasts never materialized until the late 1990s when deficit closure was finally achieved from 1998 to 2000. But favorable underlying revenue spending trends still allowed this illusion to continue and to govern America’s economic governance despite disappointing results.
But in 2010 the retirement of the baby boomers reversed this favorable revenue spending trend. In 2008, the worst recession since the 1930s, masked these changes but the ‘tipping point’ emerged and is illustrated below. From 2016 on, expanding deficits are projected with revenue falling behind ‘automatic’ program formula driven, entitlement spending growth, even under the most optimistic assumptions regarding economic growth.
Our national political leaders have not been able to achieve consensus or agree on policies adequate to deal with these new fiscal realities and the result is continued growth in both absolute debt levels and the debt to GDP ratio. Pew Trust and other polls show over 80% of the American People understand America’s on an unsustainable fiscal trajectory and that it is immoral to pass on to our children the cost of their parents prosperity while jeopardizing their economic and job creation possibilities. But this is precisely what we are doing. And unless arrested, these new realities will create a nightmare out of the American Dream even for us and of course for our children and grandchildren.
Recent forecasts reinforce this new unpleasant reality. What follows is a summary and sensitivity analysis of these latest Congressional Budget Office (CBO) forecasts.
(2) Current Congressional Budget Office (CBO) projections illustrate this economic threat but also the fact that the situation presents a political opportunity to one of the major parties or even a third party as occurred in Britain, which is able to capitalize on its emergence.
The threat summarized. Between 2009 and 2012, the federal government recorded its largest budget deficit relative to the size of the economy since 1946. As a result, total debt held by the public is today equivalent to 74% of the economy’s annual output or gross domestic product (GDP). The current debt to GDP ratio is almost twice its historical average. This is a higher percentage than at any point in US history except briefly at the end of World War 2. It is twice the percentage at the end of 2008.
If current laws remain generally unchanged, deficits and the debt to GDP ratio will decline slightly through 2016 but then grow continually even under the optimistic economic growth scenarios. In 20 years or less, it would approach 100%, under ‘current law’. The CBO report states this growth cannot be sustained and a growing body of economic analysis demonstrates that at debt to GDP ratios exceeding 80%, economic and job growth both suffer. The CBO acknowledges this reality but does not include it their forecast.
The official CBO forecasts are they admit unrealistically conservative and low. This is true because the forecasts are based on ‘current law’ which counts on certain tax cuts expiring and automatic spending cuts being implemented. If future Congresses changes these laws to increase spending and reduce revenue as past Congresses have done in the past, the debt to GDP ratio will exceed 180% as summarized below. When Europe experienced its recent crises, this ratio for Greece and the other weaker counties like Italy Spain and was between 100 and 120%. America is not Greece but the warning is clear. We are vulnerable. (2)
Current Historic 2024 2034
Debt/GDP* 74% 40% 80 – 100% 100 – 180%
Deficit /GDP 4.5% 2.5% 3.0% 4.5%
Interest/GDP 2.5% 2.0% 3.5% 4.5%
*Does not include “Trust Fund” intergovernmental debt such as the Social Security military and civilian retirement “trust” funds which add to external debt when pay outs occur but not before. Only external debt is included because this is what CBO forecasts. Abrogating external debt is impossible and unthinkable Abrogating Trust fund debt would be extremely disruptive. Over 50% of Americans over 65 rely primarily on Social Security and if military and civilians pensions were cut, the reaction would be severe on a par with Detroit. If Trust Fund debt is added, these ratios will be increased to 102% in the current year and roughly proportionally thereafter.
Growth in the debt to GDP ratio is propelled primarily by expanding health care costs, Social Security and interest on existing debt that will double compared to the past 40 years and that today is equal to the entire Defense Budget. By contrast, spending for programs called discretionary programs that fund the classic government services, such as defense, would decline to about 11 % of total government spending by the end of the period.
3) What happens if we do nothing? High debt to GDP ratios will negatively impact economic growth leading to higher debt to GDP ratios and slower growth. The country will become increasingly vulnerable to credit crises, deeper recessions and even depression.
The precedence for a sudden and seismic credit loss of market confidence is the disruption to the short term ‘commercial paper’ credit markets which in 2008 drove many old venerated investment banks into insolvency and bankruptcy. For national examples one need look no further than the recent European Union crises. Credit and currency markets are emotional and ruthless once confidence is shaken and currency wars are real and have been documented. (See “Currency Wars” by James Richards).
The interest rate illusion and trap. Interest rates are lower today than at anytime since WWII masking the potential adverse impact of rising debt on the Federal Budget. From 1980 through 2006 debt grew from about $1.0T to over $15.0T while the cost of federal borrowing rose less than 20%. If rates were to return to 2006 levels, federal spending would increase Federal spending by over 25% or $750.0 Billion with nothing of real value purchased by these funds. This spiraling interest debt trap is typical of countries like Greece in crises and America is not immune.
The potential for an adverse feedback on growth and job creation is being aptly called an ‘economic doom loop’. Large federal borrowing draws savings away from private investment and other productive uses of capital because people’s savings are used to buy government securities and that are not therefore available to finance productive investment. Slower economic growth and job creation and will restrict the ability of people to move up from one social level to another and the income and wealth gap would widen. Yes, the American Dream could easily become a nightmare.
The CBO forecast also warns that the large amount of debt will restrict future government’s ability to use tax and spending policies to respond to crisis like the financial crises of 2008.
(4) Implications for America’s National Security? Two Chairmen of the Joints Chiefs of Staff, Admiral Mike Mullen and General Martin Dempsey have called the national debt the greatest threat to America’s national security. Both are concerned about the crowding out of national security funding and the threat of creditor blackmail in crises similar to America’s actions with the British in the Suez crises of 1957.(3)
(5) Why a BBA is needed. The political dialogue since 2008 particularly over the debt limit that resulted in Congress resorting to sequestration to achieve spending control, demonstrated again that Congress is simply incapable of limiting spending without an outside control mechanism like sequestration or a BBA. . A BBA is needed to force Congress control spending. The national political process has increasing demonstrated, in the failed Graham Rudman efforts in the 1980s to the later failed Pay Go efforts through the failure of the governance process since 2010 to achieve the ‘Grand Bargain’ to close the deficit gap beyond three years and reduce the uncertainly that’s dampening the current economic recovery. Like sequestration, the BBA would allow flexibility in crises but also give politicians the backbone they need to allow the needed spending control they know is needed.
As discussed in detail by reference (4), the problem is primarily not economic but political. For politicians at the national level, the rational strategy is to avoid visibly endorsing the hard decisions necessary to control spending. The BBA would give them the outside support they know need. To do what they know has to be done to close the new and unprecedented gap between spending and revenue while also avoiding personal responsibility.
For both parties, agreeing to the necessary comprise is believed to be the familiar ‘third rail’ that has plagued Social Security and other entitlement reform historically. A detailed explanation of this political dysfunctionality of governance, almost a ‘Greek tragedy’ is given in reference (4) (Page 260) where an analogy is illustrated in the ‘prisoners dilemma’ so familiar to game theorists. In this ‘game’ both players, acting rationally and in their own perceived self interest, have an incentive to act both contrary to their common interest and ultimately their narrow self-interest. This unhappy result stems from a lack of trust in each other and the absence of a healthy and trusted ability to communicate with each other.
The BBA would provide this outside support, analogous to the lack of trust and communication in the ‘prisoner’s dilemma’ so both prisoners self and general interest to be realized.
Building on this apt analogy, the specific political realities can be further illustrated and summarized for both Republican and Democrats as follows.
The Democratic core policy ‘plank’ to be avoided and protected is entitlement reform and major discretionary spending cuts, except possibly in Defense. The Republicans adamantly want to avoid raising taxes and to increase defense spending. Both opt to protect their core policy preferences, no agreement is reached, spending control suffers and debt soars. This was especially visible in the recent failure to achieve the ‘grand bargain’ needed to restore economic confidence and pre 2007 rates of economic growth.
This gloomy scenario will become even more apparent, as forecast deficits rise after 2016. Trust is lacking to ensure if one side compromises, the other will honor that compromise by not taking advantage of the other politically. For the compromise to work, both must be willing to allow the other to have some credit and to take some political gain and to satisfy their core constituents. Politicians in search of reelection need to be able to blame someone (the opposition) or some thing (Sequestration or the BBA) for forcing the unpleasant reality they know is needed. But absent these, these spending issues go unaddressed, gridlock continues, debt levels grow and (after 2016) deficits and the debt to GDP ratio will continue to grow.
So if you’re a career politician hoping to survive, move up the ladder or retire with benefits, why take the risk? Instead they assume the American credit card will continue to be accepted and the country continues along our unsustainable path that polls show over 80% of all Democrats Republicans and Independents know is unsustainable and paradoxically want addressed.
What a BBA could look like. The BBA must be flexible enough to give the President and Congress the ability to take action in the face of economic crises similar to 2008 and the 1930s. It must also avoid providing loop holes that could give Congress opportunities to avoid its purpose entirely, like announcing a constant and prolonged state of crises.
The goal of the BBA would be to reduce the ratio of debt to GDP over time and therefore it would be written to broadly constrain spending growth to projected revenue increases except in emergency situations defined by the BBA. The ratio may rise during crises and periods of extended cyclical unemployment. But during expansions of the economy it must be allowed to fall as spending is constrained by forecast revenue growth. This balancing of the budget over the business cycle has always been the stated goal of the Keynesian approach to managing the business cycle. A reality largely ignored by our political leadership.
A BBA could combine flexibility in the short term (to deal with recessions) with necessary discipline longer term. An example is ‘the Swiss Debt Brake’ and the example of other countries such as Switzerland and Sweden which have dealt with these issues successfully reaping substantial benefits from reducing their debt and debt to GDP ratios. The reward is improved economic growth, prosperity and job creation. Another recent example is Britain.
What follows are some general considerations that should apply to a BBA (5)
(i) The annual spending constraint should be defined as the median federal inflation-adjusted revenues for the previous seven years. It should not be based on the current year’s revenue because this amount is not known before the budget is set and it will fluctuate with the business cycle.
(ii) Any amendment must be stated in as simple terms as possible and address unfunded liabilities in future years as well as current cash flow.
(iii) The total accrual or unfunded liability for specific entitlement programs can be relatively easily calculated actuarially based on demographics and program requirements. It is the present value of future cash payouts discounted at the government rate of interest.
(iv) But how much of this liability should be covered in the calculation of the current deficit requires discussion. Today none of this liability is counted in most presentations which have led to the ‘Lock Box’ debate regarding Social Security.
(v) Certainly the major entitlements should be included such as Social Security, Medicaid Medicare and welfare programs such as food stamps. But the details of which programs should be covered are another issue needing analysis and discussion.
(vi) But which other entitlements should be covered should probably not be defined by the amendment.
(vii) The amendment should use escalating supermajority votes to control annual exemptions that authorize deviation from the basic constraint. This means allowing higher expenditures in a given year only after a supra majority vote of both Houses of Congress. For example, a vote of three fifths of both houses required for the first year, three quarters for the second, four fifths the third year etc.
(viii) It would be counterproductive to prescribe specific ratios of revenue or spending to GDP in the amendment. Only Congress and the President can judge what the best size of government is for their time. Attempting to prescribe specific outcomes will hinder ratification.
(ix) A Balanced budget amendment should measure not only debt actually issued by Treasury but could also measure of the cost of all unfunded Federal Mandates imposed on the states by the Federal Government.
(x) It would require the Federal Government to provide a mechanism in their legislation to fully fund all future liabilities associated by any new ‘entitlement’ program they pass. The Congressional Budget Office (CBO) would be required to ‘score’ the present value of these new entitlements and publish this as part of the reporting requirements under the amendment.
(xi) Finally, the amendment should provide a glide path towards a lower debt to GDP ratio while avoiding sudden, potentially recessionary, shocks as deficits are brought under control.
A summary of the Balanced Budget Amendment Coalition status. The Balanced Budget Amendment Coalition has leadership teams and grassroots supporters in 15 target states. Only 9 of the 15 states are needed to get the 34 needed to trigger a limited Article V Convention. Momentum is building. In the past two years the Balanced Budget Amendment Task Force and I Am American have successfully worked to pass BBA applications in seven more states, New Hampshire, Ohio, Georgia, Tennessee, Florida, Michigan, South Dakota and Louisiana.
Footnotes: (1) For example today Japan has a debt to GDP ratio of close to 200%. But a far greater portion of the debt is funded by the Japanese themselves from their extraordinary high internal saving rate this means in a future crises these debt funding will remain stable. But if debt is funded from international investors as is the case increasingly for the US, it is far more likely they will be withdrawn in a crises motivated by political motives or economic or value concerns. Also as is the case for China today, if the country runs a balance of payments or trade surplus and has a relatively high internal savings rate they will be able to run even higher debt to GDP ratios with impunity while also increasing its creditor status with the rest of the world.
(2) The best treatments of these issues are given in “This Time is Different” (Eight Centuries of Financial Folly by Reinhardt and Rogoff. See particularly page 292 for their wise but foreboding warnings regarding their current US debt bubble. As well as The Federal Re4serve Bank of Dallas paper Vol. 10, No. 1 January 2015 “Current Account Surplus May Damp the Effects of china’s Credit Boom”, this treats the special case of the Chinese.
(3) When Nasser nationalized the Suez Canal in 1957, the British and French sent in troops to take it back, a policy Eisenhower did not support. The President then threatened to withdraw American support for refunding their debt and both the British and French withdrew immediately. .
(4) Many of the ideas and thoughts incorporated in this note were discussed in the recommended book: Balance. The Economics of Great Powers from Ancient Rome to Modern America by Glenn Hubbard and Tim Kane; Simon and Schuster 2013.
(5) IBID
Europe is in crisis… [economic and social…]… the EU might not survive the year…. Japan’s unemployment rate is the highest in six months… and retail sales and household spending are down… the outlook is not good… but the pundits… all point overseas… and say…. oh look… “we are doing so much better than Europe”… in this global economy… what goes around… comes around… and instead of giving our business community the tools it needs to weather the up-coming storm… and protect the American economy… the Obama clown show piles on the regulations… and seeks to increase our tax burden… in this case… stalemate is a good thing… better to be in the trenches… and safe… than to be charging a machine gun nest in the name of the name of Bozo and Clarabelle…
Problem I see is that we are still waiting for many of the regulatory items they have put in place to kick in. Many were delayed until after the elections for fear the American people would see what they were being handed. So, in the next go-round there will be hard evidence of just how bad it has become. Unfortunately, the elitists are all-in to put in place a whole new voting block who will had them their wins despite the mess. de Tocqueville pointed that the death of a society occurs when the average voter decides to vote himself a handout- preferring equality in servitude to inequality in freedom
Will there be “progress” towards less coercive collectivism once Obama leaves office?
Virtually impossible. Coercive collectivism is more or less a one way valve. Empirical evidence supports the same. Look at France, Greece, virtually all of Europe. The slower they grow, the larger their growth deficit compared to world average, the more voter-lemmings double down on statism and coercive collectivism.
The key, as an individual, is to find the few breakaway nations before you develop too many ties to one of many western world developed democracies headed for decline.
Stay mobile. It’s especially important to teach your children how to be so. Everything human is moving faster now and irreversibly accelerating. National ascents and declines that used to take centuries will now conclude in decades. The world will be a completely different place in a couple of generations. I’m afraid that those who naively bank on the US remaining at the top of the prosperity rankings will be sorely disappointed.
P.S. Not sure if this has anything to do with my somber mood but I’m in line at the DMV. … And having to watch paternalistic messages on a big screen TV to boot.
There is virtually no difference between sitting at the DMV and visiting a public agency in Greece. It is virtually the same experience. Except that in Greece you also go to the DMV for medicine, education, banking permits… a host of other things that were passed to state control during various bouts of past HopNChange.
But it’s coming here in the US too. After all you voted for it. The road to France, and then Greece, is paved with HopNChange.
As time goes by American voting patterns will resemble more and more European voter choices. I think the point of no return has passed. America is finally being pulled into the fold of coercive collectivism.
excellent
Sent from my iPad
>
[…] During the Obama years, by contrast, the most optimistic WAIT, THERE’S MORE… […]
[…] By Dan Mitchell […]