Two days ago, I looked at top income tax rates for the various states.
 Yesterday, I shared the data for the states on sales tax rates.
The big takeaway from those two sources of data is that California politicians are very greedy.
But are they the greediest politicians in the country? What if we also measure other sources of tax revenue (property taxes, excise taxes, severance taxes, etc)?
And what about the various fees and charges that also are imposed by state and local governments?
To account for all these factors, we obviously need a comprehensive measure. And since the real cost of government is how much it is spending (regardless of whether the outlays are financed by taxes or borrowing), the most accurate approach is to calculate the relative spending burdens imposed by state and local governments.
The Census Bureau actually collects that data (albeit with a lag, so the most-recent data is for 2017).
But you don’t simply want to look at total spending by state and local governments. You also want to adjust for population (specifically, the population data for 2017) so we can calculate the per-capita burden of state spending.
Moreover, it’s also important to understand that some states have varying levels of income (for historic reasons, policy reasons, and difference in the cost of living). So if you want to calculate the economic burden of state and local spending, you also need data on state personal income for 2017.
So I put all these numbers into an excel file and crunched the numbers to see how the 50 states (plus Washington, DC) compare based on these two ways of showing fiscal burdens.
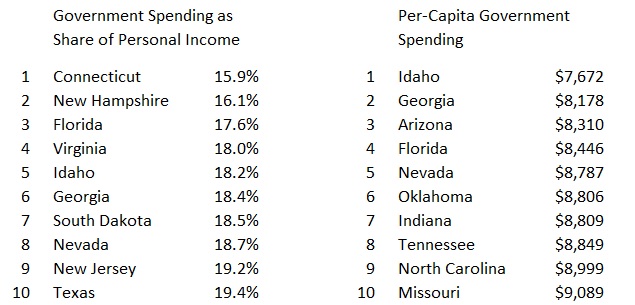
The following table shows the good states, at least relatively speaking. I’m amazed to see Connecticut and New Jersey in the top 10 for spending as a share of personal income. This merits further investigation, but one obvious takeaway is that it’s good to be a high-income state.
The goal, of course, should be to appear on both lists. On that basis, Idaho, Florida, and Nevada deserve praise.
But this three-part series isn’t designed to highlight the good states.
We want to know which states have the greediest politicians. And greed is being measured by their propensity to buy votes by spending other people’s money.
Once again, we’ll show the spending data both as a share of personal income and as a per-capita calculation. On this basis, Alaska is terrible (the politicians spend oil money with reckless abandon), as is the District of Columbia.
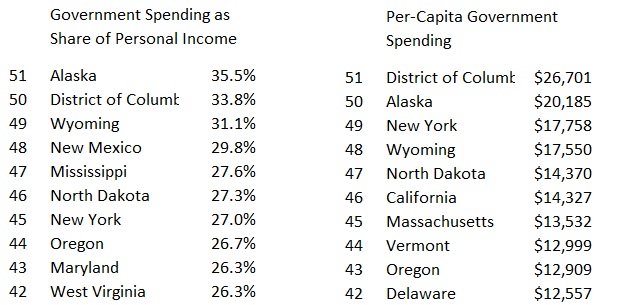
Wyoming also is a state with profligate politicians. It has no income tax and a modest sales tax, but lawmakers (just like in Alaska) can’t resist buying votes with all the money generated by energy taxes (which is why I penalized the state when writing about good state tax systems back in 2015).
This explains why North Dakota is on both lists as well.
If we focus on states that don’t get lots of money from energy taxes, than New York and Oregon deserve special scorn for appearing in both columns.
P.S. One area that requires further exploration (partially explained by the Third Theorem of Government) is the impact of 1,386 federal transfer programs that subsidize/encourage more spending by state and local governments.
