When writing about employment and jobs, I often try to remind people about a handful of important observations.
- A nation’s economic output is determined in part by the number of people gainfully employed.
- The share of working-age people with jobs may be more important than the unemployment rate.
- Worker compensation is determined by productivity and productivity is driven by investment.
- Government redistribution programs can make joblessness more attractive than employment.
Regarding the final point, a new report from the Committee to Unleash Prosperity contains some very depressing data. Authored by Prof. Casey Mulligan of the University of Chicago and E.J. Antoni or the Heritage Foundation, it shows how Americans can be lured into unemployment.
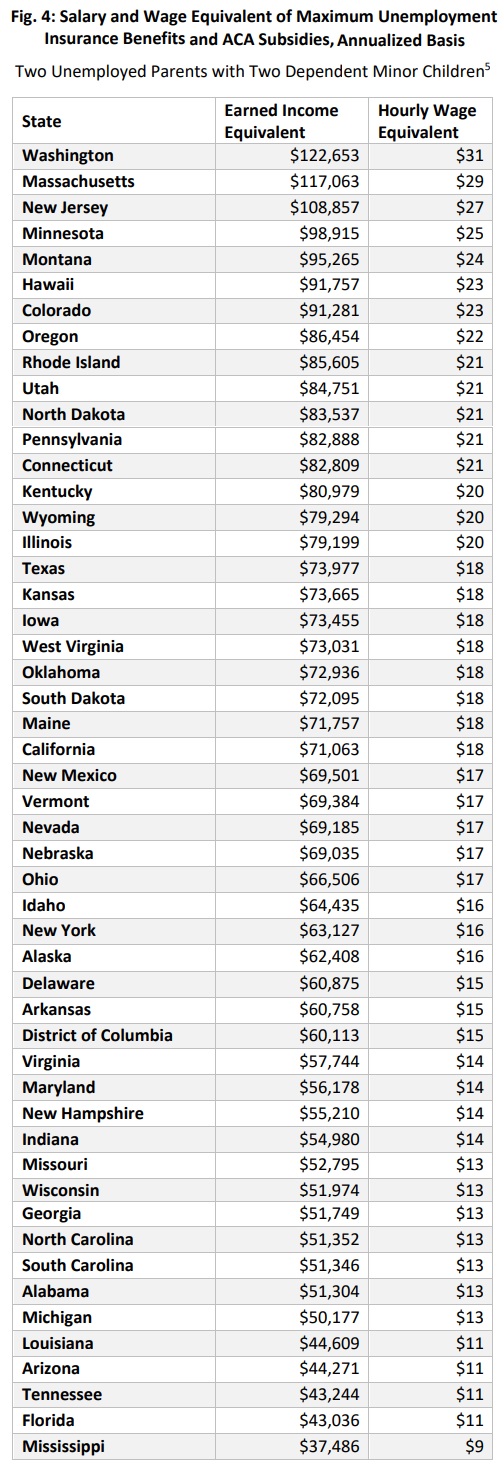
…with existing unemployment benefits and the dramatic recent expansion of ObamaCare subsidies, a spouse would have to earn more than $80,000 a year from a 40 hour a week job to have the same after-tax income as certain families with two unemployed spouses receiving government benefits.
In these states, working 40 hours a week and earning $20 an hour would mean a slight reduction in income compared to two parents receiving unemployment benefits and health care subsidies. …In 24 states, unemployment benefits and ACA subsidies for a family of four with both parents not working are the annualized equivalent of at least the national median household income. …In more than half the states, unemployment benefits and ACA subsidies exceed the value of the salary and benefits of the average firefighter, truck driver, machinist, or retail associate in those states.
For American readers, here’s a look at how some states make it very attractive to rely on government.
The good news (if we’re grading on a curve) is that some of the numbers are not as bad as they were during the pandemic, when politicians decided to provide super-charged unemployment benefits.
 On the other hand, Obamacare subsidies are becoming an ever-bigger drag on the job market.
The big takeaway is that the numbers above reflect the impact of just two social insurance programs. The numbers would look worse if various means-tested programs were included.
For those interested in that data, here are state estimates from back in 2013, before Obamacare was fully in effect.
And for those who like international comparisons, here’s a look at the nations with the biggest handouts.
P.S. If Biden’s proposal for per-child handouts is approved, it would become far easier for people to leave the labor force and rely on handouts.

John,
I’m not sure why you wrote: “Those numbers are for TWO people receiving unemployment benefits.” I had already specified an unemployed couple and I threw in two kids. In any event, let’s assume the payout is as you say. More important than the accuracy of the payout might be to take into account am important piece of information that Dan left out, and that is for how long one can collect. The chart is very misleading. No family of four in Washington is going to collect $122,653 (what Dan is clearly trying to get the unsuspecting reader to think), because in the vast majority of states there is a 26-week limit on unemployment benefits. A couple states go a week or two beyond that (Montana tops everyone at 28 weeks), and a few states don’t quite get to 26 weeks.
Nothing else to say except that I didn’t really understand “Phil, knowing the income amounts sorta tells you how many people.” The income figure Dan gives for Illinois ($79,199 – if the state actually paid for a year, but it doesn’t) doesn’t give me any idea how many people are collecting unemployment. I have lived in a very middle- class part of Illinois for 21 years. I have never known of a single family of four with two unemployed parents. I’m sure they exist, but I have no idea how many such families there are.
Phil and Brian,
Those numbers are for TWO people receiving unemployment benefits. And they include ACA subsidies, which is probably around $20k max for a 4-person family. So reduce by 20k and divide by two for the rough per-worker income amount. $122k MA equates to a $51k per-worker max unemployment benefit, and for $79k Illinois it’s around $30k.
Phil, knowing the income amounts sorta tells you how many people.
I agree John, with both sentences you write. What I don’t know is how many people we’re talking about. That’s why I wonder if the figures reflect outliers. I live in Illinois. I’m pretty sure that most unemployed couples with two kids aren’t getting $79,199 (that would definitely encourage dependency over self-sufficiency). Of course, I don’t know that for a fact. I think Brian Oxley’s comment is along the same lines.
These short blurbs are so much easier on the nerves and on one’s time!
I find the numbers in the chart incredulous as they are so eye-popping large. Surely I will not make 100k in Massachusetts et al. Who pays for this? That most workers prefer a lower working income over these benefits is either a red flag for these numbers or a testament to Americans preferring work over handouts.
Phil, showing the maximum benefit indicates how far moral hazard reaches up the income ladder. Higher benefits increase the share of the population faced with the decision of self-sufficiency vs govt dependency.
[…] Courtesy of International Liberty. […]
[…] Courtesy of International Liberty. […]
[…] Courtesy of International Liberty. […]
[…] Courtesy of International Liberty. […]
I’m a little leery, Dan, of a chart that speaks of “maximum unemployment insurance benefits…” These numbers could be far-out outliers… or not. The problem is, I have no way to know. The maximum I ever spent on car repairs in a single year was probably a little over $10,000 when I had to replace a transmission (and do a few other things). But most people (including me) spend far less than that on car repairs in a given year.
I don’t dispute that there is a “… Tradeoff Between Government Dependency and Self-Sufficiency.” It’s a fine line to walk. But I’m not sure that this chart helps me to walk that line.