There are several options if you want to measure economic freedom and competitiveness among nations (rankings from the Fraser Institute, Heritage Foundation, and World Economic Forum).
You also have many choices if you want to measure economic freedom and competitiveness among states (rankings from the Tax Foundation, Mercatus Center, and Fraser Institute).
But there’s never been a good source if you want to know which local jurisdiction is best.
Dean Stansel of Southern Methodist University is helping to fill this gap with a report looking at the relative quality of government policy in various metropolitan statistical areas (MSAs encompass not just a city, but also economically relevant suburbs).
…the level of economic freedom can vary across subnational jurisdictions within the same country (e.g., Texas and Florida have less-burdensome economic policies and therefore much greater economic freedom than New York and California).
However, levels of economic freedom can also vary within those subnational jurisdictions. For example, the San Jose metro area has substantially higher economic freedom than Los Angeles. The same is true for Nashville compared to Memphis. In some places, metropolitan areas straddle state borders, skewing state-level economic data. This report quantifies those intra-state disparities by providing a local-level version of the EFNA, ranking 382 metropolitan areas by their economic freedom levels.
So who wins this contest?
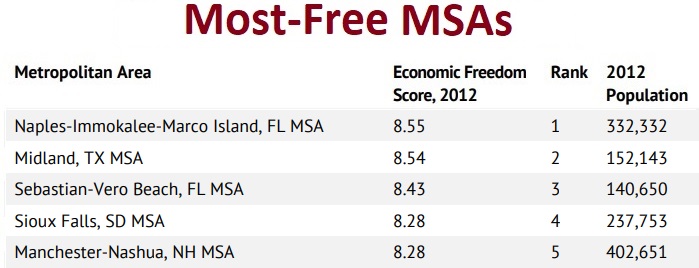
Here are the five most-free MSAs. It’s worth noting that all of them are in states with no income tax, which shows that good state policy helps.
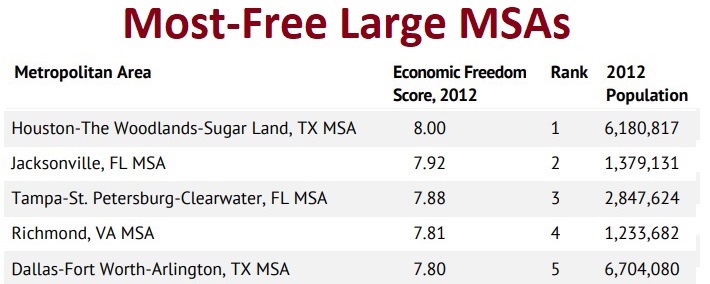
What if we limit ourselves to large cities?
Here are the five most-free MSAs with population over 1 million. As you can see, Houston is in first place and zero-income-tax Texas and Florida are well represented.
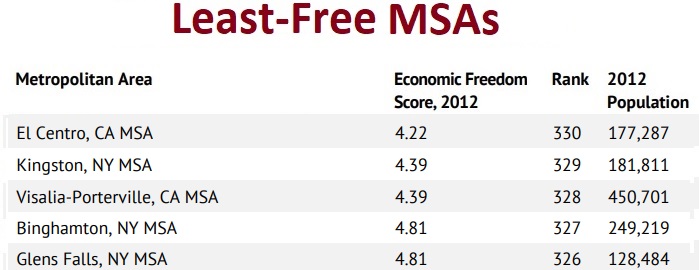
Now let’s shift to the localities on the bottom of the rankings.
Which MSA is the worst place for economic freedom in America?
Congratulations to El Centro in California for winning this booby prize. As you can see, jurisdictions in New York and California dominate.
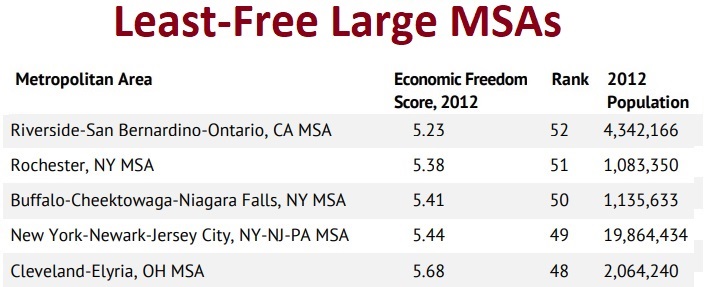
What if we look are larger jurisdictions, those with over 1 million people?
In this case, Riverside-San Bernardino-Ontario is the worst place to live.
Though if you want to focus on big cities, the NYC metro area deserves special mention.
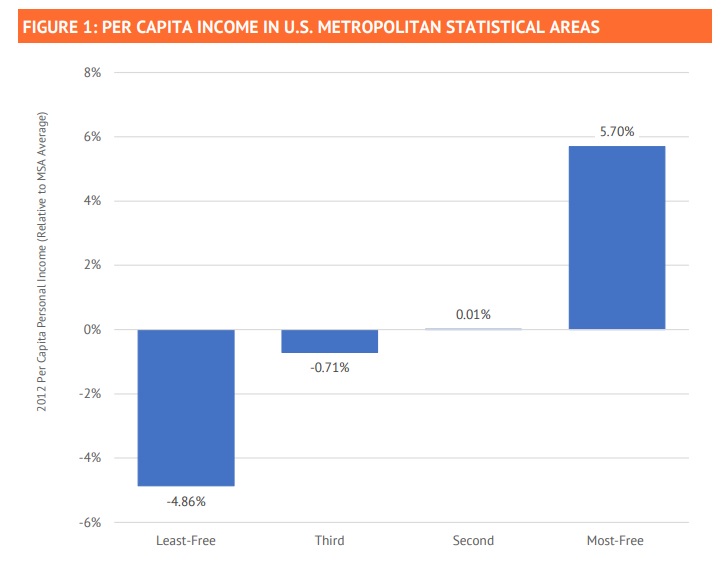
Now let’s consider why economic freedom matters.
I’ve shared charts showing how more economic freedom leads to more prosperity in nations.
The same thing is true for states.
So you shouldn’t be surprised to discover that it also is true for metro areas.
Last but not least, here’s a map showing freedom in all MSAs.
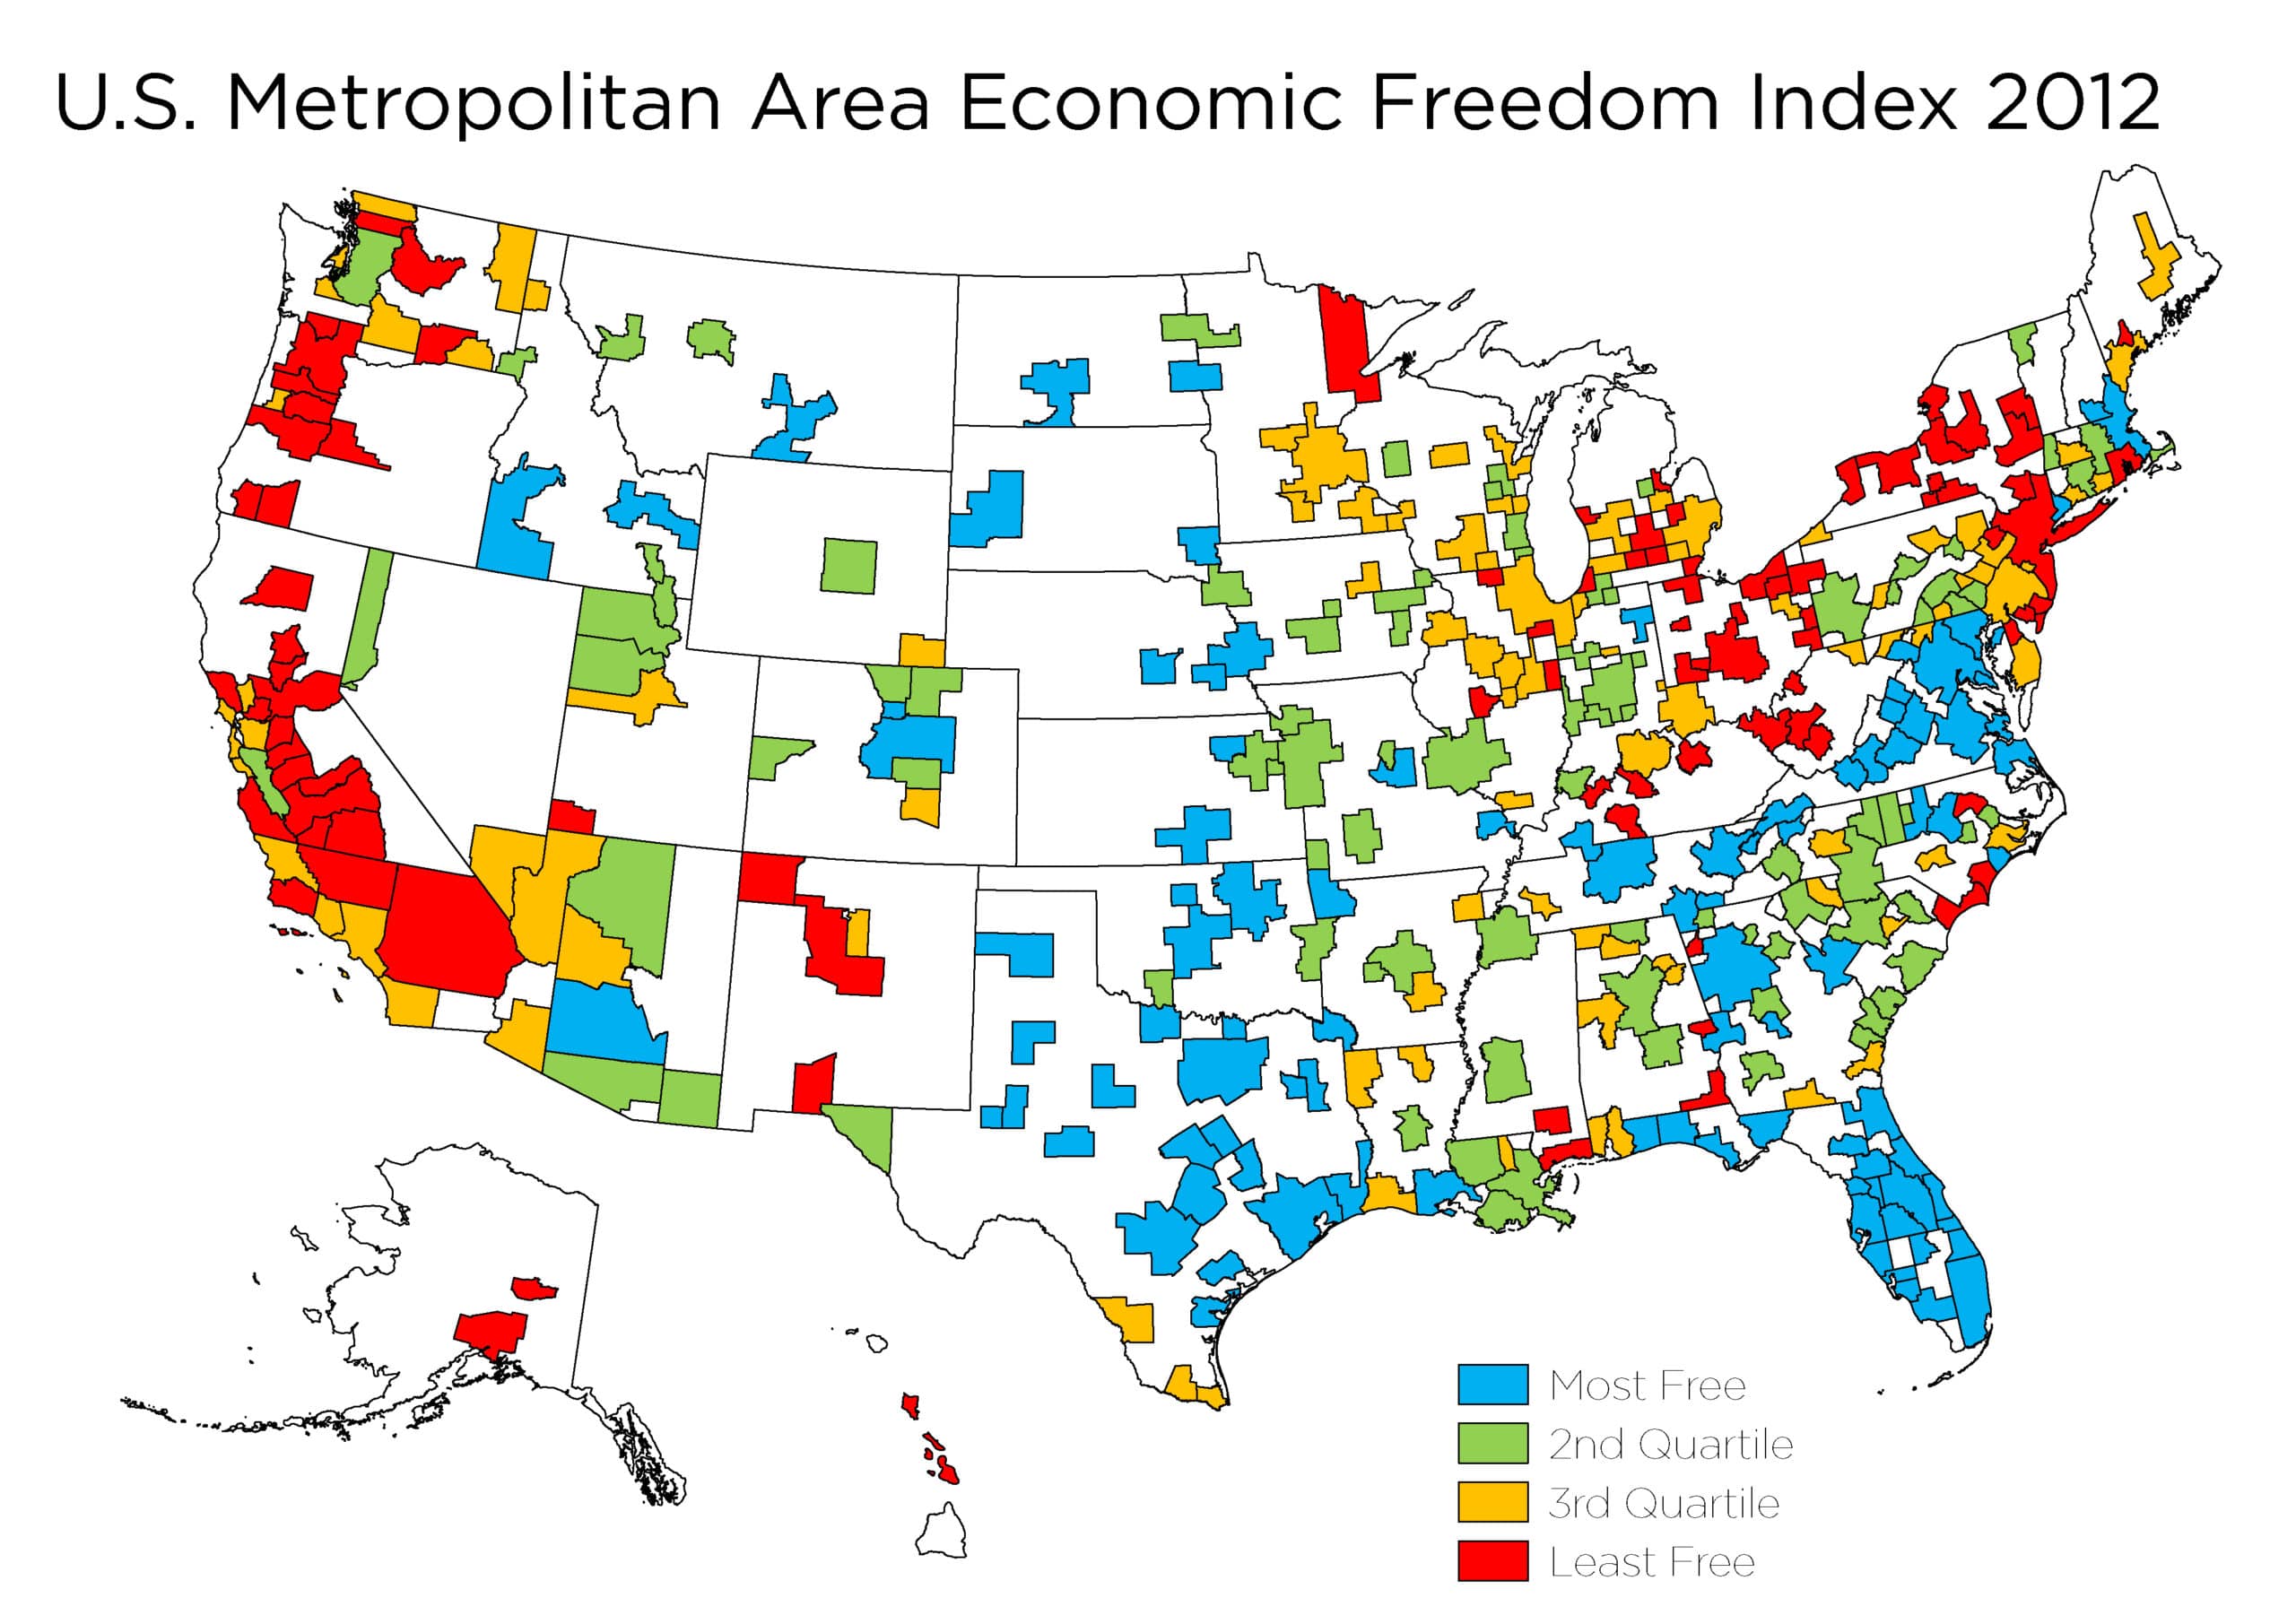
I’m not surprised to see so much red in California and New York, but I didn’t realize that Ohio (thanks for nothing, Kasich), Oregon, and West Virginia were so bad.
And the good results for Texas and Florida are predictable, but I didn’t think Virginia would look so good.

[…] to researchers, the answer is none-of-the-above. The right answer is either Riverside, CA or Oakland, […]
[…] A professor at Southern Methodist University ranked economic freedom in metropolitan areas a few years ago and you’ll notice some […]
[…] what it’s worth, there is statistical research from last decade showing places like New York and Los Angeles are among the worst of the worst, but […]
[…] P.S. If you want a ranking of economic liberty for metropolitan areas, click here. […]
[…] P.S. If you want a ranking of economic liberty for metropolitan areas, click here. […]
[…] wrote a couple of days ago about America’s best and worst cities for pro-market policy, and I noted that there are several […]
[…] wrote a couple of days ago about America’s best and worst cities for pro-market policy, and I noted that there are several […]
[…] wrote just a few days ago about The United States’s fully and worst cities for skilled-market protection, and I well-known […]
[…] does rank in the bottom half of Dean Stansel’s U.S. Metropolitan Area Economic Freedom Index, but it’s not in the bottom […]
[…] doesn’t fare well in rankings of economic liberty (see here, here, and here) and Minneapolis scores poorly when cities are […]
[…] When he crunched all the numbers, Dean Stansel of Southern Methodist University found that the Riverside-San Bernardino-Ontario […]
[…] wrote a couple of days ago about America’s best and worst cities for pro-market policy, and I noted that there are several […]
[…] wrote a couple of days ago about America’s best and worst cities for pro-market policy, and I noted that there are several […]
If you think Virginia looks surprisingly good, how about Maryland?
[…] I wrote a couple of days ago about America’s best and worst cities for pro-market policy, and I noted that there are several rankings of economic liberty for states and nations. […]
[…] wrote a couple of days ago about America’s best and worst cities for pro-market policy, and I noted that there are […]
Also surprised that Virginia came out that well, considering who we’ve had for governors recently. We used to be solid red. Now we are, at best, purple.
Has to be all of the dot.gov people in northern Virginia, and the “contractors” that hang onto them.
Reblogged this on Truth Is Power.
Self-interested trivia: it looks like the Boston/Quincy/Cambridge MSA includes New Hampshire’s Rockingham and Strafford counties. (The latter is where I live.) This MSA is ranked #17 on the “Large MSA” list.
So I’m not sure whether to view this as “glass half full” (the NH counties are improving the overall MSA score) or “glass half empty” (Boston is dragging down the MSA score.)
Don’t blame John Kasich as much as Mayor Frank Jackson in Cleveland who sets the tempo for that MSA.